Freight Facts and Figures 2010
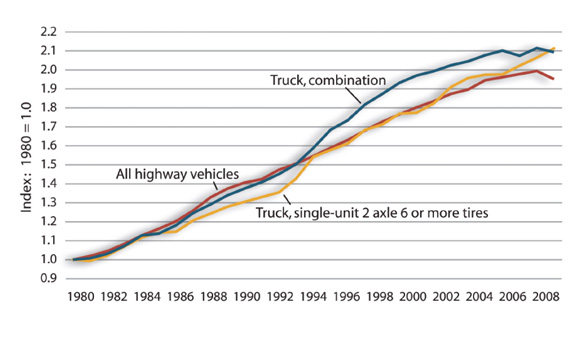
Figure 3-1. Highway Vehicle Miles Traveled by Trucks and All Vehicles: 1980-2008
The growing demand for goods and services contributes to the increase in travel by trucks at a slightly faster rate than for all vehicles.
[PDF 36KB]
Data represented in the figure.
| 1980 | 1981 | 1982 | 1983 | 1984 | 1985 | 1986 | 1987 | 1988 | 1989 | 1990 | 1991 | 1992 | 1993 | 1994 | 1995 | 1996 | 1997 | 1998 | 1999 | 2000 | 2001 | 2002 | 2003 | 2004 | 2005 | 2006 | 2007 | 2008 | |
|---|---|---|---|---|---|---|---|---|---|---|---|---|---|---|---|---|---|---|---|---|---|---|---|---|---|---|---|---|---|
| Highway, total | 1,527,295 | 1,555,308 | 1,595,010 | 1,652,788 | 1,720,269 | 1,774,826 | 1,834,872 | 1,921,204 | 2,025,962 | 2,096,487 | 2,144,362 | 2,172,050 | 2,247,151 | 2,296,378 | 2,357,588 | 2,422,696 | 2,485,848 | 2,561,695 | 2,631,522 | 2,691,056 | 2,746,925 | 2,797,287 | 2,855,508 | 2,890,450 | 2,964,788 | 2,989,430 | 3,014,371 | (R) 3,032,399 | 2,973,509 |
| Truck, single-unit 2-axle 6 or more tires | 39,813 | 39,568 | 40,658 | 42,546 | 44,419 | 45,441 | 45,637 | 48,022 | 49,434 | 50,870 | 51,901 | 52,898 | 53,874 | 56,772 | 61,284 | 62,705 | 64,072 | 66,893 | 68,021 | 70,304 | 70,500 | 72,448 | 75,866 | 77,757 | 78,441 | 78,496 | 80,344 | (R) 82,014 | 83,951 |
| Truck, combination | 68,678 | 69,134 | 70,765 | 73,586 | 77,377 | 78,063 | 81,038 | 85,495 | 88,551 | 91,879 | 94,341 | 96,645 | 99,510 | 103,116 | 108,932 | 115,451 | 118,899 | 124,584 | 128,359 | 132,384 | 135,020 | 136,584 | 138,737 | 140,160 | 142,370 | 144,028 | 142,169 | (R) 145,046 | 143,507 |
| Highway, total | 1.000 | 1.018 | 1.044 | 1.082 | 1.126 | 1.162 | 1.201 | 1.258 | 1.327 | 1.373 | 1.404 | 1.422 | 1.471 | 1.504 | 1.544 | 1.586 | 1.628 | 1.677 | 1.723 | 1.762 | 1.799 | 1.832 | 1.870 | 1.893 | 1.941 | 1.957 | 1.974 | (R) 1.99 | 1.947 |
| Truck, single-unit 2-axle 6 or more tires | 1.000 | 0.994 | 1.021 | 1.069 | 1.116 | 1.141 | 1.146 | 1.206 | 1.242 | 1.278 | 1.304 | 1.329 | 1.353 | 1.426 | 1.539 | 1.575 | 1.609 | 1.680 | 1.709 | 1.766 | 1.771 | 1.820 | 1.906 | 1.953 | 1.970 | 1.972 | 2.018 | (R) 2.06 | 2.109 |
| Truck, combination | 1.000 | 1.007 | 1.030 | 1.071 | 1.127 | 1.137 | 1.180 | 1.245 | 1.289 | 1.338 | 1.374 | 1.407 | 1.449 | 1.501 | 1.586 | 1.681 | 1.731 | 1.814 | 1.869 | 1.928 | 1.966 | 1.989 | 2.020 | 2.041 | 2.073 | 2.097 | 2.070 | (R) 2.11 | 2.090 |
Key: R = revised.
Source:
U.S. Department of Transportation, Federal Highway Administration, Highway Statistics (Washington, DC: annual issues), table VM-1, available at www.fhwa.dot.gov/policyinformation/statistics/2008/ as of April 25, 2010.
To view Excel files, you can use the Microsoft Excel Viewer.
![]() You will need the Adobe Reader to view the PDFs on this page.
You will need the Adobe Reader to view the PDFs on this page.