Freight Facts and Figures 2010
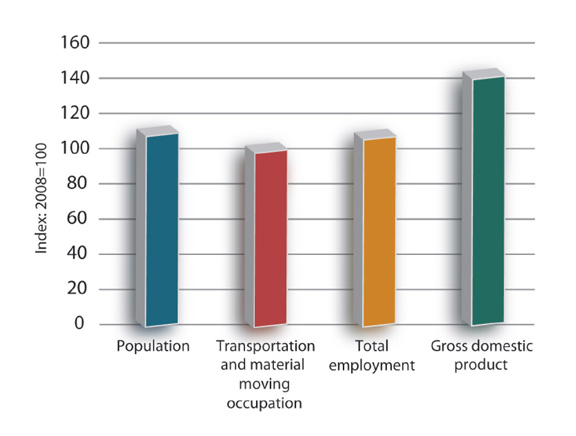
Figure 1-1. Economic and Population Projections: 2008-2018
The U.S. economy, as measured by GDP, is projected to increase by 46 percent and the U.S. population by 10 percent between 2008 and 2018. Employment in transportation and material-moving is expected to increase by 4 percent over this period, which is less than employment as a whole. These projections are based on long-term U.S. economic trends.
[PDF 32KB]
Data represented in the figure.
| 2008 | 2018 | Percent change |
|
|---|---|---|---|
| Population (thousands) | 304,375 | 339,639 | 12 |
| Transportation and material moving occupation (thousands) | 9,826 | 10,217 | 4 |
| Total employment (thousands) | 150,932 | 166,206 | 10 |
| Gross domestic product (billions of 2008 $) | 14,441 | 21,033 | 46 |
Notes: Index: 2008 = 100. The U.S. Department of Labor, Bureau of Labor Statistics, changed the name of "transportation and warehousing employment" category to "transportation and material moving occupation" in 2010.
Sources:
Population: U.S. Department of Commerce, Census Bureau, National Population Projections, available at www.census.gov/population/www/projections/summarytables.html as of April 25, 2010.
Employment: U.S. Department of Labor, Bureau of Labor Statistics, Employment by Major Industry Division, 1998, 2008, and projected 2018, available at www.bls.gov as of April 25, 2010.
GDP: Congressional Budget Office, The Budget and Economic Outlook: Fiscal Years 2009 to 2020, available at www.cbo.gov as of April 25, 2010.
To view Excel files, you can use the Microsoft Excel Viewer.
![]() You will need the Adobe Reader to view the PDFs on this page.
You will need the Adobe Reader to view the PDFs on this page.