Freight Facts and Figures 2008
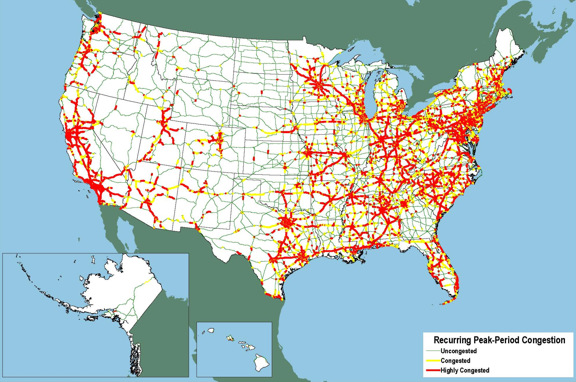
Figure 3-9. Peak-Period Congestion on the National Highway System: 2035
Assuming no changes in network capacity, increases in truck and passenger vehicle traffic are forecast to expand recurring, peak- period congestion to 40 percent of the NHS in 2035 compared with 11 percent in 2002. This will slow traffic on nearly 20,000 miles of the NHS and create stop-and-go conditions on an additional 45,000 miles.

Note:
Highly congested segments are stop-and-go conditions with volume/service flow ratios greater than 0.95. Congested segments reduce traffic speeds with volume/service flow ratios between 0.75 and 0.95
Source:
U.S. Department of Transportation, Federal Highway Administration, Office of Freight Management and Operations, Freight Analysis Framework, version 2.2, 2007.
![]() You will need the Adobe
Acrobat Reader to view the PDFs on this page.
You will need the Adobe
Acrobat Reader to view the PDFs on this page.