Freight Facts and Figures 2008
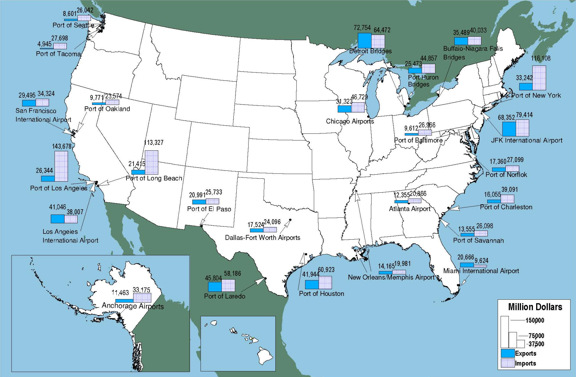
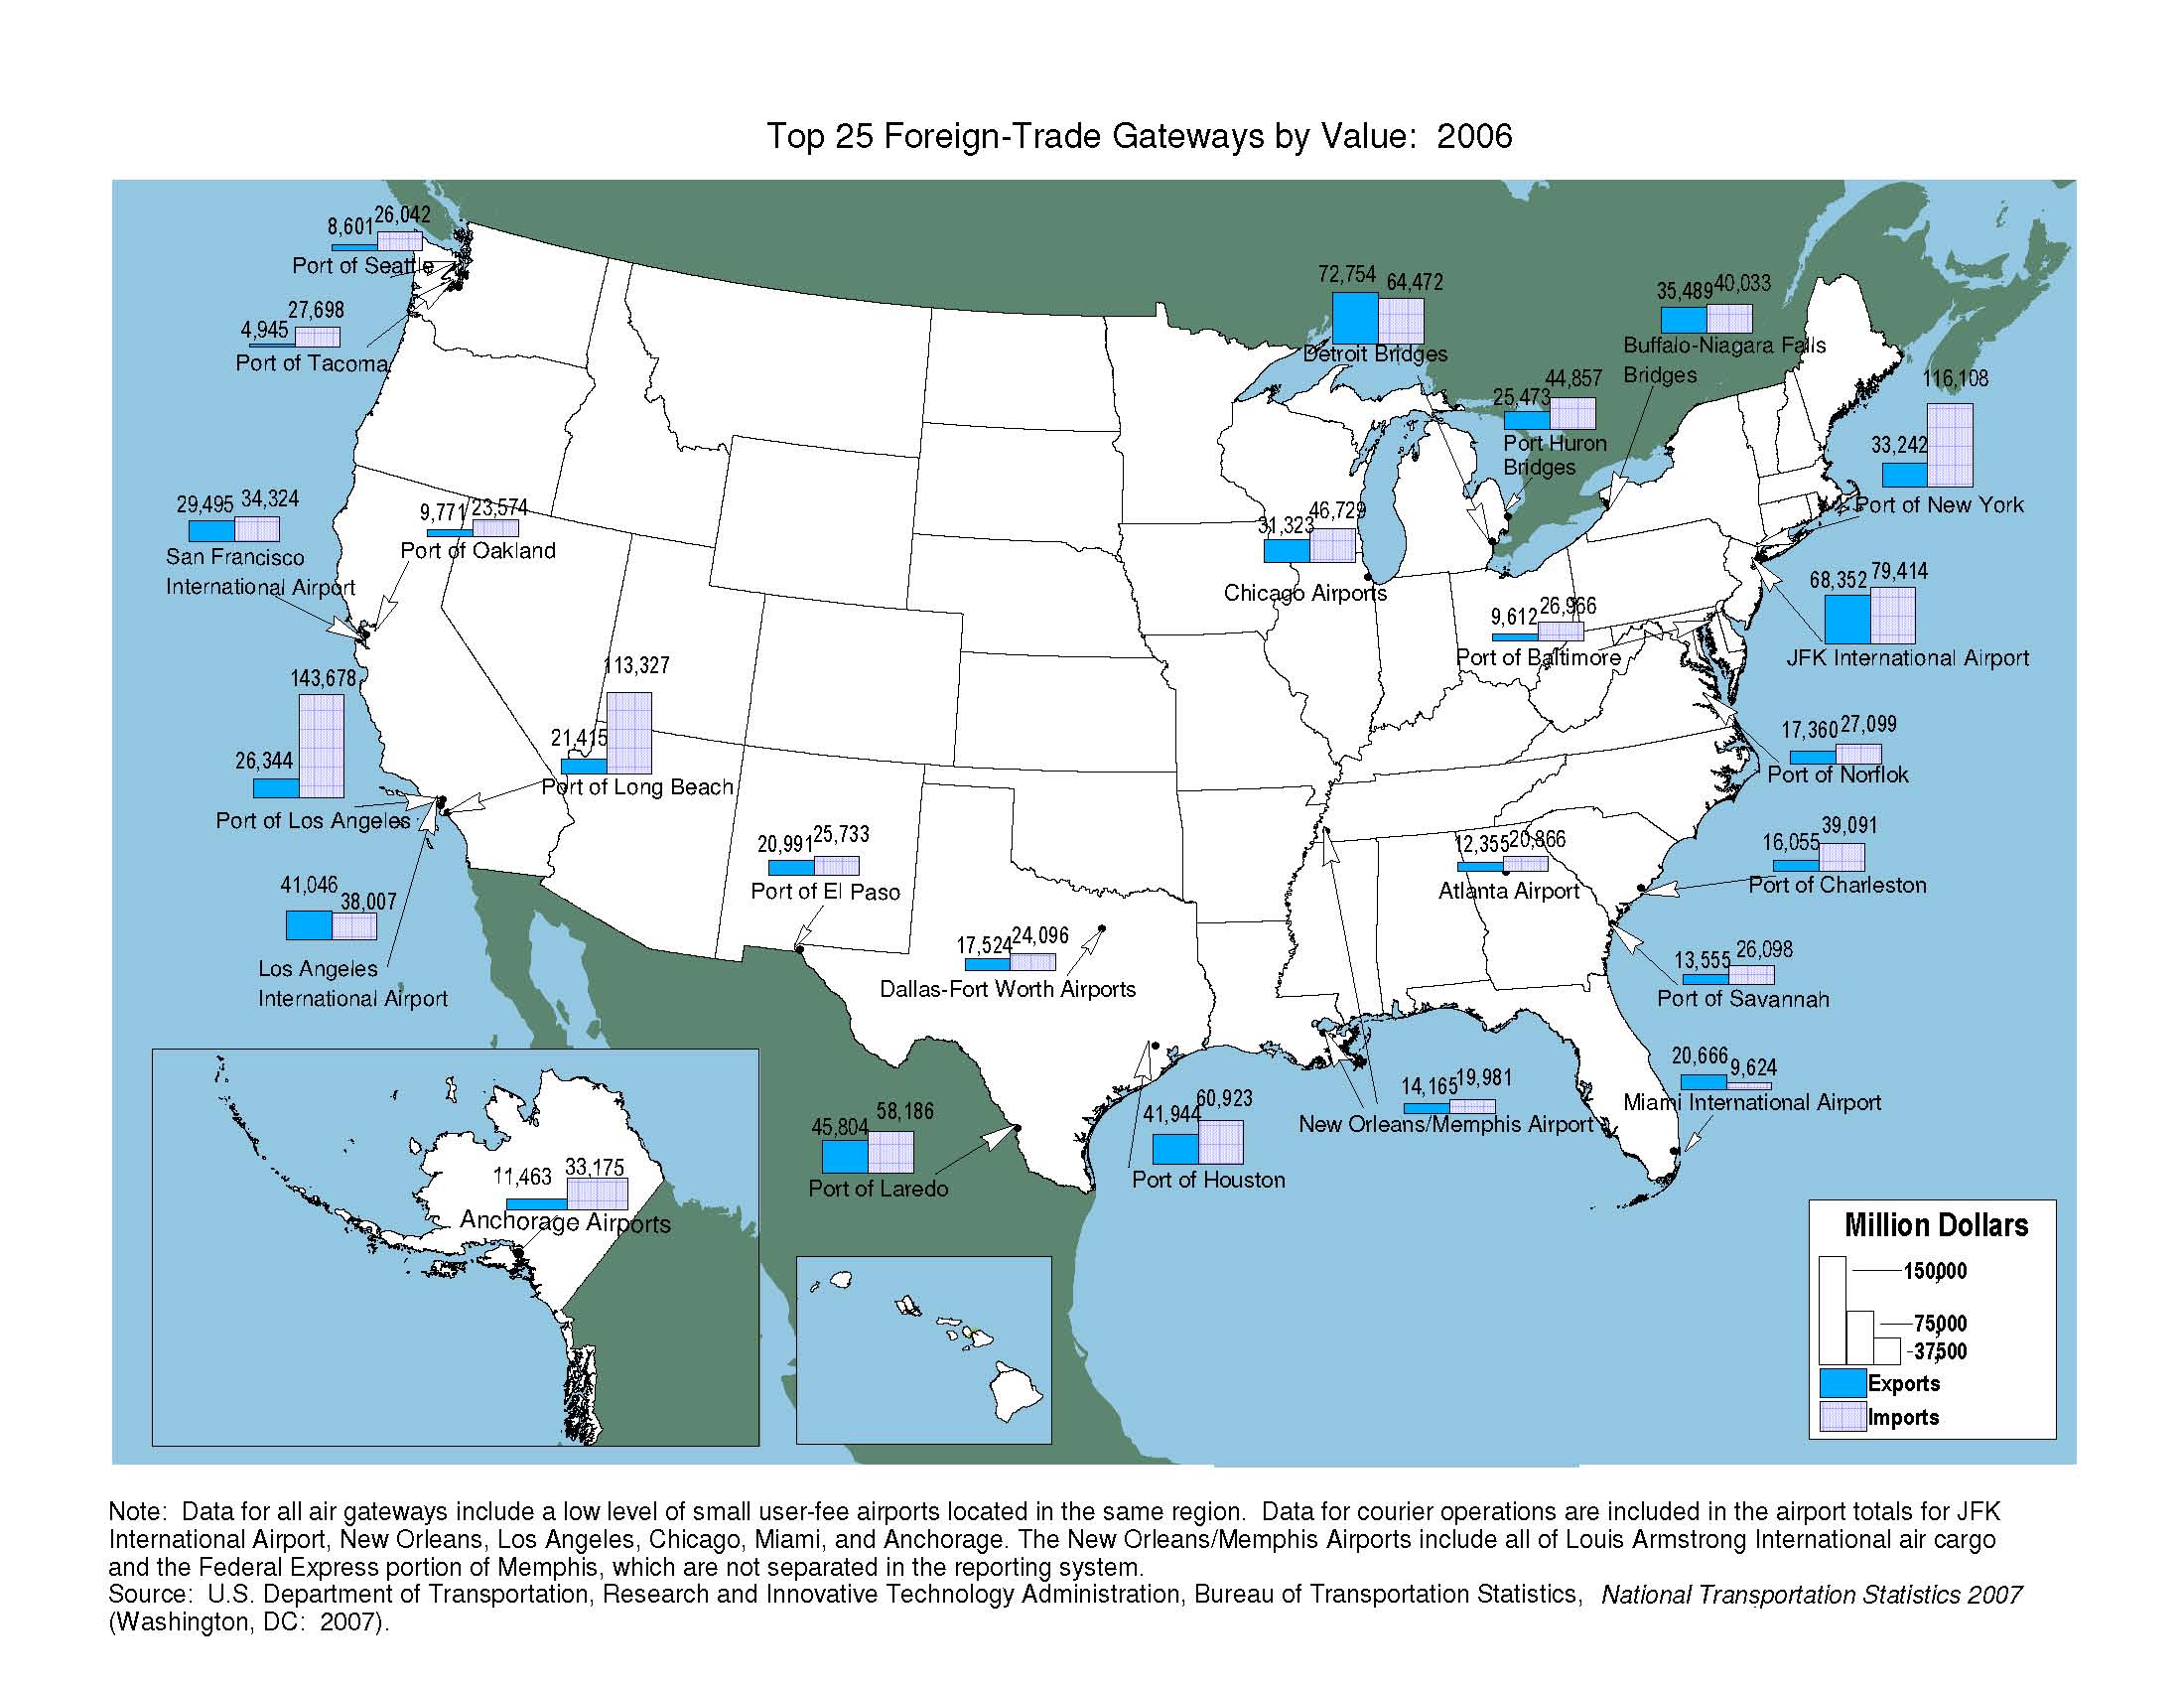
Figure 3-17. Top 25 Foreign-Trade Freight Gateways by Value: 2006
Transportation facilities that move international trade into and out of the United States demonstrate the importance of all modes and intermodal combinations to global connectivity. The top 25 foreign-trade gateways measured by value of shipments are comprised of 9 airports, 11 water ports, and 5 land-border crossings.
Data represented in the figure.
Million dollars
| Gateway | Type1 | Rank | Exports | Imports | Total |
|---|---|---|---|---|---|
| Los Angeles, CA | Water | 1 | 26,343.7 | 143,678.2 | 170,021.9 |
| New York, NY and NJ | Water | 2 | 33,241.5 | 116,107.9 | 149,349.4 |
| John F. Kennedy International, NY | Air | 3 | 68,352.5 | 79,414.4 | 147,766.8 |
| Detroit, MI | Land | 4 | 72,754.2 | 64,471.5 | 137,225.8 |
| Long Beach, CA | Water | 5 | 21,414.8 | 113,327.1 | 134,741.8 |
| Laredo, TX | Land | 6 | 45,803.7 | 58,186.1 | 103,989.8 |
| Houston, TX | Water | 7 | 41,943.9 | 60,922.7 | 102,866.6 |
| Los Angeles International, CA | Air | 8 | 41,045.7 | 38,007.4 | 79,053.2 |
| Chicago, IL | Air | 9 | 31,323.5 | 46,728.5 | 78,052.0 |
| Buffalo-Niagara Falls, NY | Land | 10 | 35,489.3 | 40,032.7 | 75,522.0 |
| Port Huron, MI | Land | 11 | 25,472.9 | 44,857.1 | 70,330.0 |
| San Francisco International, CA | Air | 12 | 29,495.0 | 34,323.9 | 63,818.9 |
| Charleston, SC | Water | 13 | 16,054.8 | 39,091.1 | 55,145.9 |
| El Paso, TX | Land | 14 | 20,990.8 | 25,733.2 | 46,724.0 |
| Anchorage, AK | Air | 15 | 11,462.9 | 33,174.6 | 44,637.4 |
| Norfolk, VA | Water | 16 | 17,359.8 | 27,099.0 | 44,458.9 |
| Dallas-Fort Worth, TX | Air | 17 | 17,523.8 | 24,095.6 | 41,619.3 |
| Savannah, GA | Water | 18 | 13,555.3 | 26,098.3 | 39,653.6 |
| Baltimore, MD | Water | 19 | 9,611.9 | 26,965.9 | 36,577.8 |
| Seattle, WA | Water | 20 | 8,600.6 | 26,042.4 | 34,643.1 |
| New Orleans, LA | Air | 21 | 14,165.1 | 19,981.3 | 34,146.4 |
| Oakland, CA | Water | 22 | 9,770.6 | 23,574.4 | 33,345.0 |
| Atlanta, GA | Air | 23 | 12,355.0 | 20,866.2 | 33,221.2 |
| Tacoma, WA | Water | 24 | 4,944.6 | 27,698.2 | 32,642.8 |
| Miami International, FL | Air | 25 | 20,666.5 | 9,623.8 | 30,290.3 |
1Water data are preliminary.
Notes:
Data for all air gateways include a low level of small user-fee airports located in the same region. Data for courier operations are included in the airport total for JFK International Airport, New Orleans, Los Angeles, Chicago, Miami, and Anchorage. The New Orleans/Memphis airports include all of Louis Armstrong International air cargo and the Federal Express portion of Memphis, which are not separated in the reporting system.
Source:
U.S. Department of Transportation, Research and Innovative Technology Administration, Bureau of Transportation Statistics, National Transportation Statistics 2007 (Washington, DC: 2007), available at www.bts.gov as of June 3, 2008.
To view Excel files, you can use the Microsoft Excel Viewer.
![]() You will need the Adobe Acrobat Reader to view the PDFs on this page.
You will need the Adobe Acrobat Reader to view the PDFs on this page.