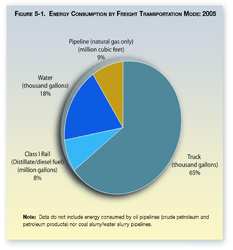
Figure 5-1. Energy Consumption by Freight Transportation Mode: 2005
In 2005, trucking accounted for 65 percent of freight transportation energy consumption. Water transportation accounted for 18 percent, natural gas pipelines for 9 percent, and Class I railroads for 8 percent.
Data represented in the figure
Table in Excel format | Historical data
| 2005 | |
|---|---|
| Truck (thousand gallons) | 4,516 |
| Class I Rail (Distillate/diesel fuel) (million gallons) | 568 |
| Water (thousand gallons) | 1,211 |
| Pipeline (natural gas only) (million cubic feet) | 603 |
Note: Data do not include energy consumed by oil pipelines (crude petroleum and petroleum products) nor coal slurry/water slurry pipelines.
Truck: U.S. Department of Transportation, Federal Highway Administration, Highway Statistics, (Washington, DC: Annual issues), table VM-1. Rail: Association of American Railroads, Railroad Facts (Washington, DC: 2006), p. 40. Water: U.S. Department of Energy, Energy Information Administration, Fuel Oil and Kerosene Sales (Washington, DC: Annual issues), tables 2 and 4; U.S. Department of Transportation, Federal Highway Administration, Highway Statistics (Washington, DC: Annual issues), table MF-24. Pipeline: U.S. Department of Energy, Natural Gas Annual 2005, DOE/EIA-0131(04) (Washington, DC: December 2006), table 15.
You will need the Adobe Acrobat Reader to view the PDFs on this page.
To view Excel files, you can use the Microsoft Excel Viewer.