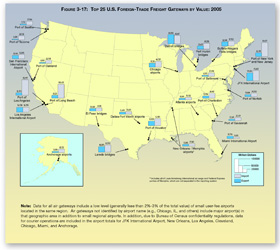
Figure 3-17: Top 25 U.S. Foreign-Trade Freight Gateways by Value: 2005 ($ Billions)
Transportation facilities for bringing international trade into and out of the United States demonstrate the importance of all modes and intermodal combinations to global connectivity. The top 25 foreign-trade gateways measured by value of shipments are comprised of 9 airports, 11 water ports, and 5 land-border crossings
Data represented in the figure
Table in Excel format | Historical data
| Gateway | Type | Rank | Exports | Imports | Total |
|---|---|---|---|---|---|
| JFK International Airport | Air | 1 | 59.3 | 75.6 | 134.9 |
| Port of Los Angeles | Water | 2 | 18.4 | 116.0 | 134.4 |
| Detroit bridges | Land | 3 | 68.8 | 61.7 | 130.5 |
| Port of New York and New Jersey | Water | 4 | 26.2 | 104.2 | 130.4 |
| Port of Long Beach | Water | 5 | 21.2 | 103.4 | 124.6 |
| Laredo bridges | Land | 6 | 40.9 | 52.8 | 93.7 |
| Port of Houston | Water | 7 | 33.8 | 52.3 | 86.1 |
| Chicago airports | Air | 8 | 29.1 | 44.3 | 73.4 |
| Los Angeles International Airport | Air | 9 | 36.5 | 36.4 | 72.9 |
| Buffalo-Niagra Falls bridges | Land | 10 | 32.5 | 38.0 | 70.5 |
| Port Huron bridges | Land | 11 | 23.6 | 44.6 | 68.2 |
| San Francisco International Airport | Air | 12 | 25.2 | 32.0 | 57.2 |
| Port of Charleston | Water | 13 | 15.9 | 36.5 | 52.4 |
| El Paso bridges | Land | 14 | 18.9 | 24.1 | 43.0 |
| Port of Norfolk | Water | 15 | 15.0 | 24.6 | 39.6 |
| Port of Baltimore | Water | 16 | 8.6 | 27.0 | 35.6 |
| Dallas-Fort Worth airports | Air | 17 | 15.4 | 19.7 | 35.1 |
| Port of Seattle | Water | 18 | 7.7 | 27.3 | 35.0 |
| Port of Tacoma | Water | 19 | 5.0 | 28.7 | 33.8 |
| Port of Savannah | Water | 20 | 11.3 | 22.1 | 33.4 |
| Port of Oakland | Water | 21 | 8.9 | 23.7 | 32.6 |
| Atlanta airports | Air | 22 | 11.6 | 18.3 | 29.9 |
| Anchorage airports | Air | 23 | 11.6 | 18.3 | 29.9 |
| New Orleans/Memphis airports1 | Air | 24 | 11.8 | 17.9 | 29.7 |
| Miami International Aiport | Air | 25 | 17.8 | 9.7 | 27.4 |
1Includes all of Louis Armstrong international air cargo and Federal Express portion of Memphis, which are not separated in the reporting system.
Note: Data for all air gateways include a low level (generally less than 2%-3% of the total value) of small user-fee airports located in the same region. Air gateways not identified by airport name (e.g., Chicago, IL, and others) include major airport(s) in that geographic area in addition to small regional airports. In addition, due to Bureau of Census confidentiality regulations, data for courier operations are included in the airport totals for JFK International Airport, New Orleans, Los Angeles, Cleveland, Chicago, Miami, and Anchorage.
Source: U.S. Department of Transportation, Research and Innovative Technology Administration, Bureau of Transportation Statistics, National Transportation Statistics 2006 (Washington, DC: 2006), available at www.bts.gov as of October 16, 2006.
You will need the Adobe Acrobat Reader to view the PDFs on this page.
To view Excel files, you can use the Microsoft Excel Viewer.