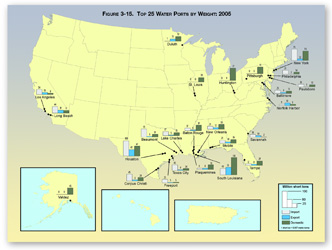
Figure 3-15. Top 25 Water Ports by Weight: 2005 (Million Short Tons)
The top 25 water ports handle about two-thirds of the weight of all foreign and domestic goods moved by water. These goods are primarily bulk commodities such as coal, crude petroleum, and grain.
Data represented in the figure
Table in Excel format | Historical data
| Imports | Exports | Domestic | Total | |
|---|---|---|---|---|
| South Louisiana, LA | 43.5 | 51.1 | 117.7 | 212.2 |
| Houston, TX | 103.2 | 41.9 | 66.6 | 211.7 |
| New York, NY and NJ | 76.6 | 11.2 | 64.3 | 152.1 |
| Huntington, WV-KY-OH | 0.0 | 0.0 | 83.9 | 83.9 |
| Long Beach, CA | 44.5 | 18.8 | 16.6 | 79.9 |
| Beaumont, TX | 55.5 | 4.6 | 18.8 | 78.9 |
| Corpus Christi, TX | 45.4 | 8.4 | 23.8 | 77.6 |
| New Orleans, LA | 21.3 | 11.8 | 32.8 | 65.9 |
| Baton Rouge, LA | 17.6 | 4.8 | 36.9 | 59.3 |
| Texas City, TX | 38.0 | 5.5 | 14.4 | 57.8 |
| Mobile, AL | 21.2 | 10.2 | 26.3 | 57.7 |
| Los Angeles, CA | 34.0 | 12.9 | 8.0 | 54.9 |
| Lake Charles, LA | 27.1 | 5.0 | 20.6 | 52.7 |
| Tampa, FL | 11.8 | 8.3 | 29.1 | 49.2 |
| Plaquemines, LA | 8.0 | 7.9 | 31.9 | 47.9 |
| Duluth-Superior, MN-WI | 0.6 | 14.0 | 30.2 | 44.7 |
| Valdez, AK | 0.0 | 0.0 | 44.4 | 44.4 |
| Baltimore, MD | 21.5 | 6.7 | 15.9 | 44.1 |
| Pittsburgh, PA | 0.0 | 0.0 | 43.6 | 43.6 |
| Philadelphia, PA | 25.9 | 0.3 | 13.1 | 39.4 |
| Norfolk Harbor, VA | 8.6 | 17.9 | 8.8 | 35.3 |
| Freeport, TX | 25.4 | 3.0 | 5.2 | 33.6 |
| Paulsboro, NJ | 18.1 | 0.2 | 13.7 | 32.1 |
| St. Louis, MO-IL | 0.0 | 0.0 | 30.3 | 30.3 |
| Savannah,GA | 18.2 | 10.1 | 1.8 | 30.1 |
Source: U.S. Army Corps of Engineers, 2004 Waterborne Commerce of the United States, Part 5, National Summaries (New Orleans, LA: 2006), table 5-2.
You will need the Adobe Acrobat Reader to view the PDFs on this page.
To view Excel files, you can use the Microsoft Excel Viewer.