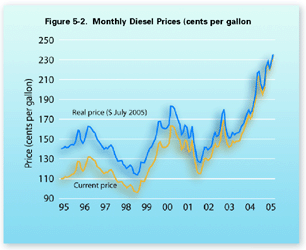
Figure 5-2. Monthly Diesel Prices (cents per gallon)
Diesel prices were about 62 percent higher in July 2005 than 10 years earlier (in inflation-adjusted terms). Over that period prices bottomed out in February 1999 at just under $1.14 a gallon (in $ July 2005).

Data represented in the figure
Table in Excel format
| Date | Current | Real ($ May 2005) |
|---|---|---|
| May-1995 | 112.6 | 143.67 |
| Jun-1995 | 112.0 | 142.62 |
| Jul-1995 | 110.0 | 139.89 |
| Aug-1995 | 110.5 | 140.28 |
| Sep-1995 | 111.9 | 141.90 |
| Oct-1995 | 111.5 | 140.99 |
| Nov-1995 | 112.0 | 141.41 |
| Dec-1995 | 113.0 | 142.45 |
| Jan-1996 | 114.5 | 143.69 |
| Feb-1996 | 114.5 | 143.35 |
| Mar-1996 | 118.3 | 147.60 |
| Apr-1996 | 127.5 | 158.58 |
| May-1996 | 127.3 | 158.03 |
| Jun-1996 | 120.1 | 148.76 |
| Jul-1996 | 117.6 | 145.34 |
| Aug-1996 | 120.1 | 148.26 |
| Sep-1996 | 126.5 | 155.65 |
| Oct-1996 | 132.3 | 162.32 |
| Nov-1996 | 132.3 | 161.75 |
| Dec-1996 | 130.9 | 159.70 |
| Jan-1997 | 129.1 | 157.17 |
| Feb-1997 | 128.0 | 155.57 |
| Mar-1997 | 122.9 | 149.33 |
| Apr-1997 | 121.2 | 147.15 |
| May-1997 | 119.6 | 145.15 |
| Jun-1997 | 117.3 | 142.10 |
| Jul-1997 | 115.1 | 139.25 |
| Aug-1997 | 116.5 | 140.60 |
| Sep-1997 | 116.0 | 139.63 |
| Oct-1997 | 118.3 | 142.12 |
| Nov-1997 | 119.2 | 143.02 |
| Dec-1997 | 116.6 | 139.88 |
| Jan-1998 | 112.0 | 134.13 |
| Feb-1998 | 108.4 | 129.91 |
| Mar-1998 | 106.3 | 127.34 |
| Apr-1998 | 106.7 | 127.65 |
| May-1998 | 106.9 | 127.61 |
| Jun-1998 | 104.1 | 124.11 |
| Jul-1998 | 102.9 | 122.32 |
| Aug-1998 | 100.7 | 119.67 |
| Sep-1998 | 102.4 | 121.59 |
| Oct-1998 | 103.9 | 122.99 |
| Nov-1998 | 102.2 | 120.91 |
| Dec-1998 | 97.3 | 114.88 |
| Jan-1999 | 96.7 | 113.90 |
| Feb-1999 | 95.9 | 113.02 |
| Mar-1999 | 99.7 | 117.40 |
| Apr-1999 | 107.9 | 126.27 |
| May-1999 | 107.3 | 125.51 |
| Jun-1999 | 107.4 | 125.58 |
| Jul-1999 | 112.2 | 130.58 |
| Aug-1999 | 117.2 | 136.14 |
| Sep-1999 | 121.5 | 140.51 |
| Oct-1999 | 122.8 | 141.79 |
| Nov-1999 | 126.3 | 145.62 |
| Dec-1999 | 129.2 | 148.54 |
| Jan-2000 | 135.6 | 155.46 |
| Feb-2000 | 146.1 | 166.78 |
| Mar-2000 | 147.9 | 167.88 |
| Apr-2000 | 142.2 | 161.48 |
| May-2000 | 142.0 | 160.95 |
| Jun-2000 | 142.1 | 160.20 |
| Jul-2000 | 143.4 | 161.15 |
| Aug-2000 | 146.6 | 164.77 |
| Sep-2000 | 163.7 | 183.03 |
| Oct-2000 | 163.7 | 182.74 |
| Nov-2000 | 162.1 | 180.65 |
| Dec-2000 | 156.5 | 173.95 |
| Jan-2001 | 152.4 | 168.41 |
| Feb-2001 | 149.2 | 164.57 |
| Mar-2001 | 139.9 | 154.23 |
| Apr-2001 | 142.2 | 156.29 |
| May-2001 | 149.6 | 163.68 |
| Jun-2001 | 148.2 | 161.76 |
| Jul-2001 | 137.5 | 150.42 |
| Aug-2001 | 139.0 | 151.94 |
| Sep-2001 | 149.5 | 162.93 |
| Oct-2001 | 134.8 | 147.45 |
| Nov-2001 | 125.9 | 137.65 |
| Dec-2001 | 116.7 | 127.71 |
| Jan-2002 | 115.3 | 125.91 |
| Feb-2002 | 115.2 | 125.66 |
| Mar-2002 | 123.0 | 133.70 |
| Apr-2002 | 130.9 | 141.60 |
| May-2002 | 130.5 | 141.14 |
| Jun-2002 | 128.6 | 138.93 |
| Jul-2002 | 129.9 | 140.12 |
| Aug-2002 | 132.8 | 142.75 |
| Sep-2002 | 141.1 | 151.44 |
| Oct-2002 | 146.2 | 156.64 |
| Nov-2002 | 142.0 | 151.91 |
| Dec-2002 | 142.9 | 152.71 |
| Jan-2003 | 148.8 | 158.40 |
| Feb-2003 | 165.4 | 175.17 |
| Mar-2003 | 170.8 | 180.08 |
| Apr-2003 | 153.3 | 162.10 |
| May-2003 | 145.1 | 153.68 |
| Jun-2003 | 142.4 | 150.71 |
| Jul-2003 | 143.5 | 151.54 |
| Aug-2003 | 148.7 | 156.47 |
| Sep-2003 | 146.7 | 153.87 |
| Oct-2003 | 148.1 | 155.58 |
| Nov-2003 | 148.2 | 155.85 |
| Dec-2003 | 149.0 | 156.31 |
| Jan-2004 | 155.1 | 161.94 |
| Feb-2004 | 158.2 | 164.65 |
| Mar-2004 | 162.9 | 168.86 |
| Apr-2004 | 169.2 | 175.00 |
| May-2004 | 174.6 | 179.54 |
| Jun-2004 | 171.1 | 175.46 |
| Jul-2004 | 173.9 | 178.35 |
| Aug-2004 | 183.3 | 187.93 |
| Sep-2004 | 191.7 | 196.22 |
| Oct-2004 | 213.4 | 217.23 |
| Nov-2004 | 214.7 | 217.92 |
| Dec-2004 | 200.9 | 203.97 |
| Jan-2005 | 195.9 | 198.75 |
| Feb-2005 | 202.7 | 204.89 |
| Mar-2005 | 221.4 | 222.41 |
| Apr-2005 | 229.2 | 229.06 |
| May-2005 | 219.9 | 219.88 |
Sources: Diesel price: U.S. Department of Energy, Energy Information Agency, U.S. Petroleum Prices, available at www.eia.doe.gov as of July 1, 2005.
Consumer price index: U.S. Department of Labor, Bureau of Labor Statistics, Consumer Price Index – All Urban Consumers, Monthly, available at www.bls.gov as of June 30, 2005.
You will need the Microsoft Excel Viewer to view the Excel files on this page.