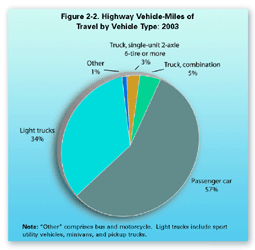
Figure 2-2. Highway Vehicle-Miles of Travel by Vehicle: 2003
Despite doubling over the past two decades, truck traffic remains a relatively small share of highway traffic as a whole. In 2003, commercial trucks accounted for about 7 percent of highway VMT. Truck VMT is comprised of 64 percent combination truck and 36 percent single-unit truck.
Data represented in the figure
Table in Excel format | Historical data
| Vehicle type | 1980 | 1990 | 2000 | 2001 | 2002 | 2003 |
|---|---|---|---|---|---|---|
| Passenger car | 1,111,596 | 1,408,266 | 1,600,287 | 1,628,332 | (R) 1,658,474 | 1,660,828 |
| Light trucks | 290,935 | 574,571 | 923,059 | 943,207 | (R) 966,034 | 998,004 |
| Other | 16,273 | 15,283 | 18,059 | 16,716 | (R) 16,397 | 16,177 |
| Truck, single-unit 2-axle 6-tire or more | 39,813 | 51,901 | 923,059 | 72,448 | (R) 75,866 | 77,562 |
| Truck, combination | 68,678 | 94,341 | 135,020 | 136,584 | (R) 138,737 | 138,322 |
Key: R = revised
Note: “Other” comprises bus and motorcyle. Light trucks include sport utility vehicles, minivans, and pickup trucks.
Source: U.S. Department of Transportation, Federal Highway Administration, Highway Statistics (Washington, DC: Annual issues), table VM-1, and www.fhwa.dot.gov/ohim/ohimstat.htm as of June 23, 2005.
You will need the Microsoft Excel Viewer to view the Excel files on this page.