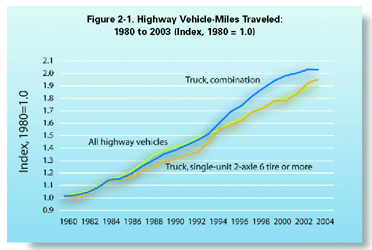
Figure 2-1. Highway Vehicle-Miles of Traveled: 1980 to 2003
As the demand for goods and services grows, so does the amount of truck traffic on the nation's highways. Commercial truck travel has doubled over the past two decades, about the same as highway travel as a whole. Consequently, truck vehicle-miles traveled (VMT) as a share of all VMT has remained relatively stable. Over this period, travel by combination trucks grew slightly faster than by single unit trucks.

Data represented in the figure
Table in Excel format
| 1980 | 1981 | 1982 | 1983 | 1984 | 1985 | 1986 | 1987 | 1988 | 1989 | 1990 | 1991 | 1992 | 1993 | 1994 | 1995 | 1996 | 1997 | 1998 | 1999 | 2000 | 2001 | 2002 | 2003 | |||
|---|---|---|---|---|---|---|---|---|---|---|---|---|---|---|---|---|---|---|---|---|---|---|---|---|---|---|
| Highway, total | 1,527,295 | 1,555,308 | 1,595,010 | 1,652,788 | 1,720,269 | 1,774,826 | 1,834,872 | 1,921,204 | 2,025,962 | 2,096,487 | 2,144,362 | 2,172,050 | 2,247,151 | 2,296,378 | 2,357,588 | 2,422,696 | 2,485,848 | 2,561,695 | 2,631,522 | 2,691,056 | 2,746,925 | 2,797,287 | 2,855,508 | 2,890,893 | ||
| Truck, single-unit 2-axle 6 tire or more | 39,813 | 39,568 | 40,658 | 42,546 | 44,419 | 45,441 | 45,637 | 48,022 | 49,434 | 50,870 | 51,901 | 52,898 | 53,874 | 56,772 | 61,284 | 62,705 | 64,072 | 66,893 | 68,021 | 70,304 | 70,500 | 72,448 | 75,866 | 77,562 | ||
| Truck, combination | 68,678 | 69,134 | 70,765 | 73,586 | 77,377 | 78,063 | 81,038 | 85,495 | 88,551 | 91,879 | 94,341 | 96,645 | 99,510 | 103,116 | 108,932 | 115,451 | 118,899 | 124,584 | 128,359 | 132,384 | 135,020 | 136,584 | 138,737 | 138,322 | ||
| Highway, total | 1.00 | 1.02 | 1.04 | 1.08 | 1.13 | 1.16 | 1.20 | 1.26 | 1.33 | 1.37 | 1.40 | 1.42 | 1.47 | 1.50 | 1.54 | 1.59 | 1.63 | 1.68 | 1.72 | 1.76 | 1.80 | 1.83 | 1.87 | 1.89 | ||
| Truck, single-unit 2-axle 6 tire or more | 1.00 | 0.99 | 1.02 | 1.07 | 1.12 | 1.14 | 1.15 | 1.21 | 1.24 | 1.28 | 1.30 | 1.33 | 1.35 | 1.43 | 1.54 | 1.57 | 1.61 | 1.68 | 1.71 | 1.77 | 1.77 | 1.82 | 1.91 | 1.95 | ||
| Truck, combination | 1.00 | 1.01 | 1.03 | 1.07 | 1.13 | 1.14 | 1.18 | 1.24 | 1.29 | 1.34 | 1.37 | 1.41 | 1.45 | 1.50 | 1.59 | 1.68 | 1.73 | 1.81 | 1.87 | 1.93 | 1.97 | 1.99 | 2.02 | 2.01 | ||
Source: U.S. Department of Transportation, Federal Highway Administration, Highway Statistics (Washington, DC: Annual Issues).
You will need the Microsoft Excel Viewer to view the Excel files on this page.