Large and Growing Demand for Freight Transportation
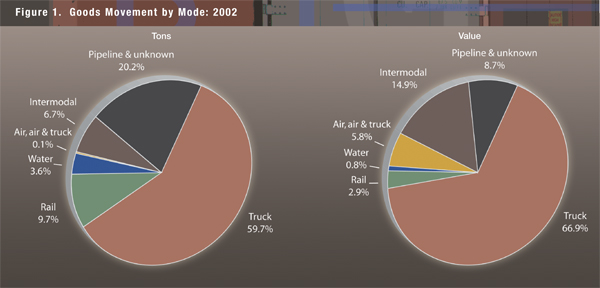
According to the Freight Analysis Framework (FAF), the U.S. transportation system moved an average of 53 million tons of freight worth $36 billion per day in 2002 to serve 109 million households, 24.8 million business establishments, and almost 88,000 units of government (USDOC Census Bureau 2006). More than one-half of the tonnage moved within local areas, and less than 10 percent was an import from or export to another country. Trucks hauled close to 60 percent of the weight and two-thirds of the value of shipments (Figure 1). Goods transported by more than one mode accounted for only 1 percent of domestic tons, but represented 60 percent of the weight of exports and almost 70 percent of imports.
FAF provisional estimates1 for 2007 show an increase in tons moved by truck, rail, pipeline, intermodal, and air modes, with a slight decrease in tonnage moved by water. While the volume of freight moved by air and intermodal modes grew at faster rates between 2002 and 2007, the truck mode experienced an increase of more than ten percent in the same five years and carried more total tonnage than all other modes combined. These provisional estimates are consistent with annual growth rates in the FAF forecast for 2035.
Source: U.S. Department of Transportation, Federal Highway Administration, Office of Freight Management and Operations, Freight Analysis Framework, version 2.2, 2007.
| Mode | 2002 (million tons) |
Percent | 2035 (million tons) |
Percent | Percent Change 2002-2035 |
|---|---|---|---|---|---|
| Total | 19,328 | 100.0 | 37,211 | 100.0 | 92.5 |
| Domestic | 17,670 | 91.4 | 33,667 | 90.5 | 90.5 |
| Imports plus exports | 1,658 | 8.6 | 3,544 | 9.5 | 113.7 |
Source: U.S. Department of Transportation, Federal Highway Administration, Office of Freight Management and Operations, Freight Analysis Framework, version 2.2, 2007.
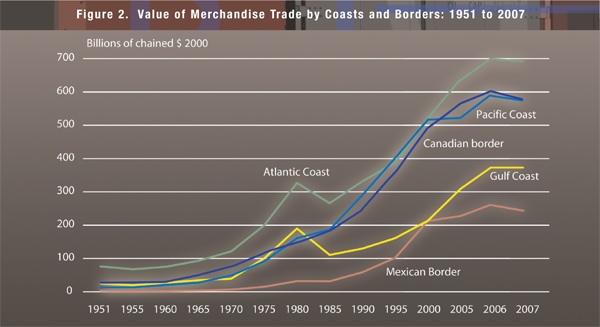
The volume of freight increases as the economy expands and, in some cases, at a much greater rate. Between 1999 and 2004, container traffic increased 44 percent while U.S. Gross Domestic Product (GDP) in constant dollars increased 13 percent (USDOT MARAD 2004 and EOP 2008). Over the next three decades, U.S. GDP is expected to grow by almost 3 percent annually, driven in part by a population increase from 300 million people in 2008 to almost 380 million in 2035 (NSTP-RSC 2007 and USDOC Census Bureau 2004a). As a result, domestic tons are forecast to increase 2 percent each year, almost doubling between now and 2035 (Table 1). International trade is expected to increase even faster, which is consistent with its substantial growth rate over the last four decades (Figure 2).
In addition to moving larger volumes of freight, the transportation system is moving goods over greater distances. During the past decade, domestic tons transported increased by slightly more than 20 percent while ton miles rose by almost 30 percent (USDOT BTS 2006). This increase in the weighted average distance of shipments may be caused by the growth in East Coast demand for Asian products that are reshipped through the West Coast, the increase in agricultural exports, and the shift by Midwestern power plants from local sources to Powder River Basin coal.
1 Provisional estimates are less detailed and based on less complete observations than the FAF base year estimate for 2002.
To view Excel files, you can use the Microsoft Excel Viewer.