1. Results of the Foundational National Analysis
This report builds on and updates the 2003 report, "Analysis of Benefits of Highway-Freight Improvements, Phase II, Final Report."[2] That paper reports the results of a national analysis of the long-term benefits of highway-freight improvements by examining the dynamic interactions between transportation demand, transportation costs, and the condition and performance of the Nation's highway system. The national analysis assessed these interactions beyond traditional travel time savings within the conventional benefit cost analysis framework. That is, the methodology adopted allowed for the quantification of the effects of transportation system improvements in relation to (1) immediate cost reduction to carriers and shippers; (2) the impact of improved logistics while keeping output fixed; and (3) additional gains from reorganization such as increased demand and new or improved products.
This report relies on the methodology developed under Phase II to construct a regional analysis of freight demand with respect to highway performance with a goal of determining regional differences in the demand structure and ultimately developing regional estimations of the additive value of performance improvements beyond the value of time savings.
The sections below summarize the methodology employed and the results of the national analysis. A comprehensive discussion of the methodology can be found in Appendix 2.
1.1 Methodology
The model initially developed for the national analysis relates the demand for freight transportation to both freight transport charges (the monetary-cost of shipping goods) and highway performance (including the quality of shipping services, such as travel or delivery times and travel time reliability). Freight charges are believed to depend on highway performance since average vehicle speed and speed cycling directly affect carrier's costs and, presumably, shipping rates. The two-equation model examined for the national analysis can be expressed as:
D = f (R, V/C, FD1, FD2,…) +
Errors1 Equation 1
R = f (V/C, FR1, FR2,…) +
Where:
- D is the demand for freight (expressed in truck miles or truck daily traffic),
- R is the freight rate (money cost charged by carriers),
- V/C is the Volume-to-Capacity ratio, or other measures of highway performance,
- FD1, FD2,… are other determinants of freight demand (independent of both R and V/C),
- FR1, FR2,… are other determinants of freight rates (independent of V/C), and
- Errors1 are independent ofErrors2.
Equations 1 and 2 show that highway performance affects the demand for freight transportation both directly and indirectly through its impact on freight charges.
1.2 The Data
Data on 30 corridors located across the Nation were collected for the national analysis. These corridors have significant freight volumes. They vary greatly in length (ranging from 105 miles for Harrisburg-Philadelphia to 734 miles for Salt Lake City-San Francisco), total traffic, and congestion levels.
Truck traffic volumes were used as a measure of freight demand. These traffic volumes were estimated from two primary sources: the HPMS and FAF. Highway performance measures were estimated on the basis of information reported in HPMS. Two principal measures were used: the average Volume-to-Capacity (V/C) ratio (averaged over all HPMS segments), and total delay (aggregated over all sample segments).
Freight rates were collected from a sample of truckload and less-than-truck-load companies (as posted on their Web sites); historical data on freight rates were gathered from a rate bureau.[3] Other determinants or control variables were derived from a variety of sources, including the Bureau of Economic Analysis, the Bureau of Labor Statistics, and the Census Bureau.
Figures 1 and 2 illustrate two important relationships derived from the cross-sectional data used in the national analysis:
- The relationship between highway performance (measured by the V/C ratio) and freight charges (in dollars per mile); and
- The relationship between freight charges (in dollars per mile) and freight demand (measured by the average number of trucks passing through the corridor daily).
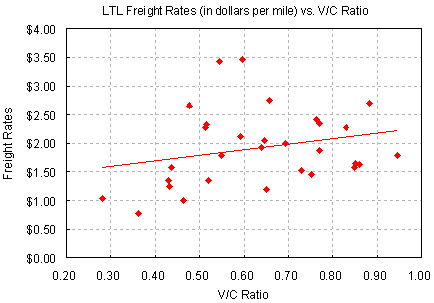
Figure 1. Cross-Sectional Relationship between Highway Performance and Freight Charges
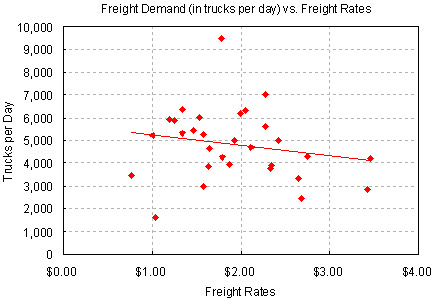
Figure 2. Cross-Sectional Relationship between Freight Charges and Freight Demand
Although Figures 1 and 2 indicate a general relationship with the existing data points, there is not a visible relationship between these variables once the outliers are taken out of the dataset.
The dataset used in the regression work was initially developed for a cross-sectional analysis, where variations in freight demand across the 30 sampled corridors were examined at one point in time (1998). In a later stage, the dataset was expanded to accommodate eight extra years of data from 1993 through 2000.
1.3 Summary of Empirical Findings, National Analysis
The cross-section analysis demonstrated that highway performance variables, such as delay and V/C ratio, are positively correlated with freight demand. These estimated correlation coefficients are inconsistent with expectations. Hence, the results of the cross-section analysis of 30 corridors were inconclusive with the existing dataset.[4] In order to understand the true nature of the relationship between highway performance measures and freight demand and freight charges, a panel data analysis was conducted for a similar set of corridors.
Panel data regression results suggested that there is a negative relationship between demand for freight transportation and highway performance measures. Hence, congestion on highways, holding other variables constant, reduces truck traffic over a specific corridor.
Results from the panel data analysis indicated as expected: a negative relationship between measures of highway performance (delay per mile) and truck traffic; and, in most instances, a negative relationship between freight rates (in dollar per mile) and truck traffic. An overview of the results of the national panel data analysis is provided below:
- Regression outcomes were particularly encouraging with a pooled specification (where cross-sectional and time-series data units are pooled together as one dataset; and where cross-sectional variations are not explicitly differentiated from time-series variations). Under such a specification, the coefficient on the delay variable and the coefficient on the freight-rate variable were both significantly different from zero and of the expected sign (negative). There were, however, indications of possible serial correlation problems, limiting the validity of the coefficient estimates.
- In an effort to limit serial correlation problems and improve on the estimation, fixed effects (corridor-specific constants) were used in the estimation. Under most specifications using this approach, the coefficient on highway performance (V/C ratio and delay) was still significant and had the expected sign. The coefficient on truck rates, however, was either insignificant or significant with a sign contrary to expectations.
Table 1 provides a summary of findings regarding the impact of changes in highway performance on freight demand. Again, these results should be interpreted with some caution given the difficulties and data limitations encountered in the course of this project.
| Model/Reference | Coefficient Estimate (t-stat) | Mean Sample Value | Slope | Implied Elasticity | Interpretation |
|---|---|---|---|---|---|
| Pooled Regression Y = LOG(AADTT) X = Delay per Mile |
-0.001834 (-4.39) |
Y = 8.80570 X = 3.94823 |
-12.2 | -0.0072 | Other things being equal, a 10% increase in delay per mile reduces freight demand by 0.07%. |
| Fixed Effects Y = LOG(AADTT) X = Delay per Mile |
-0.002575 (-5.19) |
Y = 8.80570 X = 3.94823 |
-17.2 | -0.0102 | Other things being equal, a 10% increase in delay per mile reduces freight demand by a tenth of a percent. |
| Fixed Effects Y = LOG(AADTT) X = V/C Ratio |
-0.145737 (-6.01) |
Y = 8.80570 X = 0.58245 |
-972.4 | -0.0849 | Other things being equal, a 10% increase in the V/C ratio reduces freight demand by about 1%. |
Overall, the estimated impact ranges from 0.07% to 1.00% reduction in freight demand (measured by average daily truck traffic) for every 10% increase in measured congestion. Conversely, a highway improvement leading to a 10% reduction in measured congestion, from a V/C ratio of 0.60 to a V/C ratio of 0.54 for example, would increase truck movements along the improved highway segment by about 1.0 percent.
Freight Rate Equation
The microeconomic framework, developed in Phase I of the Freight Benefit/Cost Study, uses elasticity of transportation demand with respect to both transportation performance measures and the transportation charges (price) in estimating indirect benefits of transportation investments.
Attempts to estimate this price elasticity from the cross-sectional analysis failed. There was not enough evidence to indicate a significant relationship between measures of highway performance and freight charges (in $ per mile). In most of the specifications tested for the national analysis, the coefficient on V/C ratio or delay were found to be positive as expected, but not statistically significant.
Results from the panel data analysis are even less convincing with, in many cases, a negative coefficient on highway performance measures, indicating that other things being equal, increasing levels of congestion would reduce freight charges.
Possible explanations for these poor results include:
- Data availability problems: Only Less-than-Truck-Load (LTL) rates were available on a time series basis;
- Data quality problems: Large and seemingly inexplicable variations in congestion indices were found in HPMS; variations in segment length and segment selection were also found along some of the sample corridors;
- Specification problems: The freight-rate equation estimation attempted here does not explicitly account for the supply of truck shipping services in the sampled corridors. The regressions might be capturing the fact that highly traveled corridors are also those where competition among truckers is more intense, leading to lower shipping rates. Various measures of economic activity and truck traffic were used as explanatory variables in an attempt to control for such effects.
Price elasticity estimates were therefore drawn from a meta-analysis of the existing literature. The same price elasticity approach was used for the regional analysis.
1.3.1 Additive Freight Reorganization Benefit
The national analysis estimated total benefits associated with highway investment by establishing a relationship between highway performance measures and freight demand. The additive reorganization benefit calculation captures the impact of highway investments on freight usage and changes in logistics practices. This calculation is used to estimate the total benefits where the existing data allows estimation of only the direct effects. Table 2 summarizes the range of the implied elasticities and additive benefit for the average corridor in our sample. The median implied elasticity is the average of three elasticity figures presented in Table 1. The benefits described below were estimated by using HLB's Benefit Estimation Spreadsheet Model described in Section 3.2.
| Lower | Median | Upper | |
|---|---|---|---|
| Implied Elasticity | -0.0916 | -0.056 | -0.02 |
| Additive Benefit Factor | 14.7% | 16.0% | 18.1% |
These results indicate that the benefits of highway investment due to industrial reorganization and associated productivity effects in the real economy add an estimated 16% to conventionally measured freight benefits when assessed from a national perspective.
- http://ops.fhwa.dot.gov/freight/freight_analysis/improve_econ/
- Historic data on trucking rates were collected from SMC3 (previously known as the Southern Motor Carriers).
- Poor empirical results were probably attributable to the inability to control for all factors affecting freight demand within a cross-sectional framework.