Twin Cities Freight Peer Exchange
Executive Summary
Overview and Purpose
This report describes highlights from a one-day peer exchange held in December 2010 at the Minnesota Department of Transportation's (Mn/DOT) offices in St. Paul, Minnesota. Mn/DOT and the Metropolitan Council (Met Council) hosted the exchange, which was sponsored by the Federal Highway Administration's (FHWA) Freight Peer-to-Peer Program.1 The peer exchange was part of the Twin Cities Metro Area (TCMA) Regional Freight Initiative, which Mn/DOT and Met Council are leading with the support of the U.S. Department of Transportation's (DOT's) Volpe National Transportation Systems Center (Volpe Center).
The purpose of the peer exchange was to share information on four priority freight topics selected by the hosts among all six participating organizations. This information helped provide important insights to all participants – not only Mn/DOT and Met Council – on effective approaches for freight planning and other freight processes. Appendix B provides additional details on the peer exchange process and format. Appendix C provides the complete agenda and questions used to guide discussion of each of the four topics. Appendix D and Appendix E provide additional peer materials for reference.
Over twenty people participated in the peer exchange, including representatives from the host agencies, the Delaware Valley Regional Planning Commission (DVRPC), the Mid-Ohio Regional Planning Commission (MORPC), the Puget Sound Regional Council (PSRC), and the Washington State DOT (WSDOT). Staff from the Volpe Center helped design, facilitate, and document the meeting. FHWA's contractor, SAIC, took notes during the peer exchange. A complete list of organizations that participated is provided in Appendix A.
Peer Exchange Highlights
Discussions during the peer exchange generated several themes related to the state of the practice in public sector freight planning:
- Many freight agencies around the country are struggling with similar
challenges, particularly regarding how to:
- Identify a "freight project";
- Determine appropriate public sector roles;
- Define freight's benefits (especially as related to economic competitiveness);
- Evaluate the condition of key freight infrastructure;
- Assess intra- and inter-regional freight movements;
- Identify, analyze, and interpret freight data; and
- Develop effective performance measures.
- Collaboration between MPOs and State DOTs is often informal or occurs on an ad hoc basis. There can be benefits to informal collaboration, but making these relationships more formal might help sustain them over time.
During the peer exchange, participants focused on four topics that the hosts identified prior to the event. These discussions surfaced lessons learned and best practices that Mn/DOT and Met Council (and certainly others) could incorporate in planning for freight in the Twin Cities. Key insights included:
- It is critical to identify and define what constitutes a "freight project" as well as freight's benefits. Definitions should be meaningful to specific audiences and be clear about the project's objectives and intended benefits. Definitions should also be strategic to connect with the agency's existing programming processes and larger priorities.
- There are a variety of useful strategies for incorporating and institutionalizing freight in existing transportation plans, such as considering how non-freight projects can benefit freight and vice versa.
- Having sound, reliable freight data is crucial to effective decision-making. Data are crucial to allow agencies obtain a better understanding of freight movements, respond to industry needs, develop effective performance measures and cost-benefit analyses, and other criteria to assess freight benefits or freight projects. Data needed for metro areas are significantly different and less available than state-wide or national data.
- Local jurisdictions, the private sector, and the general public must be involved in freight discussions. Peers offered many examples of successful practices from their regions, including developing county freight scan brochures to heighten awareness of freight issues.
- State DOTs and MPOs can play a number of different roles (e.g., as problem solvers, reviewers, facilitators, advocates) when interacting with stakeholders and representatives of various jurisdictions. It is important to be clear about what role is most appropriate.
Next Steps
As a result of the peer exchange, Mn/DOT and Met Council identified several areas to focus their next steps. Key areas articulated by the host agencies included:
- Continuing to learn about how to identify and define a "freight project" and freight's benefits.
- Ways to make freight projects more visible through outreach to local jurisdictions, the private sector, the general public, and others, as well as development of freight materials and performance measures.
- Mechanisms to institutionalize freight, such as by incorporating freight into a regional highway plan or developing priority freight corridors to consider as part of the interregional trade corridor system.
- Learning about when transportation enhancement (TE) funds can support freight projects.
- Methods to support multi-jurisdictional management of freight issues.
- Continuing to learn how to measure freight benefits, including developing freight performance measures (especially on a regional level) or cost-benefit analyses (that are scalable to different projects).
- Learning more about regional truck movements, perhaps by conducting a travel time analysis.
- Assessing freight data at the national level.
- Considering how Federal agencies could support obtaining national and international data on economic competitiveness as a way to identify additional opportunities for freight activity/best practices.
- Conducting outreach and coordination efforts to heighten interest in freight and learning more about specific peer efforts, including DVRPC's county freight scans and PSRC's FAST partnership.
- Assessing the local community's interest in freight issues and encouraging cities and counties to consider freight in their local comprehensive plans.
- Identifying new stakeholders to involve in freight. Specific stakeholders mentioned included the Wisconsin DOT, the Met Council Transportation Advisory Board, and new public sector agencies.
- Encouraging more engagement with inactive stakeholders to obtain quality feedback.
[ Return to table of contents. ]
Section 1: Introduction
1.1 – Peer Exchange Background and Need
The purpose of the one-day freight peer exchange was to share information among invited peer organizations and Mn/DOT and Met Council on successes, challenges, best practices, and lessons learned on several topic areas, including freight planning state of the practice and methods for engaging with stakeholders on freight issues.
Over twenty attendees participated in the event, including representatives from Mn/DOT, Met Council, staff from the Volpe Center and SAIC, and four selected peers from DVRPC, MORPC, PSRC, and WSDOT. A complete list of organizations participating is provided in Appendix A. Appendix B provides details on the peer exchange format. A complete agenda, including questions used to guide discussions, is provided in Appendix C. Appendix D and Appendix E provide additional peer materials for reference.
The peer exchange was part of a larger effort that Mn/DOT and Met Council are conducting with the support of the US Department of Transportation (DOT) Volpe National Transportation Systems Center (Volpe Center). This effort, called the Twin Cities Metro Area (TCMA) Regional Freight Initiative, will develop a strategic approach to freight planning in the Twin Cities metropolitan area. The initiative focuses on identifying and leveraging resources available at Mn/DOT and Met Council, including freight data and planning processes, to improve and strengthen overall metro freight operations and planning.
Historically, both Mn/DOT and Met Council have been involved in freight planning and implementation activities. The two agencies also have a well-established "culture of cooperation" that has strengthened their communication and collaboration. The need for a Regional Freight Initiative was identified to better integrate the agencies' freight planning processes, timelines, and approaches with the primary goal of moving freight from project programming to delivery and implementation. Additionally, Mn/DOT and Met Council saw a need to expand their network of intra- and inter-agency freight contacts to ensure more effective and efficient communication.
1.2 – Objectives and Key Issues
The objectives of the peer exchange were to share information among the hosts and peers on priority freight topics that provide insights for Mn/DOT and Met Council to use in developing an effective strategic approach for freight in the Twin Cities. Elements of the initiative include:
- Increasing freight-related collaboration efforts in the region with the private and public sectors;
- Ensuring visibility of freight issues in decision-making,
- Identifying and prioritizing viable capital projects to improve freight mobility, planning, and programming; and
- Identifying high-benefit, low-cost operational improvements and innovative institutional arrangements to support the above.
Expected outcomes of the peer exchange were the identification of best practices and lessons learned to help provide context on freight planning state of the practice and inform the Regional Freight Initiative.
[ Return to table of contents. ]
Section 2: Highlights
As a result of the peer exchange, Mn/DOT and Met Council identified lessons learned and best practices in several areas, including mechanisms to help focus outreach and coordination with stakeholders, ways to better integrate freight into transportation planning and programming, and success factors for collecting and analyzing freight data. Additionally, Mn/DOT and Met Council identified several areas of exploration to focus next steps or obtain additional information. Finally, the agencies sharpened their understanding of current national trends in freight transportation planning and discussed how to address these trends in the Twin Cities region.
While peer areas varied in terms of their specific freight processes or mechanisms for engaging with stakeholders, the event showed that the Twin Cities area is far from being an outlier. In fact, the region is grappling with similar types of issues, challenges, and lessons learned being experienced by others across the country. This reinforced the importance of the peer exchange in sharing knowledge and best practices that can be effectively applied to the Twin Cities region, and potentially many other areas.
2.1 – Lessons Learned
From the peers' presentations and roundtable discussions, Mn/DOT and Met Council identified the following as lessons learned to help strengthen freight planning in the Twin Cities area.
Freight Planning, Policy, and Decision-Making
- Carefully define what constitutes a freight project as well as freight's benefits. Definitions of a freight project and its benefits have to be meaningful to specific audiences and should clearly indicate a project's objectives. Definitions of a freight project should be strategic. DVRPC noted that identifying projects of importance to freight did not achieve the same impact as when it connected its freight projects to intermodal connectors, which are assessed as criteria during the project funding process. WSDOT stressed the importance of defining freight in terms of its contributions to economic competitiveness. On the other hand, WSDOT suggested that, rather than focus on what constitutes a freight project, Mn/DOT and Met Council focus on how freight projects can benefit many transportation users.
- Demonstrate how freight improvements can benefit other modes and vice versa. Many citizens now see freight as part of the problem, but showing how freight can help other modes will demonstrate to the general public and others that freight can also be part of the solution. In the past, Mn/DOT and Met Council have assessed the ways in which congestion mitigation efforts have impacted freight, but would now like to consider how freight projects might impact passenger vehicles. Mn/DOT and Met Council would also like to apply cost-benefit analyses to freight projects.
- Institutionalize freight as a priority by including freight projects in regional plans for other modes, including highways and rail, and quantifying freight benefits. Staff can also build on projects targeted to other modes (e.g., buses) or existing initiatives. For example, Mn/DOT and Met Council could advocate for including freight as part of the Complete Streets agenda. Many peers emphasized the importance of showing connections between freight and economic development. By institutionalizing freight within agency's planning processes, staff can be better prepared to take advantage of current funding opportunities for freight or those that might appear in the future.
- Leverage existing opportunities for freight. Mn/DOT suggested identifying freight-specific funding sources at the State or local levels whenever possible. DVRPC noted that it has assessed existing maintenance funds to see whether these can be used to support freight-related projects or freight-related components of projects. DVRPC has also developed an "FTIP" to identify freight benefits of projects already in the TIP. This serves to heighten awareness of connections between freight and existing projects.
- It is critical to ensure that freight issues are part of the overall performance planning processes. Otherwise, it will be difficult to fund freight projects, as the performance planning process is what helps identify projects for programming.
- Consider the benefits of having freight-focused plans versus plans that considered freight within other modes. Most peers had freight-focused plans and the need to plan across modes might not be as urgent in freight as it would be in highways/transit (i.e., goods move on rail because they are suited for that mode). However, intermodal connections are still critical in freight.
- Make allowances for freight even if there is no standard methodology. Peer examples underscored that there is no overarching freight planning policy or methodology for freight planning. Many agencies are "experimenting" with many types of approaches to see what works.
Freight Collaboration/Roles
- Define the public sector's most appropriate roles in communicating with the private sector. State DOTs and MPOs take many different roles (e.g., as problem solvers, facilitators, advocates) when interacting with stakeholders. For example, Mn/DOT reviews the freight components of districts' local comprehensive plans when provided and helps districts strengthen these components if necessary. DVRPC reported that it acted as a problem-solver and facilitator, while PSRC plays a coordination role, WSDOT shares expertise, and MORPC noted that it serves as a "regional information clearinghouse." It is important to carefully consider what role or roles are most appropriate and ensure that these roles are clearly communicated. Some peers and participants noted success in taking on an entrepreneurial role to proactively promote freight in its region.
- Increase local community involvement and interest in freight issues. Mn/DOT believed that State DOTs could play a stronger role to advocate for freight best practices in local communities, such as through researching and promoting design standards that accommodate freight. Several peers noted efforts to reach out to the local community through educational events, such as a "freight for a day" workshop, a freight immersion course, or printed materials, such as DVRPC's county freight scan brochures. These efforts can be very effective in heightening awareness of freight, obtaining feedback and input, and promoting freight's benefits to communities.
- Identify multi-jurisdictional coordination opportunities to bring all players to the table. For example, Mn/DOT shares a list of statewide intermodal and freight facilities with local communities and encourages them to map similar facilities outside their boundaries to identify inter-regional freight issues. DVRPC reported that it works closely with PennDOT, NJDOT, and DelDOT on efforts and all agencies are supportive of freight. Ensuring a breadth of representation can allow agencies to obtain a more comprehensive understanding of freight needs and concerns. Furthermore, multi-jurisdictional coordination can help share buy-in and responsibilities.
- Consider the benefits of more formal structures in addition to informal collaboration mechanisms between the State DOT and MPO. Many peers reported that they function with more informal or ad hoc collaboration between the state DOT and MPO; however, making these relationships more formal can help sustain them if there are personnel changes.
Data/Performance Measures
- Collect data to better understand priorities and provide a more complete understanding of different industries' needs for freight. Data can include freight infrastructure capacity/condition and intra- and inter-regional truck movements. Some industries might be able to handle congestion-related delays more than others, because time is a critical measure for some freight movements while it is not for others. Mn/DOT has conducted research on light vehicle trucks as well as on freight infrastructure condition and capacity; the agency reported that these efforts have been useful to help assess infrastructure needs and local movements.
- Collect data on economic competitiveness, but ensure the right scale for information. Some peers saw data on economic competitiveness as critical to help define freight's benefits, develop performance measures, prioritize freight projects, and generally heighten interest in freight projects. However, many jurisdictions do not have these data, which can hinder the ability to conduct economic freight analyses, and sometimes data can be unreliable. To address this issue, peers suggested getting clarity on origins and destinations for freight movements or focusing on aggregate activity levels rather than data from specific freight facilities. MORPC suggested that qualitative feedback from freight users can be equally as critical as quantitative data in "telling the story" of freight.
- When developing performance measures, connect them to others used by the agency and consider what the agency can control. Mn/DOT believed it was critical to ensure that freight measures are part of broader conversations in the agency about performance. Mn/DOT also noted that some priorities expressed by the private sector are issues over which the agency has little control. While it can be difficult to develop measures for these types of issues, Mn/DOT has sought to identify those measures that are relevant for the private sector.
2.2 – Next Steps and Areas for Further Exploration
Mn/DOT and Met Council identified several areas to focus next steps or obtain additional information:
Freight Planning/Programming
- Identifying and defining a "freight project" and freight's benefits, especially by developing freight performance measures (especially on a regional level) or cost-benefit analyses that are scalable to different projects.
- Making freight projects more visible. Efforts of particular interest were developing a freight table for the TIP, organizing freight tours to educate county and city planners, and developing freight materials such as brochures to highlight unique aspects of the freight system within specific counties.
- Learning about ways to incorporate freight in regional highway and rail plan.
- Identifying key freight corridors for volume; considering these corridors as part of the interregional trade corridor system.
- Learning about when transportation enhancement (TE) funds can support freight projects.
- Learning more about methods to support multi-jurisdictional management of freight issues.
- Learning more about challenges experienced by other regions in integrating freight into planning processes, and how these challenges were overcome.
Freight Collaboration/Roles
- Identifying and organizing opportunities to promote freight education and outreach, particularly by learning more about DVRPC's county freight brochures and considering developing something similar that would outline users of the system and where/how freight moves in the Twin Cities.
- Encouraging cities and counties to contact Mn/DOT for reviews of comprehensive plans. Currently, some cities send their comprehensive plans to Mn/DOT for review, but many do not. It was noted that many cities and counties might not be aware that Mn/DOT can help provide reviews of the plan, so Mn/DOT should promote this role.
- How messages should be tailored to different audiences, including the public and private sectors.
- Exploring outreach with the Wisconsin DOT and relevant MPOs. There is currently some freight "spillover" from Minnesota into Wisconsin that can be addressed while strengthening the working relationship with Wisconsin.
- Inviting cities and counties to attend Minnesota Freight Advisory Committee (MFAC) meetings.
- Using currently available tools to encourage local jurisdictions to consider freight in their comprehensive plans and ultimately help formalize freight programming processes. This could be potentially accomplished by including a recommendation that they address freight issues in the plans or adding freight criteria to help evaluate land use and other projects in the comprehensive plan.
- Obtaining additional information on PSRC's FAST partnership.
Data/Performance Measures
- Conducting additional studies on appropriate freight performance measures and data required, and another light vehicle truck study to update data collected several years ago.
- Moving towards better measures to evaluate infrastructure condition and capacity along key freight corridors (e.g., number of deficient bridges and rail structures). This information would help develop freight projects.
- Identifying mechanisms for better quantifying the benefits of freight projects.
- How to use performance measures to assess regional-level freight movements.
- Exploring the FHWA http://ops.fhwa.dot.gov/freight/freight_analysis/perform_meas/index.htm for information related to long-haul corridor data and freight performance measurement tools.
- Developing cost-benefit analysis methodologies that are scalable to different freight projects.
- Learning more about the travel time speed analysis conducted by WSDOT.
[ Return to table of contents. ]
Section 3: Overview of Presentations
The following section provides highlights from each peer's introductory presentation. Introductory presentations provided a description of each peer's region, information on current and future freight activities, and an outline of formal and informal mechanisms used to coordinate with stakeholders on freight issues. Please see Appendix E for additional information on each peer's agency, region, and freight activities.
3.1 – Mn/DOT and Met Council
Mn/DOT
Mn/DOT's freight program is composed of four key staff. Primary freight planning activities include identifying and developing freight components for inter-regional corridors. Mn/DOT has also developed freight plans for many of the State's regions (to date, Mn/DOT has completed plans for southwestern, western, and northern Minnesota and is now developing the plan for central Minnesota, in addition to the Regional Freight Initiative for the Twin Cities Metropolitan area).2
Freight outreach opportunities include Mn/DOT's Standing Committee to Advance Multimodal Planning Integration (SCAMPI), the Minnesota Freight Advisory Committee, and meetings of the Midwest Shippers' Association.
The Minnesota Statewide Freight Plan is the guiding document for Minnesota's freight program and describes statewide freight policy directions, specific strategies for addressing freight goals, and performance measures.
Met Council
Met Council serves a population of about 2.8 million across 190 municipalities and seven counties. The agency is governed by a transportation advisory board composed of elected officials from all seven counties, with ten city representatives appointed by municipalities. The advisory board has modal representatives, including a freight representative. In November 2010, Met Council completed an update to the 2030 Transportation Policy Plan (TPP), which includes a small section on freight.
Primary freight issues include highway and railroad congestion, freight safety and security, and rising fuel costs. The Twin Cities area is the economic driver for the Met Council region. Because the Twin Cities represent the major metropolitan region in the State, its freight needs differ from the rest of the state.
Recent freight activities include:
- Analysis on current and future congestion levels to better understand how congestion will impact the region;
- Development of freight criteria, such as proximity to freight terminals, to assess projects for funding in the statewide highway improvement program (HIP).
- Identification and designation of regionally significant freight corridors using several criteria, including reference to the National Highway System's (NHS's) list of intermodal connectors.
- Completion of the Metropolitan Highway System Investment Study (MHSIS). The MHSIS explored low cost, high benefit management solutions for freight and provided input to the 2030 TPP. Several recommendations from the MHSIS will be implemented, including employment of active traffic management strategies, a system of managed lanes, and conversion of shoulders to high occupancy toll (HOT) lanes.
Mn/DOT and Met Council have a long tradition of working collaboratively on planning issues, including freight. For example, Met Council ensures that its planning processes are coordinated with those of Mn/DOT's district office. Mn/DOT and Met Council believe this cooperative tradition is an important asset and strength; it can be supported through ongoing inter-agency communication. In particular, Mn/DOT and Met Council would like to work more closely to define freight projects' benefits and conduct cost-benefit analyses.
3.2 – DVRPC
DVRPC serves a population of 5.5 million in 553 municipalities and portions of two states (Pennsylvania and New Jersey). DVRPC has a dynamic freight program managed by two full-time DVRPC staff.
The region is currently engaged in a number of freight projects that include deepening the Delaware River from 40 to 45 feet and constructing a new general marine terminal with a highway connector in south New Jersey.
Recent DVRPC accomplishments include securing funding for a freight technical study for fiscal year 2012 and continuing high attendance at freight advisory committee meetings. Strong institutional support for the DVRPC freight program has continued despite a limited funding environment for freight projects.
DVRPC coordinates with freight stakeholders through the freight advisory committee, which meets on a quarterly basis. The committee provides feedback on freight work and funding priorities and a venue for DVRPC to communicate on the transportation improvement program (TIP) and long-range planning activities. Additionally, DVRPC has a separate intelligent transportation systems and operations committee that discusses on-the-ground operational issues.
Freight planning at DVRPC is comprehensive across modes, as many of DVRPC units (e.g., land use) are involved in freight discussions. For example, DVRPC has presented to the DVRPC regional transportation committee and the US Army Corps of Engineers (USACE) on project updates. Additionally, DVRPC exchanges information on ongoing or upcoming freight activities with private sector freight stakeholders and others, such as the I-95 Corridor Coalition, PennDOT, the Pennsylvania Turnpike, the New Jersey Turnpike Authority, and the Delaware River Port Authority.
Planned freight activities for DVRPC include:
- Identifying action items (e.g., policies and programs) for the DVRPC freight planning program each year.
- Developing regional indicators for freight-related concerns.
- Working with the U.S. Environmental Protection Agency (USPEPA) on a diesel locomotive retrofit.
- Preparing a ten-year freight plan to document future goals, including increasing freight activity in the region , updating NHS connectors, and preparing a long-range transportation plan component for freight.
3.3 – MORPC
MORPC serves a total of 1.2 million in two counties and three townships. Major projected freight trends in the MORPC region include increased freight traffic through Columbus to the Port of Virginia due to the Panama Canal expansion.3 Freight lifts at the Norfolk Southern Rickenbacker Intermodal Facility, located on the southern side of Columbus, are also expected to double.
In 1994, MOPRC conducted a series of inland port studies that identified areas of improvement for the MPO and outlined recommendations for addressing them, including establishing a freight planning program, building better public/private partnerships, and designating inland port districts to concentrate efforts. Mr. Haake reported that progress has been made on each of these areas and they continue to form a basis for MORPC's freight program.
MORPC does not have a freight advisory council; however, the Columbus Chamber of Commerce houses the Columbus Region Logistics Council. Additionally, MORPC facilitates Rickenbacker Intermodal Corridor Committee (RICC) meetings that include MPO and private sector representatives. The RICC meets on a quarterly basis and provides input on freight project priorities.
MORPC's freight activities include:
- Updating the region's rail inventory (originally released in 1968);
- Hosting a freight peer exchange with DVRPC;
- Ensuring a holistic inclusion of freight in MORPC's transportation planning efforts;
- Producing two additional inland port studies;
- Creating a Freight Fact Book; and
- Identifying freight districts.
MORPC's next steps are to develop the Central Ohio Freight Trend Study, a "next generation," data-driven freight plan that will consider freight movements in a 12-county region. The study, which is designed for both a public and private sector audience, will involve a scenario planning approach and a cost/benefit analysis of freight projects to identify priorities. The objective of the study is to demonstrate the need for infrastructure improvements and provide a basis for future private and public funding opportunities that ensure the region's continued success in the freight industry.
3.4 – PSRC and WSDOT
PSRC
PSRC serves a population of about 3.7 million in four counties, 72 cities and towns, and four port districts. The PSRC region is expected to grow by about 1.3 million by 2040. Expected future trends include smaller household sizes, different traffic patterns, and fewer households with children.
PSRC has two major mechanisms for implementing freight projects and coordinating with the private sector, described below:
- The PSRC (http://psrc.org/transportation) includes a public-private partnership for implementing and completing freight projects in the central Puget Sound region. To date, the partnership has funded or completed 21 of 25 original projects. Mr. Ardussi noted that FAST has helped PSRC successfully compete for Federal freight funding in the past, although more recently this has been difficult given the decline of Federal transportation funding availability.
- The Regional Freight Mobility Round Table (http://psrc.org/about/advisory/roundtable/) is a "sounding board" for public/private freight interests in the PSRC region. The roundtable meets bi-monthly and provides an open forum for discussing a broad range of topics related to freight and the economy. Private sector participants include representatives of warehousing/distribution centers, shippers and rail, marine, air cargo and trucking carriers. Public sector participants include universities, local governments, the ports of Seattle, Tacoma and Everett, and state/Federal agencies. The roundtable does not have a formal voting structure but is consulted by the FAST partnership and provides input into regional and state transportation plans.
PSRC coordinates with stakeholders through two primary venues. The Regional Freight Mobility Roundtable meets bi-monthly and provides opportunity for open discussion of issues and ideas among public and private stakeholders. The FAST Corridor Partnership also has bi-monthly meetings.
Recent PSRC freight activities include developing a draft freight component, or regional freight strategy, for the MPO's next long-range transportation plan, Transportation 2040. The freight strategy examines the major freight modes, including rail, truck, air, and marine cargo, and outlines a regional freight transportation system to serve the region. The strategy was developed with both public and private sector input, including from the ports of Tacoma and Seattle, King County, UPS, FedEx, Washington Trucking association members, Safeway, WSDOT, and local jurisdictions.
The freight strategy used a new methodology to identify investments that would provide the maximum mobility benefits for all freight alternatives. The methodology was based on a modeling tool integrated with the MPO's land use and travel demand model and showed that freight would benefit from the alternatives chosen to include the 2040 LRTP.
WSDOT
WSDOT's freight program focuses on investing in freight transportation infrastructure to support the state's economy. Projects including improve truck travel times and system reliability on primary freight corridors, relieving congestion in urban centers by improving and connecting major truck freight corridors, and making investments in rail capacity and port-rail connections to ensure that freight is able to accommodate future demand.
[ Return to table of contents. ]
Section 4: Roundtable Discussion
The roundtable discussions focused on four topics: 1) freight planning state of the practice; 2) strategic approaches to developing freight projects; 3) integration of freight into local planning processes; and 4) roles and methods of engagement with the private sector and other stakeholders.
4.1 – Freight Planning State of the Practice
The first topic focused on the state of freight planning practice within each peer's metropolitan region and/or State, particularly as it related to institutional arrangements between the state DOT and MPO, use of performance measures, and approaches to addressing freight modes and developing freight plans.
Best Practices in Freight Planning and Programming
- DVRPC's FTIP. DVRPC described its effort to develop a freight component of its TIP to call attention to existing freight improvement projects. The FTIP can help to promote freight and put it on the agenda. In addition, DVRPC uses freight intermodal connectors as a criterion for project evaluation. This has been successful in raising awareness of freight since it attaches real dollars to projects.
- FAST Corridor Partnership. PSRC provided additional detail on the FAST corridor partnership. The partnership has been successful because it identifies priority freight projects where needs are not being met. Because it is a collaborative process, it helped to identify projects that would have broad regional benefits.
- Transportation projects database. It can be useful to create database of transportation projects and identify how each benefits different user groups. While this can involve a lot of effort, it might help demonstrate how freight projects can benefit multiple modes.
Best Practices in Coordination/Communication
- Intermodal liaison position. DVRPC shared an example of an effective coordination initiative from PennDOT. PennDOT created an intermodal coordinator position at each of the PennDOT district offices and at the state's MPOs. The staff person functioned as a central liaison and contact for freight issues.
- Freight immersion course. DVRPC created a 1.5-day immersion course that exposed stakeholders to freight issues and trends. The purpose of the course was to build freight knowledge and professional capacity. The course has not occurred in recent years due to time constraints, but it was an effective mechanism to strengthen coordination and collaboration.
- Educational outreach events. DVRPC's website contains links to various private sector companies and freight resources. Additionally, DVRPC has conducted special events, such as a "freight plan showcase," to showcase how freight operations work in the region. As part of the showcase, shippers and carriers "manned" tables and answered questions from county and city planners on their freight movements and where they operated. DVRPC reported that this event was very successfully in educating stakeholders on freight, engaging them, and building working relationships.
- Communication with the private sector. Peers reported
many different methods but all stressed the importance of focusing communications
to avoid "spam" and unwanted correspondence. For example:
- DVRPC has a robust mailing list that it uses to keep stakeholder informed of freight projects and news. The list has various "levels" for members to control the amount of information they receive. Committee members are a smaller, more active group that receives more information. Committee friends are a larger group that does not participate as actively; they receive less information.
- MORPC manages communication through the Columbus logistics council. The agency created a series of one- to two-sided freight fact sheets that use non-technical language to explain basic freight concepts. Additionally, the agency creates short "project sheets" to provide project overviews to private sector stakeholders.
- PSRC maintains a distribution list of 300 contacts and posts all of its freight-related meeting and presentation notes online. The agency also produces project sheets on the FAST partnership and other projects. The project sheets are updated with status and cost information.
Lessons Learned in Data/Performance Measures
- Have up-to-date, comprehensive data on freight movements. Data can justify the need for freight projects or improvements, and show how freight projects will lead to performance benefits for different user types. WSDOT noted that it has purchased GPS data from vendors to develop a methodology for measuring freight performance along key corridors.
- Use quantitative data to tell the freight "story" and make the case for freight. Data help tell the "story" of freight to the general public and others to show the economic importance of freight. For example, WSDOT is now calculating the cost of truck congestion to develop a baseline analysis of goods movement. It plans to use these data to tell a compelling story to citizens, shippers, carriers, and others about how freight transportation costs affect various stakeholders. WSDOT has also experienced success using data to show how trucks operate differently from cars as well as data that shows operationally deficient bottlenecks. Using these data, WSDOT's Strategic Analysis and Programming Division has conducted an analysis of the top freight bottlenecks, which might lead to identification of improvement projects.
- Be cautious when interpreting data. PSRC noted that it is focusing on several types of data in developing performance measures, including average speed, reliability, severe congestion and traffic volume. However, it cautioned that certain data such as truck volumes must be interpreted cautiously. For example, increased truck volumes could signal increased economic activity or more congestion. It is important to avoid using data points in isolation.
- See the value of qualitative data. Input from freight users is just as valuable as quantitative data in "telling the story of freight," especially for proposed projects for which agencies do not yet have data.
- Ensure that the story is understandable to a broad audience. While data are crucial to develop a compelling story on freight, the story should not be data-centric. It is more important to ensure that a broader community, including MPO planners, boards, local elected officials, and advocates, express interest in freight and are "telling the same story."
- Work with the private sector to obtain data. When possible, obtain data from private sector carriers or shippers on additional costs they are realizing due to poor travel conditions. This type of "on the ground" information can be much more compelling to the general public and decision-makers than State DOT-developed estimations or projections. Private sector fleet service data is becoming more affordable, so public agencies might be able to more easily afford to purchase this information in the near future to help quantify truck movements.
4.2 – Strategic Approaches to Developing Freight Projects
The second topic focused on strategic approaches to developing freight projects, including effective ways to define and develop freight projects, key factors leading from planning to implementation, assessing the benefits of freight projects, and identifying resources to support freight.
Freight Funding/Planning Processes
- Identify freight-specific funding sources. Mn/DOT believed that it was important to identify freight-specific funding sources at the State or local levels to avoid spending significant amounts of time identifying alternative sources of funding.
- Look at how freight can benefit other modes. WSDOT believed that there is no "freight project." All projects can benefit multiple modes, sectors, and user types. WSDOT suggested focusing on how freight's issues are issues for all modes. Many citizens now see freight as part of the problem, but showing how freight can help other modes can demonstrate to the general public and others that freight can also be part of the solution.
- Obtain a high level of support. DVRPC's freight advisory committee is co-chaired by the deputy executive director of DVRPC. There is a high level of committee support from all levels of the government. DVRPC found it effective to conduct an executive committee meeting prior to the full committee meeting to share buy-in and responsibility and hone in on priority issues.
- Build staff expertise. PSRC has hired staff with expertise in transportation demand management modeling to focus on freight issues.
- Consider using CMAQ, TIP, and maintenance funds to support freight projects. DVRPC noted, for example, that it was able to successfully use CMAQ funds for freight projects focused on truck electrification, double-stack clearances, and other issues.
- Leverage existing opportunities for freight and be prepared for freight "windows of opportunity." DVRPC noted that it has assessed existing maintenance funds to see whether these can be used to support freight-related projects or freight-related components of projects. Freight staff should also look for, and take advantage of, any "windows of opportunity" that might appear for freight projects. Freight funding might become available unexpectedly and staff must be prepared. Data collection is critical in allowing staff to quickly identify freight priorities.
- Identify nontraditional policy areas that benefit freight. Consider other policy areas that might intersect with or benefit freight, such as regulations on industrial warehouse zones or land use. These areas go beyond those typically considered (such as access, volumes, or congestion).
- Be aware of unintended consequences. WSDOT shared an example where truck curfew led to additional congestion (since shippers were using additional trucks to move the same amount of freight in less time). Additionally, new routings imposed on shippers could be counter-productive is they are not effective or feasible for the company. Additionally, there can be disconnects between planned and actual use (e.g., adding bike lanes on a major truck corridor).
Data/Performance Measures
- Tie freight performance measures to those used more broadly by the agency. To secure resources for freight and ensure a broader, agency-level conversation about freight needs, Mn/DOT believed it was critical to connect freight performance measures to others being used by the agency. Mn/DOT has pursued these connections by developing several freight performance measures and identifying performance measures that are relevant in the private sector. One area of challenge has been in developing measures that cut across all modes.
- It is critical to collect data on economic competitiveness of freight, although these data might not be readily available and it is challenging to know how to obtain these data. WSDOT believed that connecting freight to the economy is key to attract more attention to freight. Many of the peers noted that establishing connections between freight and urban and regional competitiveness are critical to raise awareness at the legislative level. The outcome can be more funding provided to freight.
- Understand the origins and destinations for freight movements, what goods are moving through the system, and time of day information. Agencies need to better understand where and how freight moves before knowing how to allocate priorities and promote projects. In particular, local freight trips might not be well understood but these have significant impacts on the system. Met Council noted that there are certain freight movements where time is a critical measure but others where it is not. Knowing more about time-sensitive goods, as well as time of day information for goods movement, can help agencies understand how and to what extent infrastructure is being used and what industries can handle congestion-related delays. To better understand local movements, Mn/DOT conducted a light vehicle truck study several years ago. Mn/DOT also obtains some information on costs to transport goods (e.g., from the Department of Agriculture), although this information is generally not for areas (e.g., barge rates) over which Mn/DOT has control.
- Collect data on freight infrastructure capacity and condition. Mn/DOT has sponsored research in support of FHWA to assess the key characteristics of infrastructure condition and capacity along key freight corridors (e.g., number of deficient bridges). This type of data allows agencies to better assess freight infrastructure and subsequently identify priorities.
- To compare freight facilities' performance, focus on overall activity levels. DVRPC noted that it has been challenging to develop performance measures that compare various freight facilities from a refinery to a container port. DVRPC has found more success focusing on overall activity levels, such as ship arrivals in the aggregate, tonnage entered, and truck tolls paid at bridges. This information illuminates freight trends, but it is more difficult to identify which trends are positive and which are negative.
- Use online services to obtain data. MORPC has used information from www.traffic.com to do low-cost analysis on truck speeds. This information may be used to develop performance measures.
- Consider acreage and other types of data. It can be useful to collect information on how much area in the region can be zoned for ports, truck parking, railyards, industrial centers, or other types of relevant freight areas. Other useful data could include the number of cranes available for lifting containers and the location/number of truck scales.
- "Sell" improvement projects to the private sector. Understanding the relationship between congestion and cost of performance can help agencies to make more effective freight decisions. For example, MORPC worked with a major shipper in its region to demonstrate how much congestion was costing the company on an annual basis, and the company provided some funds to MOPRC. There is significant value in using data to show the private sector where the important freight corridors are and in "selling" improvement projects.
4.3 – Integration of Freight into Local Planning Processes
The third topic focused on roles and methods of engagement for freight projects, including roles of both the State DOT and MPO in improving freight mobility, general roles and approaches characterizing public-private sector coordination, effective methods in working with cities and counties, and the extent to which agencies need to understand local planning processes.
Approaches to Communication/Collaboration
- State DOTs can take a stronger role to advocate for freight best practices in local communities. While Mn/DOT now assists communities with freight issues on an as-needed basis, the agency noted that it could play a stronger role such as helping to identify suitable locations for freight and educating communities on freight best practices. Mn/DOT is now conducting research on design standards that can accommodate freight; the agency believed that this type of research could support other state DOTs in taking a more proactive role to advocate for freight in local communities.
- Be proactive and receptive. PSRC and WSDOT have been proactive in looking for opportunities to improve data and coordination. While the agencies believe there are areas for improvement, both peers noted that being proactive and receptive can help improve the quality of data as well as the relationship with the State DOT.
- Work with all stakeholders. DVRPC works closely with PennDOT, NJDOT, and DelDOT on efforts and they are all supportive of freight. While DVRPC does not cover Delaware, its collaboration with DelDOT is mutually seen as a beneficial relationship, and both agencies see the relationship as valuable. For example, NJDOT funded and conducted a technical study looking at freight in South Jersey (with Cambridge Systematics as consultant support). NJDOT submitted a marine highway project that DVRPC supported.
- Coordinate early and often; ensure trust among all parties. By coordinating early and often with its freight advisory executive committee, DVRPC has been able to set meeting dates a year in advance and create an environment where people take the committee seriously. Trust is also key; collaboration will not succeed if parties do not trust each other.
- Consider both informal and formal structures for communication among agencies. Most of the peers attending the exchange reported that they did not have a formal communication approach or structure for freight issues. The frequency of MPO/State DOT meetings depends on personalities, the project, and agencies' schedules. WSDOT suggested that it can be useful to compare scheduling milestones to ensure that all agencies are on the same page.
- Be proactive. Both WSDOT and PSRC emphasized the importance of proactively reaching out to private sector stakeholders. Good questions to ask include what their requirements are for an effective freight system and what currently works well. Because a similar group of individuals typically attends meetings, proactive and targeted outreach can also help ensure that agencies are hearing new and different voices.
- Ensure a breadth of representation in deciding whom to target in outreach activities. For example, WSDOT reported that it identified companies that had the most number of employees within different industry groups. PSRC identified companies that it believed could represent a unified voice from a given industry group. Additionally, PSRC noted that it received very different "stories" on freight from each stakeholder it talked to. Talking to diverse stakeholders helped ensure a more comprehensive story.
- Be strategic about meeting times and length. Peers reported a variety of meeting times, but all noted the importance of being strategic depending on the needs of the participants. PSRC's freight committee meets at 7:30 AM on Fridays to allow participants to leave for work immediately afterward. DVRPC's and MORPC's committees meet during lunch.4 The Columbus logistics council meets at 8:00 AM. MORPC recommended keeping meetings to one hour, since some companies began attending the logistic council's meetings once they were pared down from two hours to one.
- When working with local planning processes, State DOTs and MPOs
can play a variety of roles.
- Mn/DOT reported that it generally plays the role of a freight advocate and consultant, although the specific role can change depending on the circumstance. Mn/DOT also provides assistance for districts on freight issues. For example, Mn/DOT reviews the freight components of local comprehensive plans when shared by districts and assists as needed to strengthen these components.
- DVRPC plays various roles, including as a problem-solver while participating in a county study to identify alternatives for redirecting an active trolley line in an environmental justice community. DVRPC has also acted as a resource to assist locals with map development, meeting support, and data collection. Finally, DVRPC reported that it "plays a major facilitation role" in its region by setting up meeting for member governments and cities to discuss specific issues, meeting with rail and port industries, and facilitating discussions to improve freight operations.
- WSDOT noted that it primarily acts to share freight expertise with regions.
- MORPC serves as the "regional information clearinghouse" and advocate for good freight planning. MORPC also noted that an MPO's freight office can play a "business affairs" role since there are many intersections between freight and economic development activities.
- PSRC plays a coordination role in inviting freight and state legislative staff to participate in bi-monthly freight roundtable meetings. PSRC also supports data analysis, particularly by combining state and regional data analyses to help present issues in new, creative ways.
- It can be valuable to include the general public in freight discussions. WSDOT reported that it has had success with MPO-level committees since the general public can attend. MORPC noted that some of its most valuable discussion comes from RICC meetings since they involve public discussion and collaboration.
- Be specific about committee roles. Many peers suggested that it is important to be specific about committee roles. For example, MORPC noted that it gathered a group of stakeholders to provide input for an evacuation plan study. MORPC emphasized that the stakeholders would have an advisory, rather than voting, role, yet built credibility by seriously considering their input.
4.4 – Roles and Methods of Engagement with the Private Sector and Other Stakeholders.
The fourth topic focused on integration of freight with local planning processes, including best practices for engaging cities and counties in freight planning, how these jurisdictions can help MPOs and State DOTs identify and address land use-related freight issues, and the extent to which MPOs and State DOTs need to understand local planning processes.
Approaches to Communication/Collaboration
- Encourage local communities to look outside their regions. Mn/DOT noted that it has developed a statewide list of intermodal facilities and freight facilities. When working with local communities, Mn/DOT shares this information with them and encourages them to map similar facilities outside their boundaries; this help local communities gain understanding of larger regional freight issues and allows them to help the State DOT advance freight in specific corridors.
- Be creative in conducting outreach to local jurisdictions.
- DVRPC provided additional detail its county freight scan brochures, which were very successful. These brochures aimed to provide information on freight, promote freight as "a good neighbor," strengthen relationships with counties, and increase county stakeholders' understanding of freight operations within a particular county. They highlighted key freight facilities in each county and provided overviews of the main freight themes and issues affecting each county. The brochures also include freight facts for each county, such as freight rail miles and number of truck parking spaces, as well as information on unique products manufactured in the county (e.g., windmill components). Each scan took about one month to develop, starting with a kick-off meeting with relevant stakeholders. DVRPC emphasized the importance of being "out in the field" to gather the information necessary for the scans. For example, county teams working on the brochures were invited to visit freight facilities to better understand their needs and operations.
- DVRPC developed a series of brochures on freight project implementation tools targeted to municipal officials. Along with these documents, DVRPC created a "ten-step" document outlining the freight planning process.
- MORPC has continued freight scanning tours where transportation committee members have opportunities to talk to freight operators.
- Promote compatible land uses when possible. Met Council described a situation where public advocates suggest converting infrequently used rail lines to bicycle or pedestrian paths. This situation can be challenging because land use decisions are not typically within an MPO's realm. To address this issue, PSRC suggested promoting compatible land uses when possible and working closely with land use decision-makers.
- Preserve and protect freight centers. PSRC reported that it includes freight centers and designated manufacturing industrial centers in its long-range transportation plan, an effort accomplished collaboratively with the cities.
- Location of trucking centers is not static. One current challenge facing the Twin Cities area is that trucking centers are moving to the peripheries or out of the region. Many of the peers reported that this trend is also occurring in their regions.
- Consider strategies the State DOT can take to support essential freight facilities. While land use control typically resides with cities and counties, state DOTs can advocate for use of best practices, good urban design, establishment of buffers, and identification of suitable alternatives where freight activities are being relocated.
[ Return to table of contents. ]
Section 5: Current Trends in Freight Planning Processes and Institutional Arrangements
National studies on freight planning policy and processes have focused on a number of relevant freight transportation issues and trends germane to the Twin Cities Metropolitan Area (TCMA) Regional Freight Initiative. For example, studies have assessed the effect of public policies on the freight system, surfaced best practices for developing effective public sector freight institutional arrangements, and identified opportunities to improve public decision- and policy-making, as well as public-private sector communications.
These trends reinforce the insights of the peer exchange and help suggest additional ideas and topics for Mn/DOT and Met Council to consider or pursue.
Institutional Arrangements
Current recommendations focus on the importance of collaborative partnerships in strengthening freight projects, as well as on the need for trust and clear understanding by all parties about the purpose of the arrangement. Many related topics, such as the importance of trust and collaboration in establishing successful freight institutional arrangements, were discussed during the peer exchange. The peer exchange also demonstrated that there are many ways to collaborate successfully; one model does not fit all.
Current thinking suggests that Mn/DOT and Met Council (and others) should identify success factors for collaboration by exploring: 1) mechanisms to document relationships, such as through memoranda of understanding; 2) issues that are of mutual concern to both agencies that collaboration can help to address; 3) different types of arrangements that have been effective in other areas or regions; and 4) activities to communicate the purpose of arrangements to all parties, such as through regular meetings.
Outlined below are details on several studies that discuss trends on institutional arrangements.
- Institutional arrangements serve many purposes, but their objectives must be clear to determine whether they are successful. Most current freight institutional arrangements are focused on planning functionalities, although they serve a variety of purposes, such as addressing freight through long-range planning, operating a freight facility, or sharing information and research among freight partners. Objectives for these arrangements should be clear to determine appropriate guidelines and measures for success. For example, arrangements focusing on increasing freight visibility should rely on building Federal, state, and local support, while arrangements focused on project selection might find it more important to obtain buy-in from the private sector. (National Cooperative Freight Research Program (NCFRP) Report 2: Institutional Arrangements for Freight Transportation Systems– 2009).
- Freight projects can benefit significantly from collaborative partnerships. Collaboration can support freight projects particularly because these projects are often very complex and expensive. True collaboration involves a high amount of interaction and trust among stakeholders. Involving stakeholders early in a project's lifespan helps ensure success. (National Cooperative Highway Research Program (NCHRP) Project 08-36: The Role of Collaboration in Freight Transportation Management: Guidance to Foster Collaborative, Multi-modal Decision Making: The Case for Freight – 2006).
Freight Planning, Policy, and Decision-Making
Current recommendations in this topic focus on the need to share information about freight impacts for specific policy areas (and the particular role of state DOTs in this activity), as well as on how agencies can more successfully integrate freight into transportation planning and improve public-private sector communications. Several of these issues were reflected in many of the peer exchange discussions, underscoring the importance of the event in addressing questions of national significance. For example, DVRPC provided details on its effort to develop a freight component of the TIP to identify and call attention to freight projects. Several peers discussed successful mechanisms to reach out to the private sector, including a mailing list and developing freight fact sheets. Peers also emphasized the importance of having reliable freight data to develop performance measures and make the case for freight -a point also noted in several studies.
Current thinking suggests that it is important for Minnesota DOT, and perhaps Met Council, to explore a role in sharing information on freight impacts to inform public policy, improve decisions that affect freight, and generally raise awareness of freight issues. Information could be shared with other state government agencies. However, only certain policy areas might be conducive for these activities.
Outlined below are details on specific studies that explore trends on freight planning, policy, and decision-making.
- Challenges exist in integrating freight into transportation planning, but there are ways to more effectively incorporate freight into needs identification, projection evaluation, and programming. Freight needs are currently identified through a number of mechanisms, including the private sector and local implementing agencies (e.g., public works departments), but challenges exist that make identifying and programming these needs difficult. Within each phase of transportation planning, there are key factors that can help lead freight projects from needs identification to implementation. For example, needs identification can benefit from developing a freight point of contact and conducting a freight profile or study. Developing freight performance measures necessitates data collection and analysis. Project implementation can benefit from clarifying roles and responsibilities (e.g., through a memorandum of understanding). Criteria for success can also help assess progress. (NCHRP Project 08-53: Integrating Freight in Transportation Planning and Project-Selection Processes – 2007).
- While the public and private sector make freight decisions differently, there are many opportunities for improving collaboration. The public and private sectors are motivated by different factors when making freight decisions. However, there are many areas, such as safety and security issues, where public and private interests are already aligned and can be strengthened to benefit freight transportation. To improve public-private sector coordination, parties can consider developing benchmarks to measure progress, developing mutually beneficial project milestones, and creating financial partnerships to share both costs and benefits. (NCFRP Report 01: Public and Private Sector Interdependence in Freight Transportation – 2009).
- Some policy areas can benefit from additional information on freight impacts; State DOTs can facilitate information-sharing on these areas. Public policies, including those not specific to transportation (e.g., land use) have intended and unintended effects on the freight system. Many policies are now made with a comprehensive understanding of impacts or without concern for freight. However, a few policy areas including truck speed limits, road pricing for trucks, and investment and finance decisions for inland waterways, would benefit from better information on freight impacts. State DOTs can play an important role in sharing information to highlight potential policy impacts on freight. (NCFRP Report 6: Impacts of Public Policy on the Freight Transportation System – 2010).
[ Return to table of contents. ]
Section 6: Conclusion
The peer exchange provided an opportunity for Mn/DOT, Met Council and participating peers to share information on and learn about key freight issues, challenges, and best practices from leading freight programs around the country. As a result of the peer exchange, the host agencies obtained insights to inform, shape, and refine freight planning in the Twin Cities, which will also inform the TCMA Regional Freight Initiative. Finally, Mn/DOT and Met Council identified several areas of exploration to focus their next steps.
Key areas of insight for lessons learned, which have been outlined in earlier sections of this report, included:
- Methods to incorporate freight in existing planning processes.
- Techniques for making freight projects more visible, particularly through coordination and outreach efforts.
- Best practices for involving local community stakeholders in freight discussions.
- Considerations for collecting freight data and using data to support development of freight performance measures, as well as freight planning and programming processes.
Areas of exploration to obtain additional information and/or focus next steps included:
Freight Planning, Policy, and Decision-Making
- Continuing to learn about how to identify and define a "freight project."
- Identifying additional mechanisms to increase visibility of freight projects.
- Continuing to learn more about mechanisms to institutionalize freight, such as by incorporating freight into a regional highway or rail plan or developing priority freight corridors to consider as part of the interregional trade corridor system.
- Learning about when transportation enhancement (TE) funds can support freight projects.
- Methods to support multi-jurisdictional management of freight issues.
Data/Performance Measures
- Continuing to learn how to measure freight benefits, including developing freight performance measures (especially on a regional level) or cost-benefit analyses (that are scalable to different projects).
- Learning more about regional truck movements, perhaps by conducting a travel time analysis.
- Assessing freight data at the national level.
- Considering how Federal agencies could support obtaining national and international data on economic competitiveness as a way to identify additional opportunities for freight activity/best practices.
Collaboration/Outreach
- Conducting outreach and coordination efforts to heighten interest in freight and learning more about specific peer efforts, including DVRPC's county freight scans and PSRC's FAST partnership.
- Identifying appropriate stakeholders for freight and encouraging more engagement with new audiences or inactive stakeholders to obtain quality feedback. Specific stakeholders mentioned included the Wisconsin DOT, the Met Council Transportation Advisory Board, and new public sector agencies.
- Assessing the local community's interest in freight issues and encouraging cities and counties to consider freight in their local comprehensive plans.
Data/Performance Measures
- Identifying ways to better quantify the benefits of freight projects, including through development of performance measures and cost-benefit analyses.
- Updating data, particularly as related to trucks, to provide a stronger basis for performance measures.
- Learning more about the travel time speed analysis conducted by WSDOT.
Overall, the event was successful in reaching its objectives. At the conclusion of the event, many participants commented that the exchange was well-organized and informative. The peer exchange led many participants from the host agency to believe that, far from being an outlier, the Twin Cities region is addressing similar types of issues, needs, and challenges as are a number of freight peers around the country.
For additional information on this FHWA Freight Peer Exchange please contact:
Matthew Pahs
Multimodal Transportation Planner
Freight/Rail/Waterways
Minnesota Department of Transportation
395 John Ireland Blvd
St. Paul, MN 55155
matthew.pahs@state.mn.us
651.366.3694
[ Return to table of contents. ]
Appendix A: Offices Participating
Agency
Minnesota Department of Transportation Central Office: http://www.dot.state.mn.us/ofrw/freight.html
Minnesota Department of Transportation Metro District: http://www.dot.state.mn.us/metro/
Metropolitan Council: http://www.metrocouncil.org/transit/index.htm
Federal Highway Administration Minnesota Division (participant): https://www.fhwa.dot.gov/mndiv/
Federal Highway Administration Office of Freight Management and Operations (resource): http://ops.fhwa.dot.gov/freight/
Delaware Valley Regional Planning Commission: http://www.dvrpc.org/
Mid Ohio Regional Planning Commission: http://www.morpc.org/transportation/freight/freight.asp
Puget Sound Regional Commission: http://psrc.org/transportation/freight
Washington State Department of Transportation: http://www.wsdot.wa.gov/freight/
Volpe Center: http://www.volpe.dot.gov/
[ Return to table of contents. ]
Appendix B: Peer Exchange Process and Format.
The peer exchange was composed of brief presentations from the host agencies and each of the peers, followed by in-depth roundtable discussions on key freight topics.
Prior to the presentations, from Mn/DOT and Met Council introduced the peer exchange, welcomed all participants, and provided background on the need for the event. Next, participants engaged in detailed roundtable discussions focused on four topics: 1) freight planning state of the practice; 2) strategic approaches to developing freight projects; 3) integration of freight into local planning processes; and 4) roles and methods of engagement with the private sector and other stakeholders.
Before the peer exchange, USDOT's Volpe Center assisted Mn/DOT and Met Council to develop a list of potential topic areas and associated questions to guide the roundtable discussions. The topic and questions list was shared with the selected peers for review and feedback. Peers' input helped to narrow the list of potential topics to identify four areas of priority interest to Mn/DOT and Met Council and to refine the associated guiding questions for discussion. The four topics and associated guiding questions are included in the agenda provided in Appendix C. The agenda includes questions posed to peers during the peer exchange, which were not included as part of the set of pre-identified guiding questions, are included.
Peers were identified by Mn/DOT and Met Council staff with the assistance of the Volpe project team and FHWA Office of Freight Management and Operations. The Volpe team first reviewed Freight Analysis Framework (FAF) data for several metropolitan regions that could be represented by MPO and or state agency candidates to identify those with freight characteristics (e.g., freight commodity types, inbound/outbound freight flows) similar to the Twin Cities region. See Appendix D for the results of the data analysis. From this review, the Volpe team identified nine agencies as likely peer candidates. Finally, Volpe project team staff conducted brief (15-20 minute) phone conversations with freight contacts at each of the nine agencies. The purpose of these conversations was to validate the peers' likely contribution to the Regional Freight Initiative and to an institutionally-focused freight peer exchange as part of that project. From these conversations, the Volpe team identified contacts from DVRPC, PSRC, MORPC, and WSDOT to invite to the peer exchange. The FHWA Office of Freight Management and Operations extended the invitation to the peers.
[ Return to table of contents. ]
Appendix C: Peer Exchange Agenda and Questions.
FHWA-sponsored Freight Peer Exchange Agenda
Purpose:
Identify effective practices for freight system planning and improvement to apply in metro Twin Cities region
8:00-8:30 – Welcome and Coffee
8:30-9:00 – Background on Need for Peer Exchange/Q&A
- Mn/DOT
- Met Council
9:00-10:00 – Peer Agencies' Overview Presentations/Q&A
- Delaware Valley Regional Planning Commission (Philadelphia, Pa./Camden, Nj.)
- Mid Ohio Regional Planning Commission (MORPC-Columbus Oh.)
- Puget Sound regional Commission (Seattle, Wa.)
- Washington State DOT
10:00-10:15 – Break
Format for topic sessions:
- Confirm focus of session – see "potential questions" list (2 – 5 minutes);
- Outline by peers/hosts of recent examples (3 minutes/org, 25 minutes total);
- Have Q&A, discussion, summary of lessons learned (25 minutes); and
- Identify useful information resources on topic (5 minutes)
10:15-11:45 -Topic A: State of the Freight Planning Practice
11:45-12:45 – Lunch
12:45- 1:45 – Topic B: Strategic Approach to Developing Freight Projects
1:45-2:45 – Topic C: Roles and Methods of Engagement
2:45-3:00 – Break
3:00-4:00 – Topic D: Integration into Local Planning Processes
4:00-4:30 – Wrap-Up/Conclusions
4:30 – Adjourn
Peer Overview Presentations
Questions Generated During Peer Exchange
1) How did the TCMA Regional Freight Initiative originate?
2) What are Met Council's criteria for determining and designating regionally significant freight corridors?
3) Have Met Council and Mn/DOT worked together in the past?
4) How does Met Council define benefits for freight in the metropolitan region?
5) How did DVRPC's freight advisory committee play a part in moving freight projects forward?
6) Does DVRPC formally involve the freight advisory committee in funding decisions?
7) How did MORPC quantify loss of jobs to congestion?
8) Did PSRC conduct an environmental review process for developing the freight strategy that is part of the long-range plan?
9) How does Washington State define bottlenecks?
Topic A: State of the Freight Planning Practice
Questions Generated Prior to Peer Exchange
1) What approaches or techniques have you found most useful in building strong collaborative relations between the MPO and state DOT around freight? What's the next step for you?
2) When have the MPO and state DOT found it good to work together? Around specific facilities or locations in a metropolitan region? Around data needs? Have the two organizations worked together on a strategic freight initiative? What lessons have you learned?
3) What is leading edge for you in terms of performance measures in the freight arena? Where are there common interests between the MPO and state DOT?
4) With respect to various freight modes/users (e.g., highways, rail, air, water, pipeline, intermodal) how similar or different are your approaches? Why? What works best and what doesn't? Where/when does it make sense to plan for the entire freight system (i.e., all modes together)?
5) What lessons have you learned in developing freight mode-specific plans (for capital investment, operational changes, and policies/regulations)? When and how do the MPO and state DOT coordinate their planning?
Questions Generated During Peer Exchange
6) When you do regional/statewide freight studies, do you always collaborate and involve relevant MPOs or is this done on an ad hoc basis? How often to you get together to talk about freight?
7) What are examples of criteria for determining and designating regionally significant freight corridors?
8) How can you define benefits for freight in a metropolitan region?
9) How has WSDOT determined priority interregional connectors? Have these been integrated into a freight network designation?
10) How did WSDOT obtain data for its truck traffic methodology? How did WSDOT manage to obtain data from trucking firms?
11) Are there sufficient trucks captured in Minnesota's data sources to monitor performance?
12) Does anyone do data analysis on how the congestion on the freight system affects prices of commuter goods?
13) How can other modes, such as bicycles, be addressed to benefit the freight agenda?
14) What are successful approaches for collecting data on rural areas?
Questions on Topic B: Strategic Approach to Developing Freight Projects
Questions Generated Prior to Peer Exchange
1) How do you define a "freight project?"
2) What have you found most productive to identify and develop freight projects?
3) How do you develop and apply criteria when selecting among possible freight projects? What issues tend to arise?
4) What are the key factors in getting a freight project implemented/delivered? What have you found most effective in addressing these factors?
5) How do you go about identifying resources for freight projects? How does this differ from the state level to the metropolitan area? How are they connected?
6) How and when do you making the case for implementing a freight project, once selected? How do your approaches vary by types of audiences/stakeholders (e.g., public sector, private sector, general public)?
7) Have you quantified or otherwise made explicit the benefits and beneficiaries of freight projects?
Questions Generated During Peer Exchange
8) How do you deal with programming freight projects?
9) Have you considered identifying a dedicated freight fund at the state or local level?
10) Do you do project development work related to preparation for Transportation Investment Generating Economic Recovery (TIGER) projects?
11) Have you determined data on urban movements and intra-region movements, including causes, origins, and destinations?
12) How have you controlled control freight traffic and its causes? How have you quantified costs of curfews versus the cost of capacity expansion?
13) Where are you with regard to freight performance issues? Do you use this information to make investment decisions?
14) Have you developed a freight working group at the state level?
Questions on Topic C: Roles and Methods of Engagement
Questions Generated Prior to Peer Exchange
1) How do roles in improving freight mobility vary from your MPO to the state DOT? How are they complementary? What are the implications of different roles?
2) What are the public sector's best roles in interacting with private sector freight stakeholders, who own most freight infrastructure?
3) What approaches have you found most useful in engaging private sector stakeholders?
4) What's been most effective in integrating private sector information in your freight planning?
Questions Generated During Peer Exchange
5) How do you collaborate and involve relevant stakeholders when conducting regional/state freight planning studies?
6) How do you plan for intermodal connectors?
7) What is the role of WSDOT on the Interstate 5 corridor bridge to Portland?
8) Have you created forums in Philadelphia to get a pulse on freight issues at the MPO level?
9) To what extent has the public sector been involved in freight planning and what is the nature of their engagement (proactive, reactive, etc.)?
10) Is it more beneficial to have a freight committee at the MPO level, statewide level, or both?
11) How do you decide what stakeholders to talk to? How do you communicate with them? Using what types of methods?
12) What roles do you see as important for the state DOT and MPO in freight planning?
13) Have you found yourself in situations where you have competing interests with local communities?
14) How do you educate people on the value of a railroad line, even one that is infrequently used?
15) Has anyone worked with local jurisdictions to preserve and protect freight centers? Do you know how many trucks move through these centers?
Questions on Topic D: Integration of Freight into Local Planning Processes
Questions Generated Prior to Peer Exchange
1) What's worked best for you to engage cities and counties in freight planning? Which issues tend to be most important for these jurisdictions? What does an MPO or state DOT offer them?
2) How can cities and counties best help MPOs and state DOTs identify and address land use-related freight issues? What have been the most effective ways to work with cities and counties in terms of citing of warehousing/industrial facilities?
3) To what extent do MPOs and state DOTs need to understand local planning processes in order to address larger freight issues?
Questions Generated During Peer Exchange
4) Are you facing issues with truck centers moving outside the region?
5) Can we help elevate essential freight facilities? What is the state DOT's role to support this, knowing that control for land use typically lies with cities and counties? What is the MPO's role?
6) What can the State DOT do to protect encroachment on freight facilities and promote freight optimization?
7) What can the State DOT and MPO do to unify the truck network?
[ Return to table of contents. ]
Appendix D: Preliminary Freight Analysis Framework Data Comparisons between Metropolitan Census Regions.
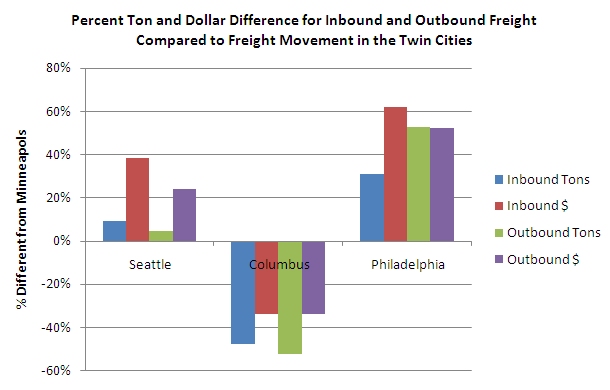
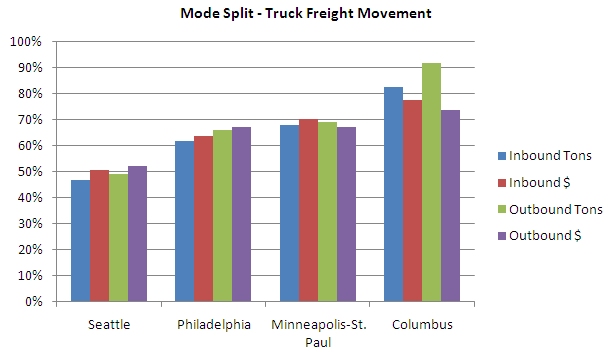
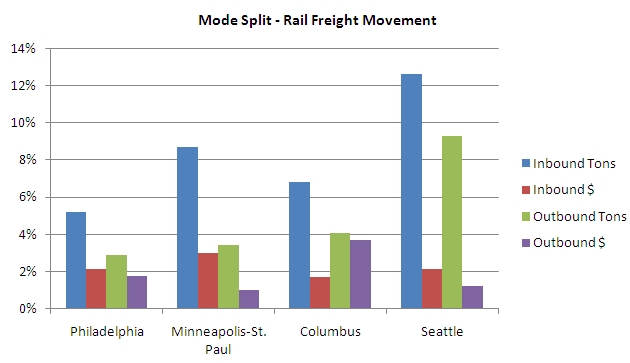
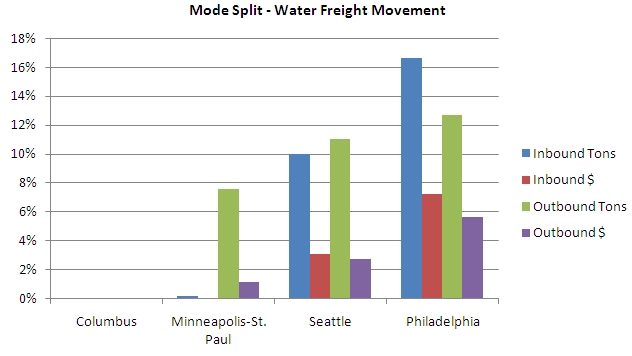
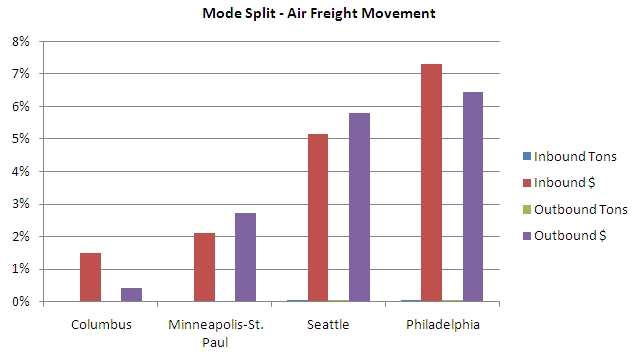
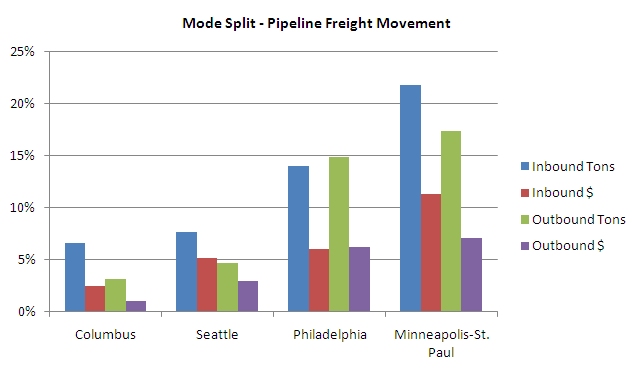
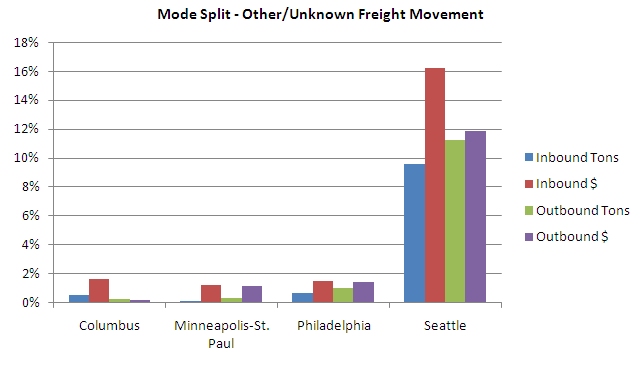
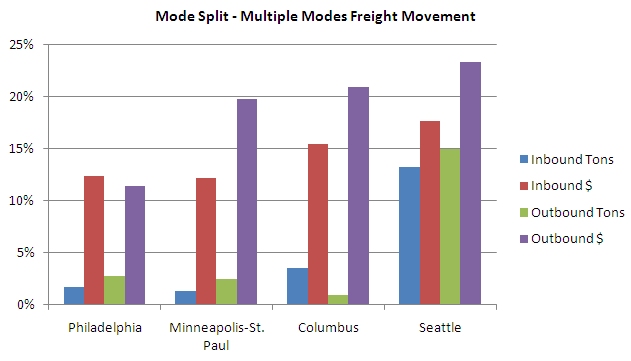
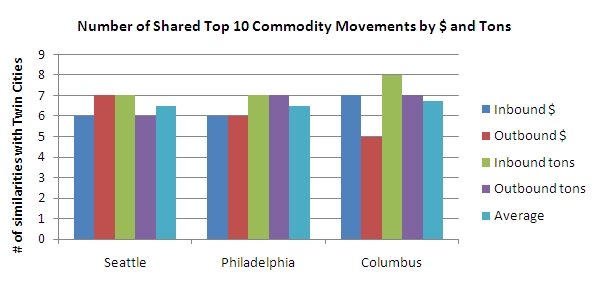
| Commodity | Twin Cities | Columbus | Philadelphia | Seattle | ||||
|---|---|---|---|---|---|---|---|---|
| % | Rank | % | Rank | % | Rank | % | Rank | |
| Machinery | 10% | 1 | 8% | 6 | 9% | 1 | 12% | 2 |
| Precision instruments | 8% | 2 | ||||||
| Electronics | 8% | 3 | 7% | 7 | 5% | 6 | 8% | 3 |
| Mixed freight | 7% | 4 | 9% | 4 | 7% | 2 | 5% | 6 |
| Misc. mfg. prods. | 6% | 5 | 5% | 5 | 4% | 7 | ||
| Gasoline | 6% | 6 | 5% | 10 | 3% | 10 | ||
| Coal-n.e.c. | 5% | 7 | 5% | 7 | ||||
| Articles-base metal | 4% | 8 | 3% | 8 | 3% | 9 | ||
| Motorized vehicles | 4% | 9 | 12% | 3 | 7% | 5 | ||
| Milled grain prods. | 3% | 10 | ||||||
| Textiles/leather | 13% | 1 | 5% | 9 | 7% | 4 | ||
| Pharmaceuticals | 13% | 2 | 7% | 3 | 4% | 8 | ||
| Plastics/rubber | 2% | 10 | ||||||
| Base metals | ||||||||
| Chemical prods. | 8% | 5 | ||||||
| Fuel oils | 5% | 8 | ||||||
| Furniture | ||||||||
| Live animals/fish | ||||||||
| Meat/seafood | ||||||||
| Other foodstuffs | 2% | 9 | ||||||
| Printed prods. | ||||||||
| Tobacco prods. | ||||||||
| Transport equip. | 13% | 1 | ||||||
| Common in Top 10 | 5 | 7 | 7 | |||||
| Commodity | Twin Cities | Columbus | Philadelphia | Seattle | ||||
|---|---|---|---|---|---|---|---|---|
| % | Rank | % | Rank | % | Rank | % | Rank | |
| Machinery | 10% | 1 | 9% | 3 | 9% | 1 | 10% | 2 |
| Mixed freight | 8% | 2 | 6% | 6 | 6% | 5 | 5% | 4 |
| Electronics | 7% | 3 | 9% | 2 | 7% | 4 | 7% | 3 |
| Motorized vehicles | 6% | 4 | 9% | 4 | 4% | 8 | 4% | 5 |
| Gasoline | 6% | 5 | 3% | 10 | ||||
| Coal-n.e.c. | 5% | 6 | 5% | 6 | ||||
| Misc. mfg. prods. | 4% | 7 | 4% | 7 | 3% | 9 | ||
| Crude petroleum | 4% | 8 | 8% | 3 | ||||
| Articles-base metal | 4% | 9 | 4% | 10 | ||||
| Plastics/rubber | 3% | 10 | 4% | 8 | ||||
| Pharmaceuticals | 10% | 1 | 9% | 1 | 4% | 9 | ||
| Textiles/leather | 7% | 5 | 5% | 7 | 4% | 6 | ||
| Other foodstuffs | 4% | 9 | 3% | 10 | ||||
| Chemical prods. | ||||||||
| Fuel oils | 3% | 10 | ||||||
| Precision instruments | 4% | 9 | ||||||
| Transport equip. | 18% | |||||||
| Common in Top 10 | 7 | 6 | 6 | |||||
| Commodity | Twin Cities | Columbus | Philadelphia | Seattle | ||||
|---|---|---|---|---|---|---|---|---|
| % | Rank | % | Rank | % | Rank | % | Rank | |
| Coal-n.e.c. | 14% | 1 | 3% | 10 | 11% | 3 | 4% | 6 |
| Cereal grains | 12% | 2 | 8% | 4 | ||||
| Gasoline | 10% | 3 | 4% | 6 | 10% | 4 | 6% | 5 |
| Gravel | 10% | 4 | 13% | 2 | 9% | 5 | 25% | 1 |
| Waste/scrap | 8% | 5 | 8% | 5 | 7% | 6 | 9% | 3 |
| Nonmetal min. prods. | 7% | 6 | 11% | 3 | 5% | 7 | 9% | 2 |
| Fuel oils | 4% | 7 | 12% | 2 | 4% | 7 | ||
| Other ag prods. | 4% | 8 | 8% | 3 | ||||
| Milled grain prods. | 3% | 9 | ||||||
| Other foodstuffs | 2% | 10 | 4% | 7 | 3% | 9 | ||
| Mixed freight | 4% | 8 | ||||||
| Base metals | 4% | 9 | ||||||
| Basic chemicals | 2% | 10 | ||||||
| Natural sands | 16% | 1 | ||||||
| Nonmetalic minerals | 4% | 8 | 3% | 8 | ||||
| Wood prods | 7% | 4 | ||||||
| Chemical Prods. | 3% | 9 | ||||||
| Crude petroleum | 14% | 1 | ||||||
| Logs | 3% | 10 | ||||||
| Pharmaceuticals. | ||||||||
| Plastics/rubber. | ||||||||
| Printed products. | ||||||||
| Tobacco prods. | 7 | |||||||
| Common in Top 10 | 7 | 7 | 6 | |||||
| Commodity | Twin Cities | Columbus | Philadelphia | Seattle | ||||
|---|---|---|---|---|---|---|---|---|
| % | Rank | % | Rank | % | Rank | % | Rank | |
| Cereal grains | 15% | 1 | 7% | 4 | ||||
| Coal-n.e.c. | 11% | 2 | 6% | 6 | 10% | 2 | 4% | 6 |
| Gravel | 9% | 3 | 13% | 2 | 9% | 4 | 25% | 1 |
| Gasoline | 9% | 4 | 4% | 7 | 5% | 6 | 6% | 5 |
| Crude petroleum | 8% | 5 | 18% | 1 | 3% | 9 | ||
| Nonmetal min. prods. | 7% | 6 | 11% | 3 | 5% | 7 | 9% | 2 |
| Waste/scrap | 7% | 7 | 7% | 5 | 10% | 3 | 9% | 3 |
| Coal | 4% | 8 | 4% | 8 | ||||
| Fuel oils | 3% | 9 | 3% | 10 | 8% | 5 | 4% | 7 |
| Base metals | 2% | 10 | ||||||
| Other foodstuffs | 4% | 9 | 3% | 9 | ||||
| Wood prods. | 7% | 4 | ||||||
| Basic chemicals | ||||||||
| Natural sands | 13% | 1 | 2% | 10% | ||||
| Nonmetalic minerals | 4% | 8 | 3% | 8 | ||||
| Logs | 3% | 10 | ||||||
| Mixed freight. | ||||||||
| Common in Top 10 | 8 | 7 | 8 | |||||
[ Return to table of contents. ]
Appendix E: Additional Peer Materials For Reference.
DVRPC
Freight planning website: http://www.dvrpc.org/Freight
DVRPC relevant documents
Long-Range Vision for Freight: http://www.dvrpc.org/reports/09058.pdf
DVRPC county freight scans: http://www.dvrpc.org/freight/countyfreightscans
DVRPC 2010 Work Program Detail: http://www.dvrpc.org/asp/workprogram10
National Highway System Connectors to Freight Facilities in the Delaware Valley Region (http://www.dvrpc.org/asp/pubs/publicationabstract.asp?pub_id=07024)
Delaware County Highway-Railroad Grade Crossing Study (http://www.dvrpc.org/reports/06007.pdf)
Truck and Bus Travel in the Delaware Valley Region (http://www.dvrpc.org/reports/05005.pdf)
Municipal Implementation Tool on Freight (http://www.dvrpc.org/reports/MIT019.pdf)
Freight Transportation affects every aspect of the Philadelphia metropolitan area and its 353 municipalities. Planning for freight transportation has recently become recognized as highly important for economic development and job creation. This MIT brochure provides local government with the tools and resources to conduct local freight planning. Some topics include: land use in industrial areas and around freight facilities, managing truck routing and parking, and alleviating air quality and safety concerns. Strategies for these topics are identified and programs in which a municipality may participate are acknowledged.
Food System Study (http://www.dvrpc.org/reports/MIT018.pdf)
Food system planning is the integration of food system issues into policies, plans, and programming at all levels of government. It has recently become a recognized expertise within the planning profession. This MIT brochure provides local government with the tools and resources to conduct local food system planning. Five common activities to food system planning include: a) inform decision-making by compiling data; b) encourage sustainable food production through plans, policies, and programming; c) improve healthy food access through zoning, education, and incentives for retail operators; d) support a local or regional food economy; and e) reduce or reuse food waste. Innovative examples of municipalities from Greater Philadelphia and throughout the country are identified.
Freight Flows and Forecasts (http://www.dvrpc.org/reports/09064.pdf)
This study disaggregated a national level database of origin- and destination-based commodity flows down to the level of the Philadelphia CSA. Data is available based on origin, destination, mode, and commodity. Commodity flow data is an important tool for DVRPC in its freight planning efforts, as well as a tool for other DVRPC studies. All data is based in year 2002 and forecasted through the year 2035. This project was conceived of and supported by DVRPC's freight advisory committee, The Delaware Valley Goods Movement Task Force. The raw data that supports this report is available upon request.
MORPC
Freight planning website: http://www.morpc.org/transportation/freight/freight.asp
MORPC relevant documents
MORPC CapitalWays (Regional Transportation Plan: 2008-2030): http://www.morpc.org/pdf/CapitalWays%20Trans%20Plan%20May%202008%20online.pdf
Regional Connections: A Collaborative Vision for Central Ohio's Future: http://www.morpc.org/pdf/ExecutiveSummary.pdf
Columbus Ports of Entry Map: http://www.morpc.org/pdf/PortLimits.pdf
PSRC
Freight planning website: http://www.psrc.org/transportation/freight
PSRC relevant documents
Transportation 2040: Towards a Sustainable Transportation System: http://www.psrc.org/assets/4847/348Transportation2040final.pdf
PSRC Regional Freight Strategy (Appendix J of Transportation 2040): http://www.psrc.org/assets/4886/Appendix_J_-_Freight_Strategy_-_FINAL_-_August_2010.pdf
FAST Corridor Partnership: http://psrc.org/transportation/freight/fast
Freight Data Analysis: http://psrc.org/transportation/freight/freight-analysis/
WSDOT
Freight planning website: http://www.wsdot.wa.gov/freight/
WSDOT relevant documents
Washington State Freight Strategy: http://www.wsdot.wa.gov/NR/rdonlyres/96911C3E-CD14-4706-8528-4143C23D2F15/0/WSDOTFreightFolioweb.pdf
Washington Transportation Plan 2007-2026: http://www.wsdot.wa.gov/planning/wtp/
Washington Transportation Plan Update on Freight Report (September 2008): http://www.wsdot.wa.gov/NR/rdonlyres/67530525-3531-4552-A198-BA4255AADAA7/0/WTPSeptember_2008web.pdf
1 For additional information on the FHWA freight peer-to-peer program, see www.ops.fhwa.dot.gov/freight/fpd/p2p/index.htm. [ Return to note 1. ]
2 As part of its work to develop these plans, Mn/DOT conducted an inventory of freight needs across modes and conducted a regional freight and system analysis to identify constraints, issues, and recommendations. [ Return to note 2. ]
3 Current, the Port of Virginia is the only eastern U.S. port that can support larger post-Panamax ships. [ Return to note 3. ]
4 DVRPC also noted that its committee is relatively evenly composed of representatives from the public and private sectors and seems to attract more junior- than executive-level staff. [ Return to note 4. ]
 You will need the Adobe Acrobat Reader to view the PDFs on this page.
previous
You will need the Adobe Acrobat Reader to view the PDFs on this page.
previous