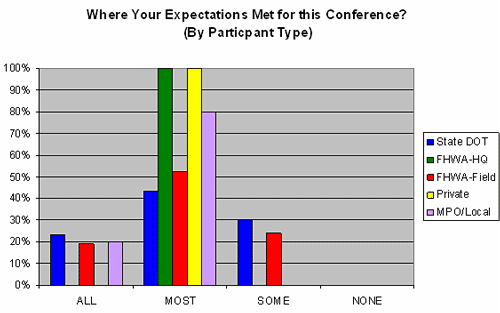
Description of Slide 3. Were Your Expectations Met for This Conference? (By Participant Type)

This graph shows participants' responses to the question "Were Your Expectations Met for This Conference?" as well as the types of participant. Those responding "all" included 22 percent from state DOTs, 20 percent from FHWA field offices, and 20 percent from MPO and local offices. Those responding "most" included 44 percent from state DOTs, 100 percent from FHWA headquarters, 51 percent from FHWA field offices, 100 percent from the private sector, and 80 percent from MPO and local offices. Those responding "some" included 30 percent from state DOTs and 25 percent from FHWA field offices. None responded "none."