
Slide 1:
Southern California Association of Governments

Slide 2:
Freight Transportation:
Emerging Issues for Southern California
Alan Bowser
Goods Movement PlanningWorkshop
•Detroit, Michigan
July 10-12, 2001

Slide 3:
The region

Slide 4:
2020 Forecast for Population & Employment Growth
- California’s future in the national and international economy greatly
depends on an effective multimodal transportation system
- By 2020, Southern California is projected to add both 7 million people and
4 million new jobs
- The distribution of both the projected population and employment growth will
be centered in the Inland Empire of Riverside and San Bernardino Counties and
Northern LA County

Slide 5:
Indeed, the region is one of the world’s largest exporters,
with $63.7 billion in goods. Export trade roughly brings an additional $21.2
billion in service exports, in banking, insurance tourism, and other services.
Southern California has become a favorite destination for domestic and international
tourism. An estimated 44.5 million tourists stayed in Southern California and
spend $22.3 billion. In Los Angeles County alone, tourism is ranked 3rd as an
industry. The
Southern California is defined as Imperial, Kern, Los Angeles, Orange, Riverside,
San Bernardino, San Diego, San Luis Obispo, Santa Barbara, and Ventura. Over
80 Percent of tourism occurs in Los Angeles, Orange, and San Diego counties.
Approximately, 6.4 million visitors are international tourists.

Slide 6:
“The RTP Balancing Act”
MOBILITY

Slide 7:
Goods Movement System
Purpose is to improve efficiency of all modes (truck, rail freight, marine shipping,
and air cargo) and all cargo types (domestic import/export, containerized, break-bulk
and bulk).
Slide 8:
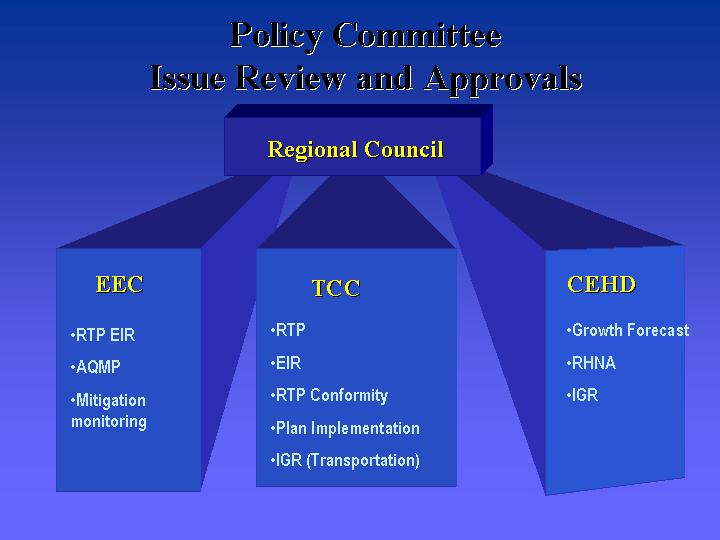
Policy Committee
Issue Review and Approvals

Slide 9:
RTP Task Forces. To plan for future growth in the region, the
Regional Council initiated various task forces, including Finance, Growth and
Aviation
Other Task Forces include Transit, goods movement, Truck Lanes, Maglev, and
the RTP Technical Advisory Committee to guide the RTP update process.
In May 1999, the TCC directed staff to work with the task force structure to
develop a comprehensive RTP update by April 2001. The region’s current
air quality conformity finding will lapse on June 9, 2001.
Transit Corridors, regional transit and Four Corners have completed their RTP
Work.
The rest will be completing their work shortly.

Slide 10:
SCAG Committee & Task Force Planning Process
Goods Movement Advisory Committee
Mission: “The Goods Movement Advisory Committee will advise the Regional
Council on the conditions prevailing in moving goods in Southern California;
on establishing appropriate transportation, infrastructure, air quality and
environmentally sound land use policies; and propose programs and priorities
to ensure the safe, efficient and economical movement of goods within the region
and its competitive advantage in international trade.

Slide 11:
SCAG Committee & Task Force Goods Movement Planning Process
GMAC (con’t)
... responsible for guiding SCAG in the development of an understanding of the
freight transportation issues and needs of the region, and will work interactively
with SCAG staff to fulfill its charge. The Committee will meet periodically
to review the progress of SCAG work, and may establish sub-committees at its
discretion to focus on particular concerns. It will seek to reflect the diverse
interests of the region, the public and private needs, and the goals of the
Regional Comprehensive Plan and Guide.”

Slide 12:
SCAG Committee & Task Force Goods Movement Planning Process
GMAC (con’t)
Membership Includes:
- Elected/Appointed Officials - Local Gov’t Staff
- Caltrans - Federal DOT Agencies
- Private Companies - railroads, truckers steamship lines, air cargo operations,
package express operators
- Representatives of Seaports, Airports, Environmental Groups, law enforcement
agencies, local neighborhood groups consultants

Slide 13:
SCAG Committee & Task Force Goods Movement Planning Process
GMAC (con’t)
OUTCOMES
Advocate Goods Movement System Efficiency:
Higher throughput, bottleneck elimination, greater reliability, reduced congestion
and environmental impacts & corresponding economic benefits - region, state,
nation.

Slide 14:
By 2020, 6.7 million more people are expected to reside in our
six county region. This is an increase of 43.2 percent.
Regional projections suggest that Asians and Latinos are the fastest growing
ethnic groups; since, Whites and African Americans will have small population
gains or losses. Between 1994 and 2000, Whites will have population loss of
41 thousand persons (-.6 %) and African Americans a small increase of 57 thousand
(4.8 %). Asians are anticipated to grow by 241 thousand and Latinos by 1.1 million,
which are 15.5 percent and 19 percent gains respectively.
All ethnic groups will have increases in absolute growth within their own group,
yet they will grow at different rates. Whites will gain 164 thousand persons,
African Americans 276 thousand, Asians 1.3 million , and Latinos 4.98 million.
This approximates to 2.4 percent growth for Whites, 23.4 percent for African
Americans, 84.8 percent for Asians, and 83.5 percent for Latinos. Ultimately,
the ethnic composition of the region will change. In 2020, Latinos will become
the largest ethnic group with 49 percent of the population, and Whites will
come second with 31.6 percent. From 1994 to 2020, the Asian’s proportion
of the population will gain slightly over 3 percent, and African American’s
slightly lose over one percent.

Slide 15:
County to County Travel
Slide 16:
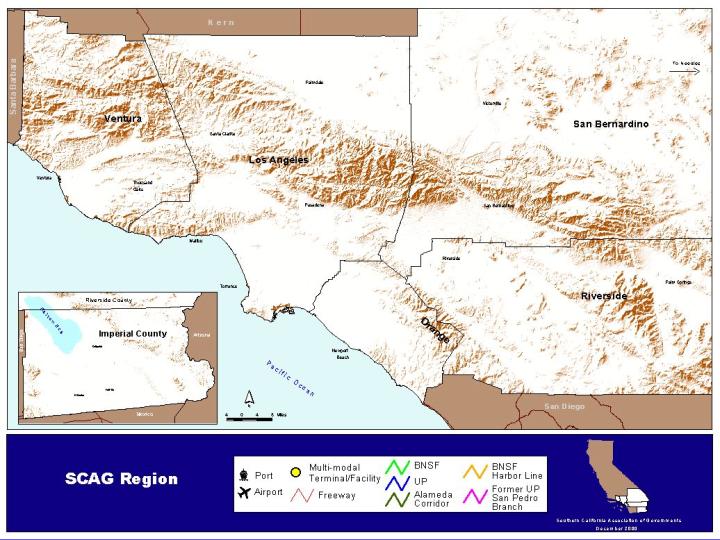
SCAG region
Slide 17:
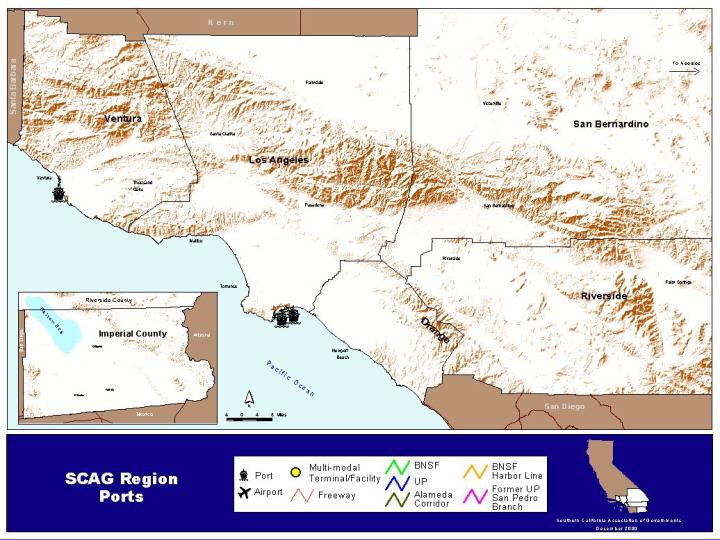
SCAG region ports

Slide 18:
SCAG region ports & airports

Slide 19:
SCAG region ports, airport & freight rail lines

Slide 20:
SCAG region ports, airports, freight rail lines & intermodal facilities

Slide 21:
SCAG region ports, airports, freight rail lines, intermodal facilities & freeways

Slide 22:
SCAG’s Travel Demand Model Improvment
Trip Generation Model
Trip Distribution Model
Mode Choice Model
New Traffic Analysis Zones
Other improvements

Slide 23:
New SCAG Taz's
Slide 24:
Heavy Duty Truck Model
• Developed and incorporated the Heavy Duty Truck Model into SCAG’s
new travel demand model.

Slide 25:
1995 daily truck volumes
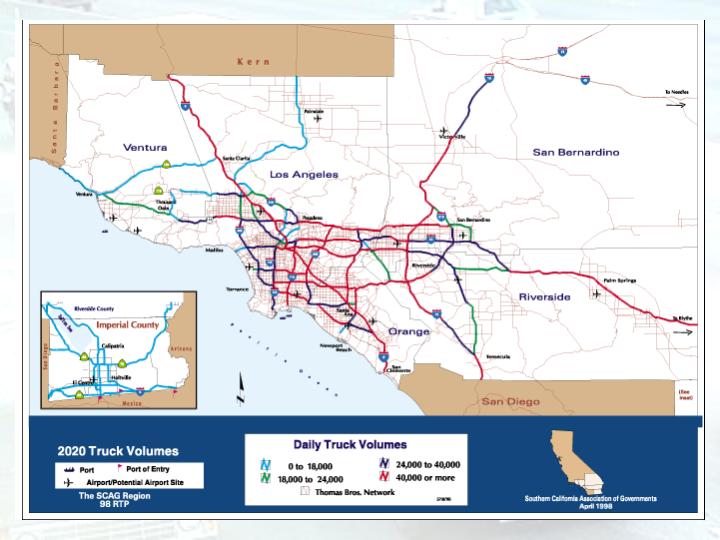
Slide 26:
2020 truck volumes

Slide 27:
SCAG 1995 & 2020
Freight Mode Share
(Million Tons)

Slide 28:
Goods Movement Issues
•the future demand of goods traffic on the region’s roads, railroads,
and airports?
•How do we fund improvements in an efficient and equitable manner?
Options
•Build dedicated truck lanes on I-710, I-15, SR-60
•Evaluate the regional grade crossing system
•Study the costs of converting the truck fleet to alternative fuels; develop
incentives
•Promote cargo airports on closed military bases and in the Inland Empire

Slide 29:
equitab Regional Transportation Plan
Performance Indicators
le manner Performance indicators assist in determining optimum transportation
solutions by comparing investment alternatives.The nine performance indicators
are:
•Mobility
• Accessibility
• Cost-effectiveness
• Reliability
•Air Quality
• Safety
• Customer Satisfaction
• Equity
• Livable Communities

Slide 30:
Container Growth (Ports of Los Angeles and Long Beach)
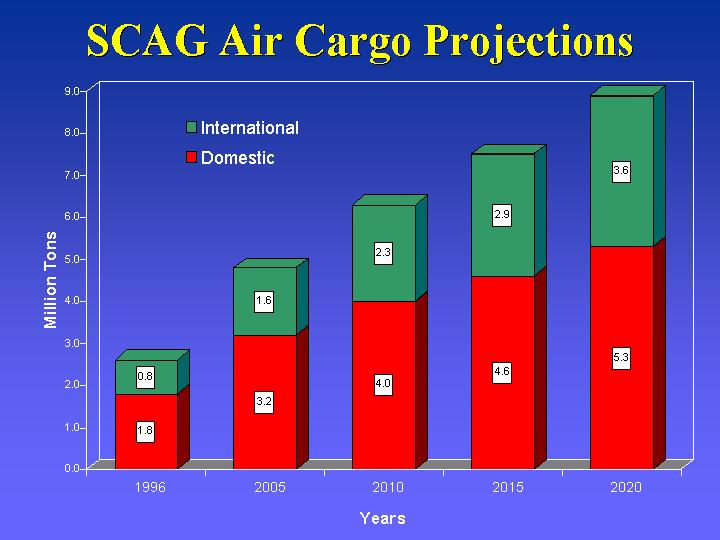
Slide 31:
SCAG Air Cargo Projections

Slide 32:
Major Infrastructure Components
• Alameda Corridor / East
• Orangethorpe Corridor
• Other railway grade crossing improvements
• Exclusive Truck Lanes
• Inter-modal facilities
• Freight throughput productivity enhancement
• Air cargo distribution
Slide 33:
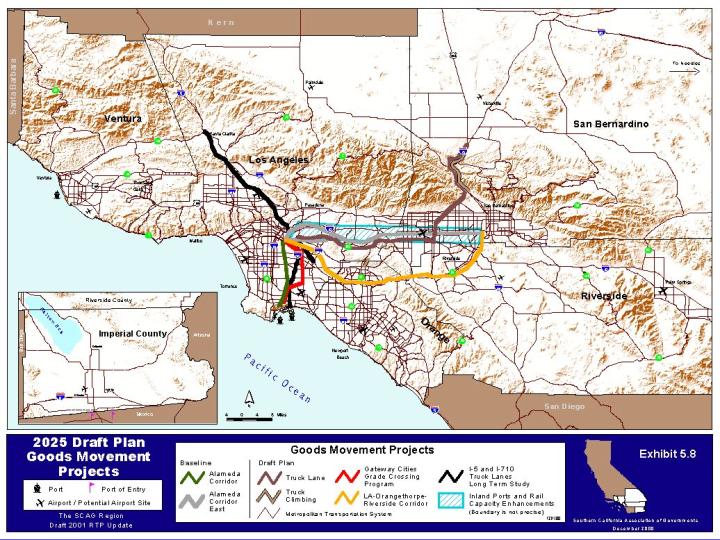
2025 draft plan goods movement projects

Slide 34:
Funding Issues
• Lack of funding for freight throughput enhancement
• Lack of funding for freight movement mitigation
• Difficulty in selecting projects between freight and people movement
• Freight factors
• Traditional funding limitations between truck and rail infrastructure
• Within-the-fence mentality

Slide 35:
Management/Operation Issues
• Encroachment between people and freight movement
• Local ordinances limiting delivery
• Ports - limited operation hours
• Transfer among air, truck, and rail cargo
• Individual bottlenecks
• Empty container issues
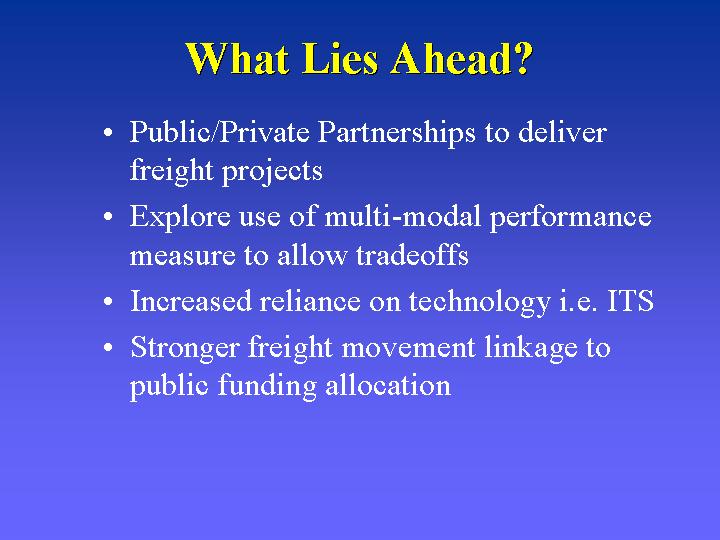
Slide 36:
What Lies Ahead?
• Public/Private Partnerships to deliver freight projects
• Explore use of multi-modal performance measure to allow tradeoffs
• Increased reliance on technology i.e. ITS
• Stronger freight movement linkage to public funding allocation