
Slide 1:
Thank you for inviting me to speak here today.
I don’t think it’s any secret, at least in this room, that freight
has largely been absent from the transportation planning process, and I’m
going to run through why I think that’s happened and what can be done
about it.
But first, it’s important to understand how freight, trucking in particular,
fits into the national economy, because the ability of cities and states to
address the particular challenges that face the trucking industry will have
tremendous impacts on our nation’s future economic health.
Slide 2:
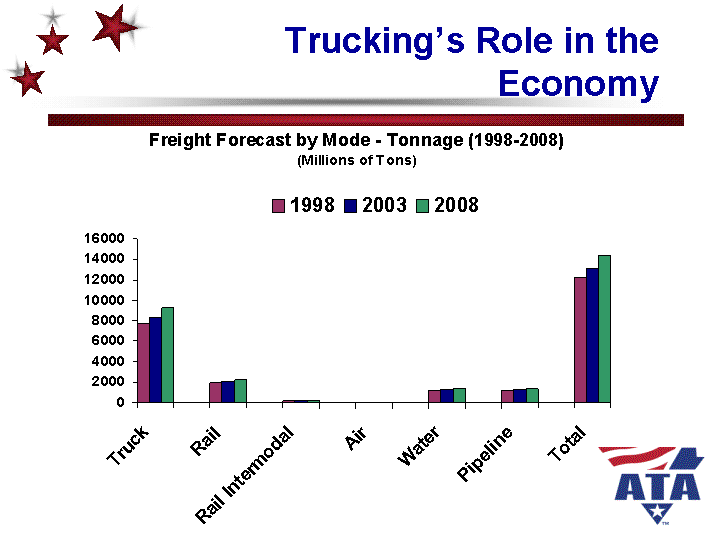
Today, trucking delivers the lion’s share of freight -
around 8 billion tons per year.
That’s over 63% of the market
By 2008 trucks are projected to deliver about 9.3 billion tons, and our market
share is expected to climb as well.
Slide 3:
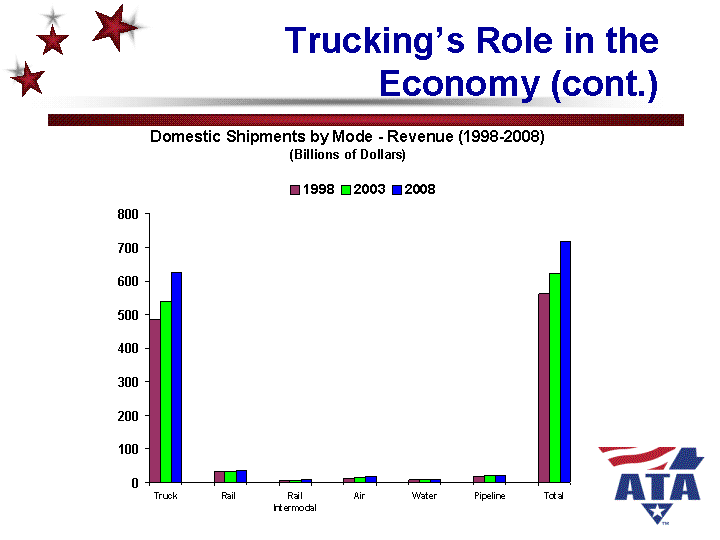
When measured by value, trucking’s dominance of the freight
market, and the importance of its role in the economy, becomes even more clear.
Today, trucking accounts for 5% of the nation’s GDP.
Within a decade, the trucking industry’s revenue is expected to reach
$625 billion.
That’s 87% of the total freight market.
By comparison, our closest competitor, rail, will account for less than 5% of
the market in 2008.
Slide 4:
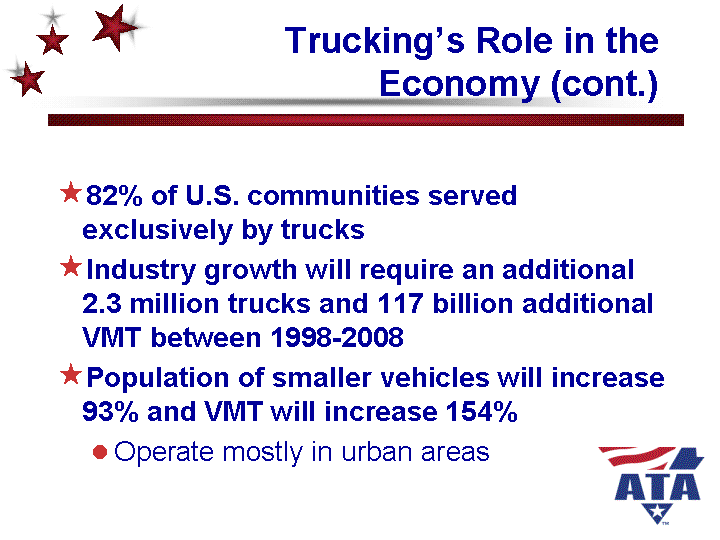
82% of U.S. communities rely exclusively on trucks for their
freight transportation service. They are served by no other mode.
Because of the tremendous growth in the demand for trucking, by 2008, we will
see another 2.3 million trucks on the road and truck travel will increase by
117 billion vehicle miles.
Smaller vehicles will see the most rapid growth. Their population will rise
93%, and miles traveled by these vehicles will explode by 154%.
It is especially important to recognize the future growth of these trucks because
most of their travel occurs in urban areas.
Slide 5:
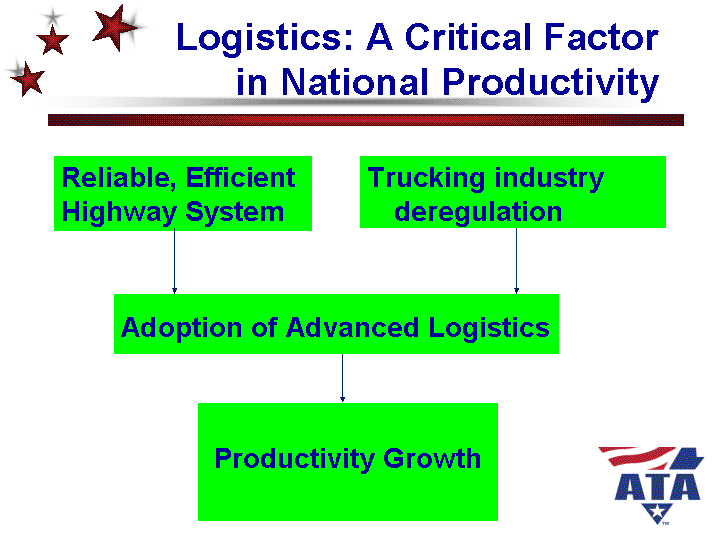
Trucking’s real value is measured in the tremendous contributions
it has made toward national productivity.
Construction of the Interstate system, which reached maturity in the 1970s and
80s,enabled the creation of a transportation system that, for the first time,
permitted reliable delivery of freight, and delivery windows that could be measured
in minutes instead of hours or days.
In addition, deregulation of the trucking industry created tremendous competition,
bringing down rates and fueling investment in new technologies and the development
of highly creative, very efficient, delivery strategies.
These two factors enabled shippers to cut their inventories and respond rapidly
to consumer demands.
This in turn fueled tremendous productivity growth, and has contributed to the
United States’ newfound ability to sustain strong economic growth without
the onset of inflation.

Slide 6:
The adoption of advanced logistics techniques, such as electronic data interchange and just in time deliveries, has allowed firms to produce goods using fewer resources, and to then reinvest their savings in more productivity-improving technologies, creating a sort of productivity improvement cycle.
The impacts of improved logistics over the past two decades
are difficult to overstate.
Inventory carrying costs declined nearly 50%
Transportation costs came down 22%
And the total cost of logistics to the national economy came down by 37%.
To the average American family, the savings that resulted from logistics cost reductions was equivalent to an annual increase in income of about $1,000.
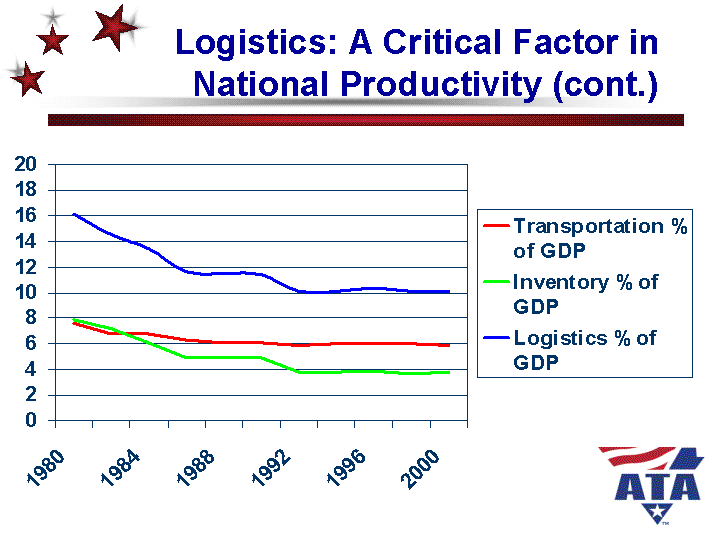
Slide 7:
This chart illustrates the decrease in logistics costs relative to GDP since deregulation.
As you can see, logistics costs as a percentage of GDP has dropped from around 16% to about 10%.
What is troubling, however, is that since the early 1990s, the line is pretty much flat. We seem to be stuck at around 10%.
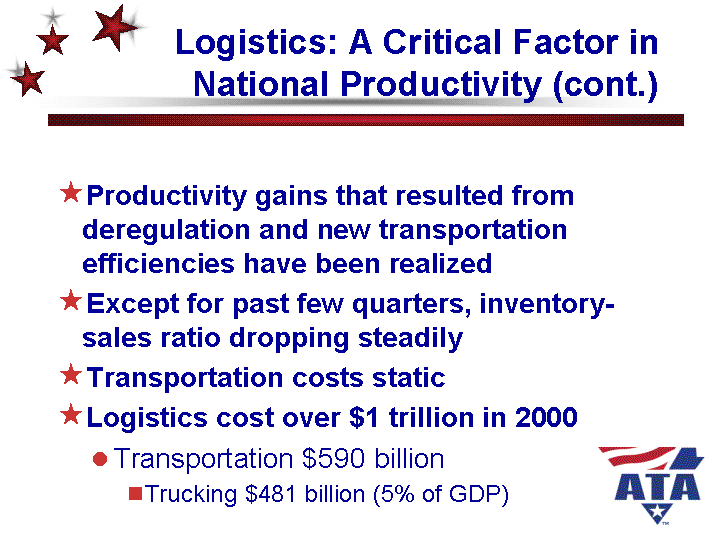
Slide 8:
This suggests that the productivity gains following deregulation,
and the savings that resulted from them, have all been realized.
So what’s causing this to happen?
Well, until the recent economic slowdown, inventory costs have been coming down
fairly steadily.
However, transportation costs, which represent the bulk of logistics costs,
have been static.
This suggests that freight transportation providers, particularly trucking companies,
are facing challenges that have prevented them from bringing their costs down.
Slide 9:
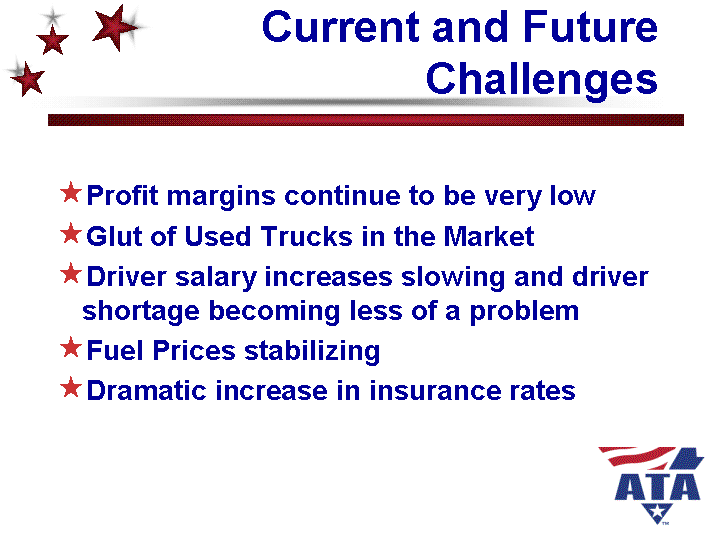
Let’s quickly run through a few of those challenges.
First, profit margins continue to be very low, which prevents carriers from
making investments in more efficient equipment and efficiency enabling technologies.
Contributing to this problem is a glut of used trucks in the market, which has
slowed fleet turnover.
For the short term, while the economy is in a slump, the driver shortage has
subsided, but will likely be a factor again once the economy picks up.
Fuel prices are stabilizing, albeit at a relatively high level.
And the industry has recently experienced a dramatic increase in insurance rates.
Slide 10:
The trucking industry is also facing many serious challenges
that I believe can be traced to either a failure to plan properly or a failure
to implement recommended projects and programs.
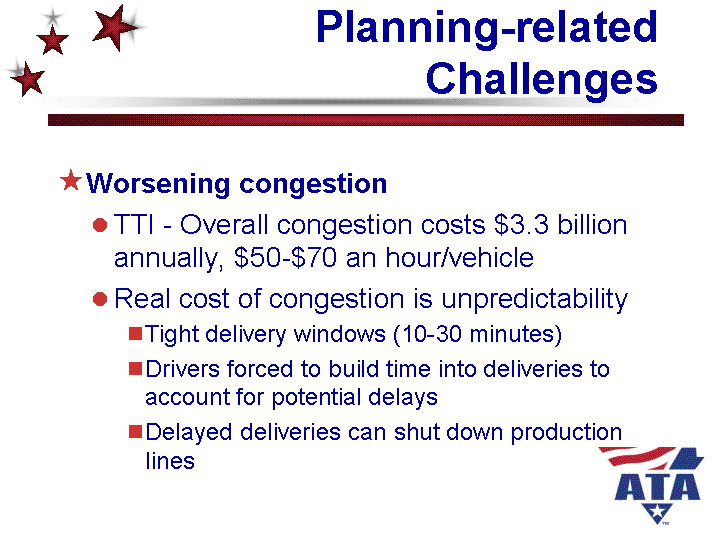
We are, of course, dealing with significantly worse congestion.
While it’s hard to quantify the impact of congestion on the trucking industry,
by one estimate, the annual Texas Transportation Institute report, congestion
costs the industry at least $3.3 billion per year, based on an average vehicle
operating cost of $50 to $70 per hour.
However, the real cost of congestion to the economy, and the one that is extremely
difficult to get our arms around, is not measured in wasted fuel or underutilization
of drivers and equipment. The real cost of congestion is the impact it has on
the predictability of deliveries.
In order for shippers to minimize their inventory costs and take advantage of
advanced logistics, they have set very tight delivery windows, sometimes as
low as 10 minutes.
As more highways become congested, and as the rush hour expands to 3 hours or
more, the highway system becomes less predictable, and truckers are forced to
build some fudge time into their delivery schedules, which reduces driver and
equipment utilization.
And if they are late, many plants’ inventories are so thin that the late
delivery has the potential to actually shut down assembly lines, which forces
plants to carry more inventory than they would like or would need to have if
the highway system was more reliable.
Slide 11:
Another problem that truckers have is with the lack of loading
facilities.
Some cities have converted loading zones into parking spots. They haven’t
kept up with the demand for loading zones and don’t require new buildings
to have loading docks, even as the demand for truck deliveries increases.
There’s no surprise, therefore, that delivery vehicles are forced to double
or even triple park, at a cost of hundreds of millions of dollars a year in
fines. UPS, for example, pays in excess of $1 million in parking tickets to
the District of Columbia alone.
And of course when parked trucks are blocking traffic lanes they’re causing
more congestion.
There’s a tendency to blame trucks for the congestion they contribute
to, and an assumption that they have a lot more flexibility than they do.
Given a choice, truckers would prefer to avoid rush hours.
Which is why schemes like congestion pricing don’t work. There’s
already a financial incentive to avoid peak travel periods, and truckers take
advantage of the opportunity to avoid rush hour travel when they have a choice.
Usually, they don’t get to decide when to make deliveries - that’s
the shipper’s decision.
Truck drivers would like to be able to stage their deliveries by staying at
a rest area or truckstop overnight and getting into the metropolitan area before
the morning rush. Unfortunately, the lack of truck parking outside of metro
areas, besides being a safety hazard, prevents them from doing this, forcing
them into rush hour traffic.

Slide 12:
So what can be done?
First, most congestion is caused by unanticipated incidents, so we need to do
things like clear broken down vehicles off the road quickly and respond rapidly
to hazmat incidents. This means being prepared, having the right equipment in
place, and the right people, who have proper training, and are ready to react
quickly.
This seems obvious, but even large metropolitan transportation agencies will
take hours longer to clear an incident than they would have if they were better
prepared.
Intelligent Transportation Systems can play a role, but we have to be careful
not to be seduced by the promise of technology. A variable message board that
warns of congestion is useless if the highway system doesn’t have excess
capacity. Adoption of technology should complement, not replace, highway capacity
expansion.
Trucks are not cars, and if access control and signalization are designed to
only meet the needs of cars, then you’re going to see trucks clipping
and damaging sidewalks, and traffic lights on heavily traveled truck routes
that allow only one or two vehicles through at a time.
Truckers tend to drive in areas that they are unfamiliar with. They need better
signage and directions letting them know where they can legally park for loading
and unloading or for rest.
Slide 13:
Trucks take longer to accelerate and decelerate, and they have
other operating characteristics that are different than cars. If an agency designs
highways to only accommodate cars, as many do, they shouldn’t be surprised
when trucks flip over on cloverleaf interchanges or a lot of merge-related accidents
are occurring because a ramp is too short to allow the truck adequate space
to reach highway speed.
About 16% of bridges are structurally deficient, including around 3,000 on the
Interstate System. Many are these bridges are closed to some or all trucks,
and that essentially forces trucks onto a smaller highway system. Replacing
or fixing these bridges should be given a very high priority.
I think we’re all familiar with the condition of intermodal connectors,
or will be by the time this conference is over. This is not a problem that is
related to funding. It simply represents a failure to set proper priorities.
There are some relatively simple, inexpensive solutions to the problems involved
in moving freight, and I’ve mentioned a few. The problem is that many
planning agencies don’t have the time, incentive or staff expertise to
recognize and act upon them.
That information can be made available, through the state DOT or some other
source, at a relatively low cost and a small commitment of time.
Slide 14:
Finally, if we in the trucking industry have all of these great
ideas, why don’t we show up at meetings to talk about them?
For one thing, there are just too many agencies holding too many meetings.
Since we’re in Michigan, I’ll pick on Michigan.
There are a dozen MPOs in Michigan. Each holds about 10 to 15 meetings per year.
That’s around 150 meetings per year just in one state. And that doesn’t
include the state DOT meetings. Some states also have turnpike authorities,
which hold their own planning meetings.
The planning process is too slow and incremental. Trucking executives operate
on quarterly timetables; the idea of talking about a project for 5 years before
it even gets started is unfathomable to them, and they lose patience with a
process that is seemingly endless.
And they simply don’t have the time or resources to devote to freight
planning. They have businesses to run.
State trucking associations would have to hire someone full time to keep track
of all the planning activities in their state, and they simply can’t afford
to do that.
There are also cultural barriers to freight planning.
Remember that freight planning as a formal process has only really existed since
1991, and even now, with a few exceptions, freight has been pushed off to the
side in favor of passenger projects, which are more glamorous and enjoy greater
popular and political support.
There’s also a general lack of trust by carriers of government officials,
and, in turn, agency people see freight stakeholders more as adversaries than
as partners or customers.

Slide 15:
So what can be done to get freight stakeholders more involved?
First, simplify and shorten the planning process.
Second, don’t expect freight interests to come to the agency.
The agency must be the one to provide the outreach and to make sure that their
freight contacts remain engaged.
You can’t just do that by creating some kind of advisory panel. They carry
no weight, and their recommendations generally get ignored.
Freight interests have to be in a decision-making capacity if agencies are serious
about addressing freight problems and about keeping freight stakeholders engaged.
For example, MPOs should include freight practitioners on their Boards.
Finally, planning agencies should work with freight practitioners to anticipate
future needs. For example, before building an 8-foot shoulder, consider that
trucks are 8 and a half feet wide, and will likely be blocking a lane of traffic
if they have to pull over.
The trucking industry wants to work with planners. We want to deal with the
barriers to productivity that we face, just as you would like to resolve the
tremendous challenges that you deal with every day.
However, such involvement requires a tremendous commitment on the agency’s
part to give something more than lip service to freight The only way freight
projects will ever compete with passenger projects is if transportation officials
become champions to the cause, to raise the profile of these projects so that
they can be on at least equal footing with passenger projects.