Slide 1:
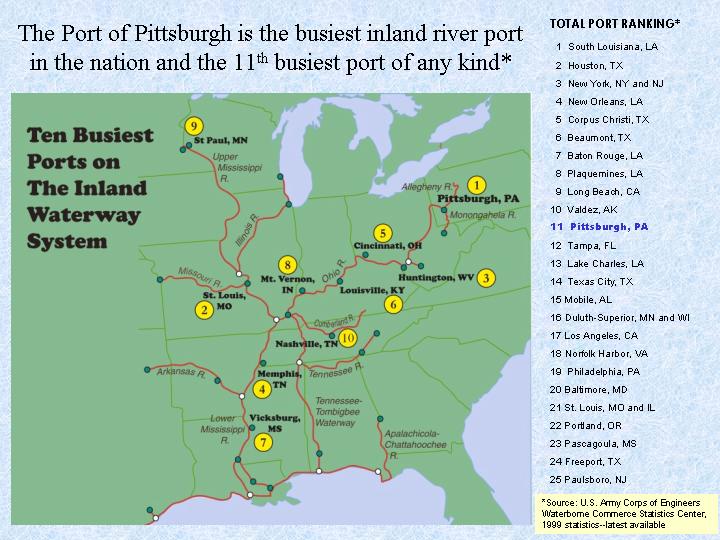
The Port of Pittsburgh is the busiest inland river port in the nation and the 11th busiest port of any kind*
Slide 2:
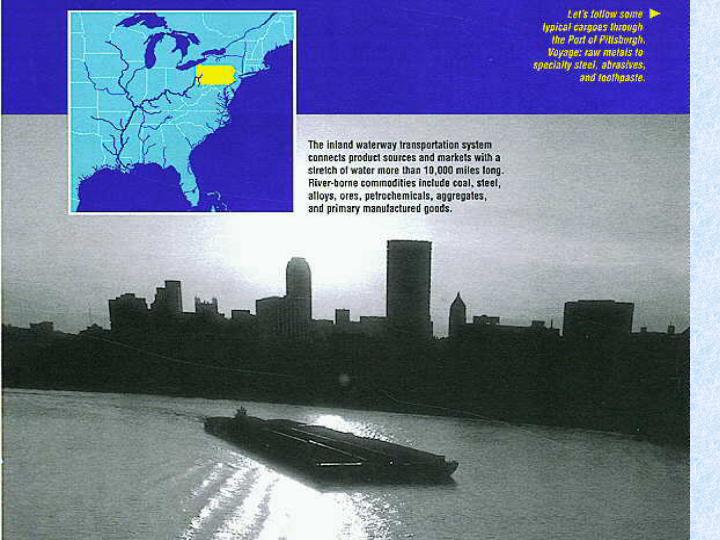
The inland waterway transportation system connects product sources and markets with a siretch of water more than 10,000 miles long. five-borne commodities include coal, steel, alloys, ores, petrcchemicals, aggregates and primary manufactured goods.

Slide 3:
There are more than 200 river industry service facilities in the Port district
Slide 4:
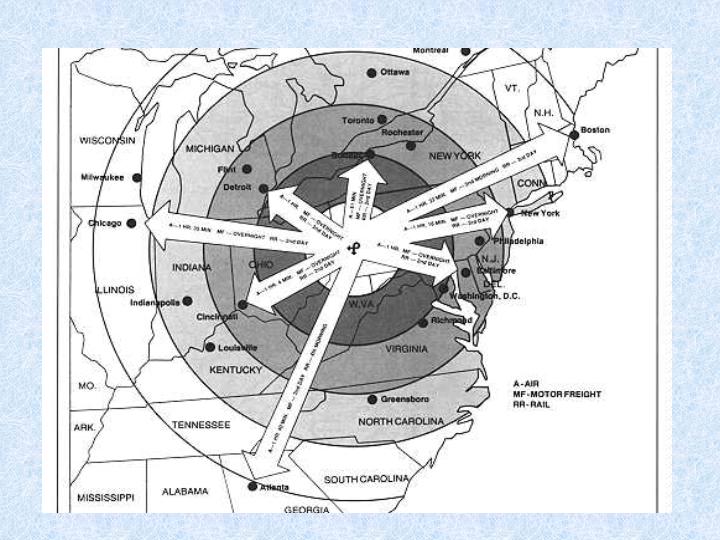
The map shows the distance between port of Pittsburgh and other major cities.
Slide 5:
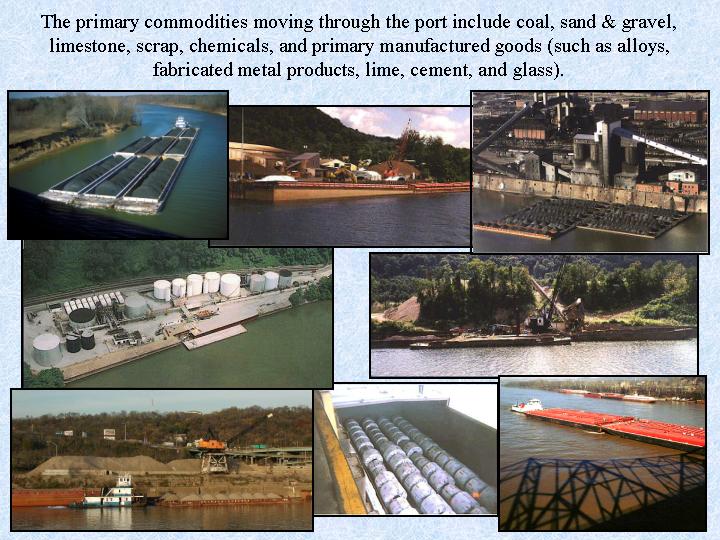
The primary commodities moving through the port include coal, sand & gravel, limestone, scrap, chemicals, and primary manufactured goods (such as alloys, fabricated metal products, lime, cement, and glass).
Slide 6:
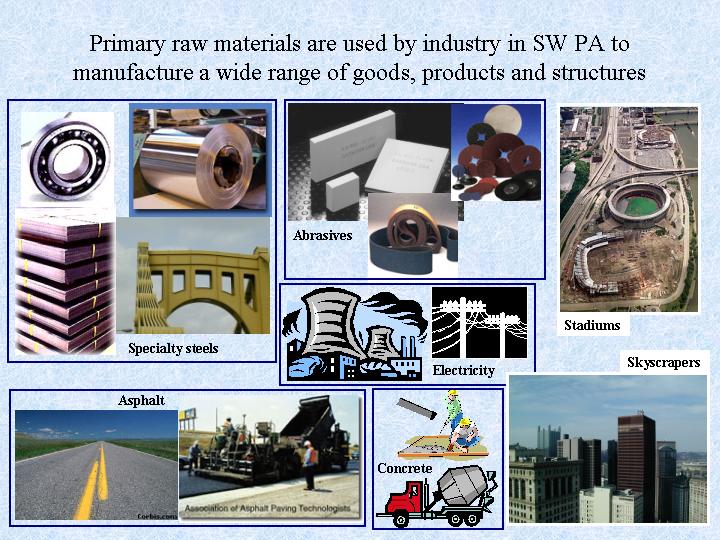
Primary raw materials are used by industry in SW PA to manufacture a wide range of goods, products and structures
Slide 7:
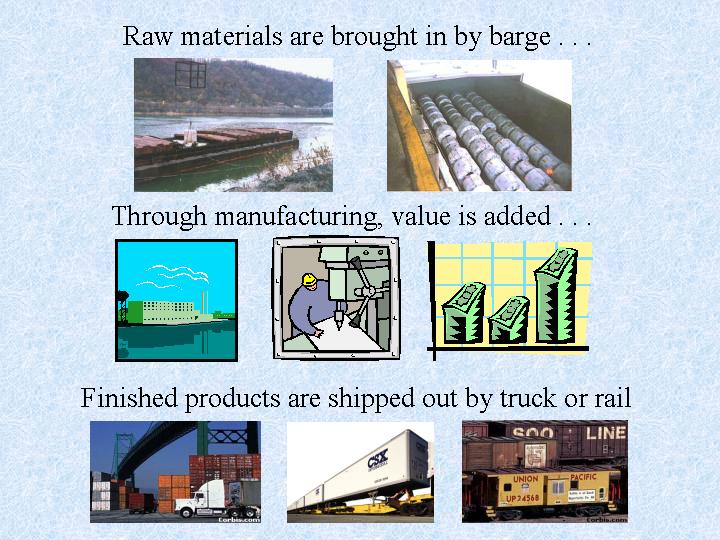
Raw materials are brought in by barge . .; Through manufacturing, value is added; Finished products are shipped out by truck or rail
Slide 8:
The Port of Pittsburgh is the busiest inland river port in the nation and the 11th busiest port of any kind*
Slide 9:
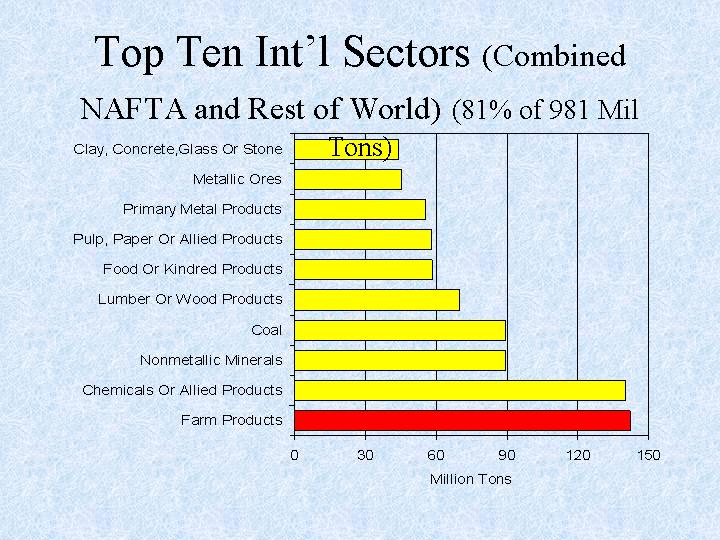
Top Ten Int’l Sectors (Combined NAFTA and Rest of World) (81% of 981 Mil Tons)
Slide 10:
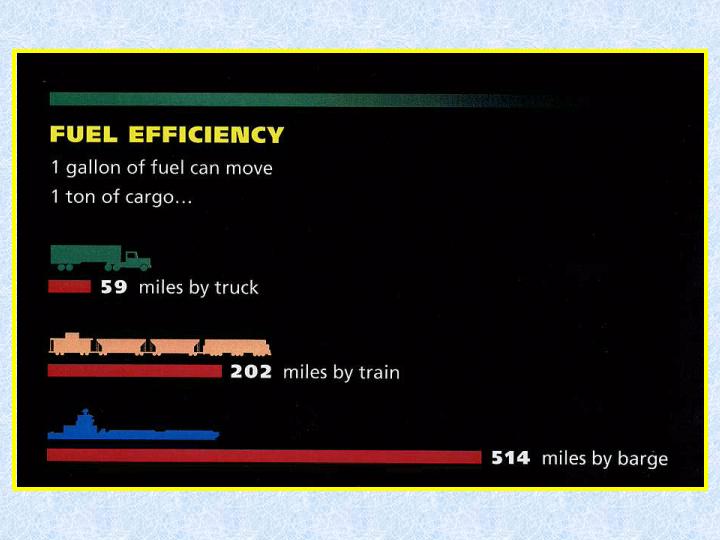
Fuel efficiency: 1 gallon of fuel can move 1 ton of cargo 59 miles by truck, 202 miles by train; and 514 miles by barge.
Slide 11:
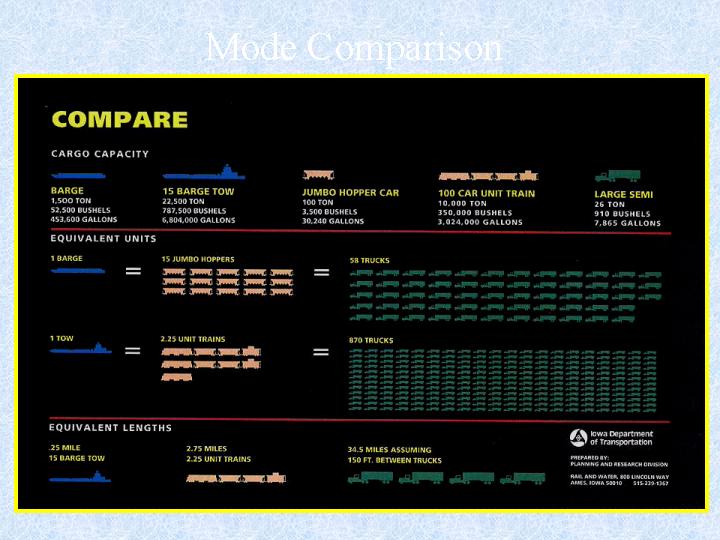
Compare water transportation with truck and rail.
Slide 12:
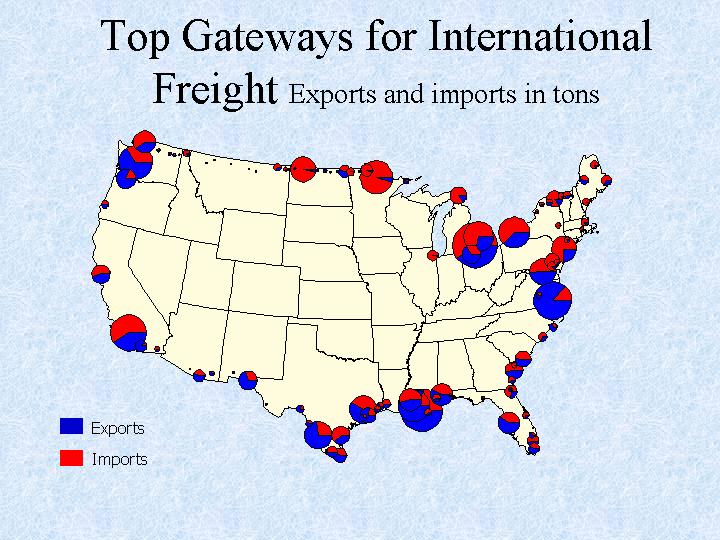
Top Gateways for International Freight Exports and imports in tons
Slide 13:
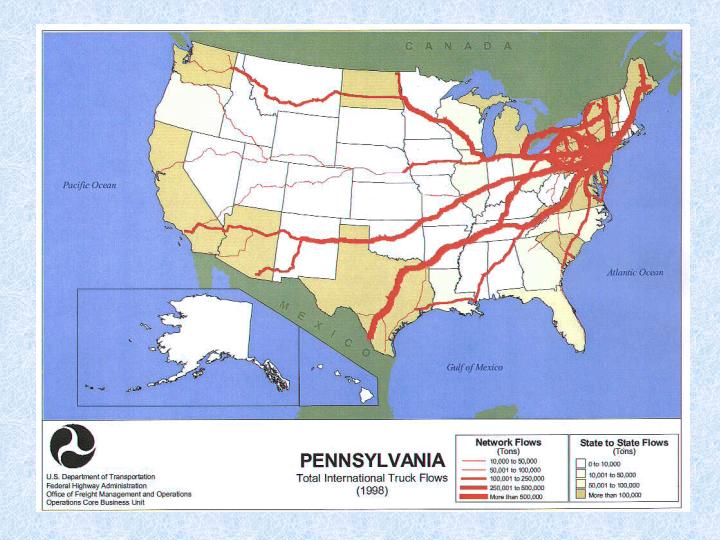
Total international truck flows(pennsylvania)
Slide 14:
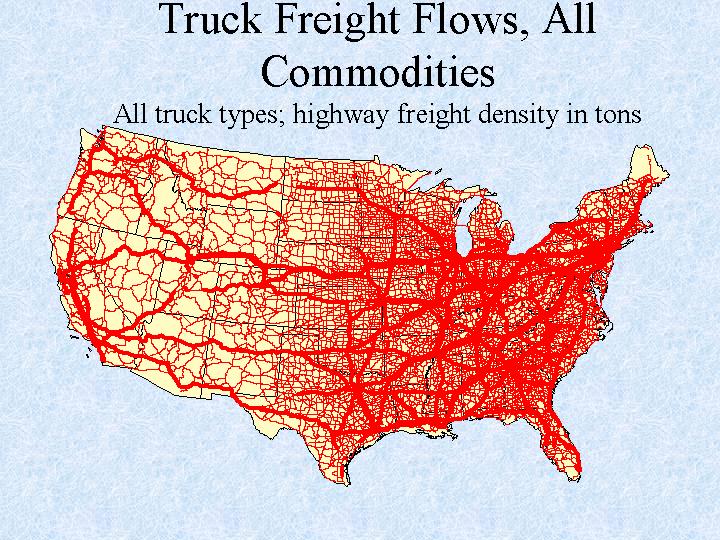
Truck Freight Flows, All Commodities
All truck types; highway freight density in tons
Slide 15:
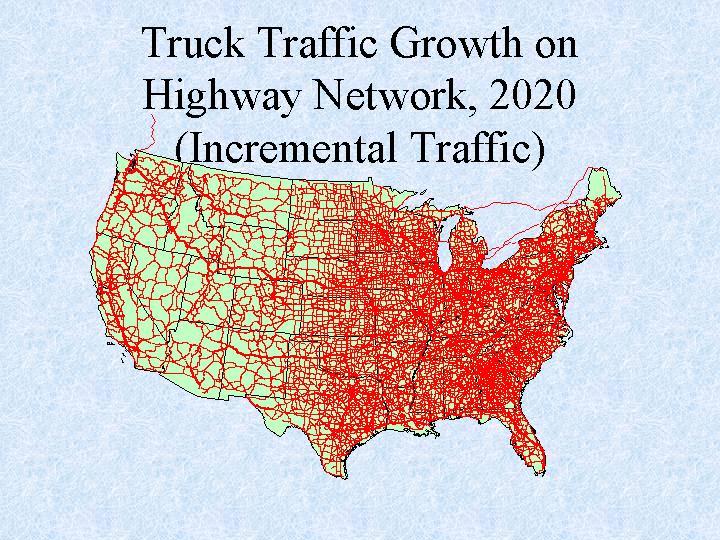
Truck Traffic Growth on Highway Network, 2020 (Incremental Traffic)
Slide 16:
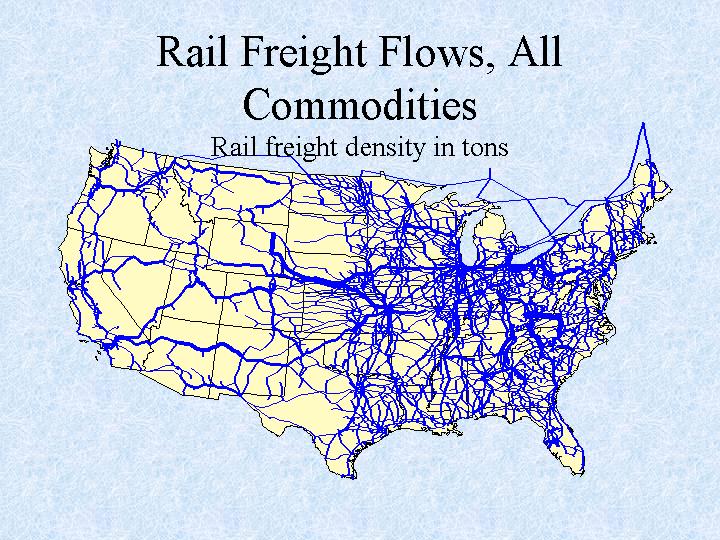
Rail Freight Flows, All Commodities Rail freight density in tons
Slide 17:
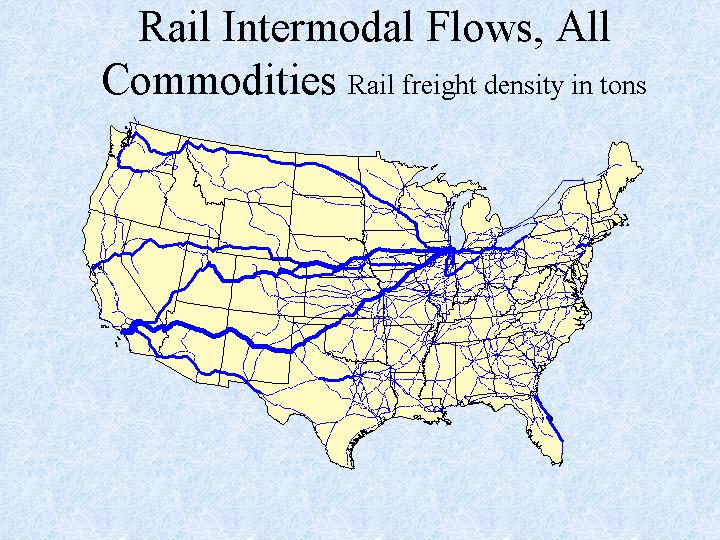
Rail Intermodal Flows, All Commodities Rail freight density in tons
Slide 18:
The map shows the distance between port of Pittsburgh and other major cities.
Slide 19:
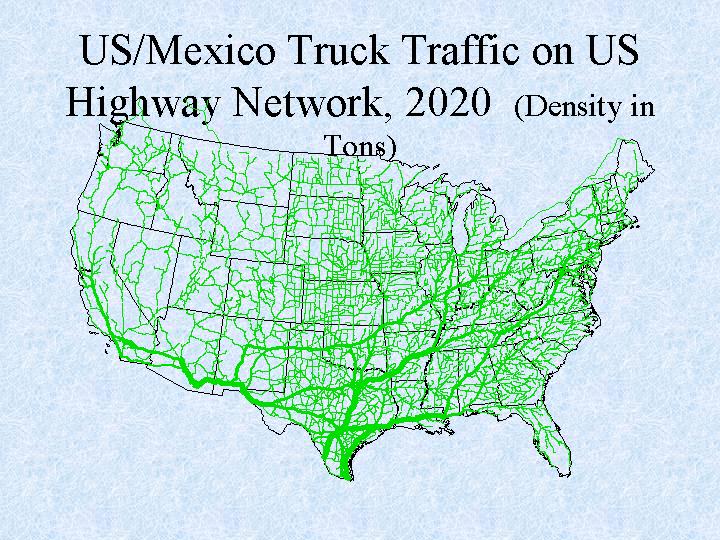
US/Mexico Truck Traffic on US Highway Network, 2020 (Density in Tons)
Slide 20:
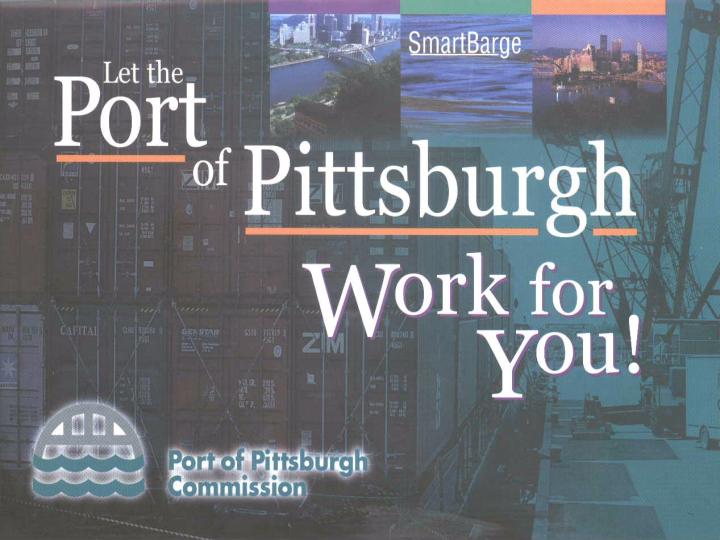
Port of Pittsburgh work for you.
Slide 21:
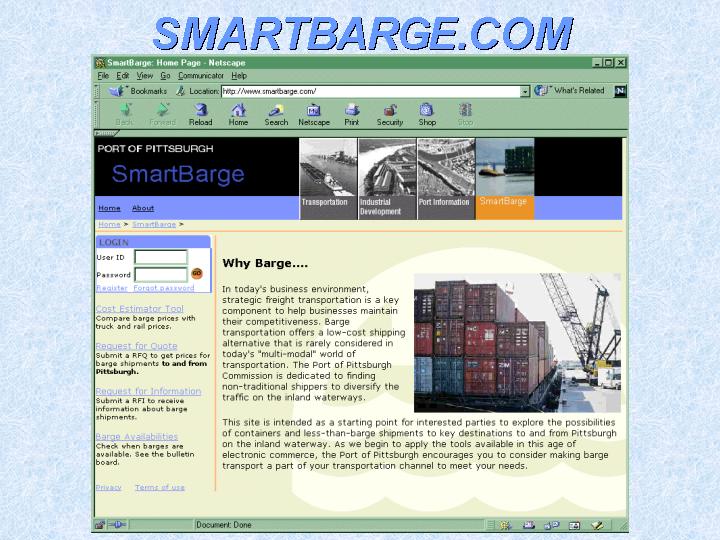
SMARTBARGE.COM
Slide 22:
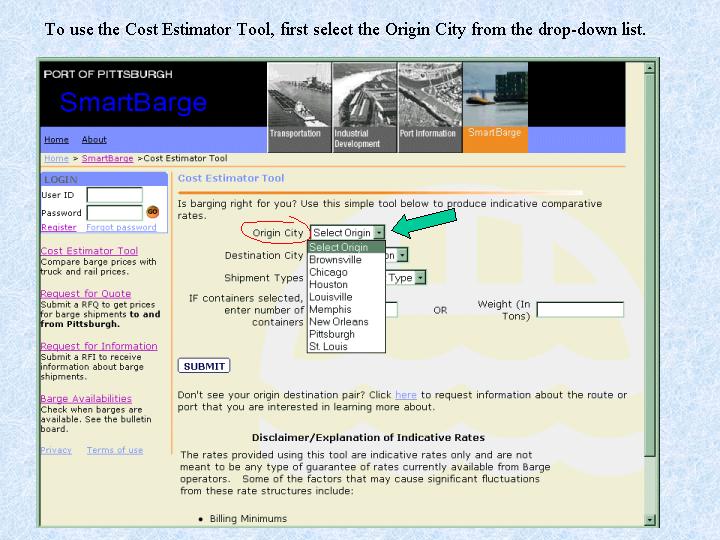
To use the Cost Estimator Tool, first select the Origin City from the drop-down list.
Slide 23:
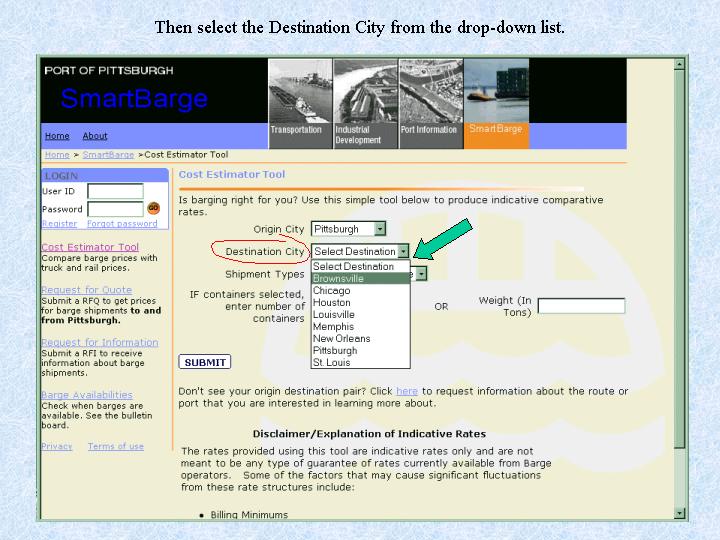
Then select the Destination City from the drop-down list.
Slide 24:
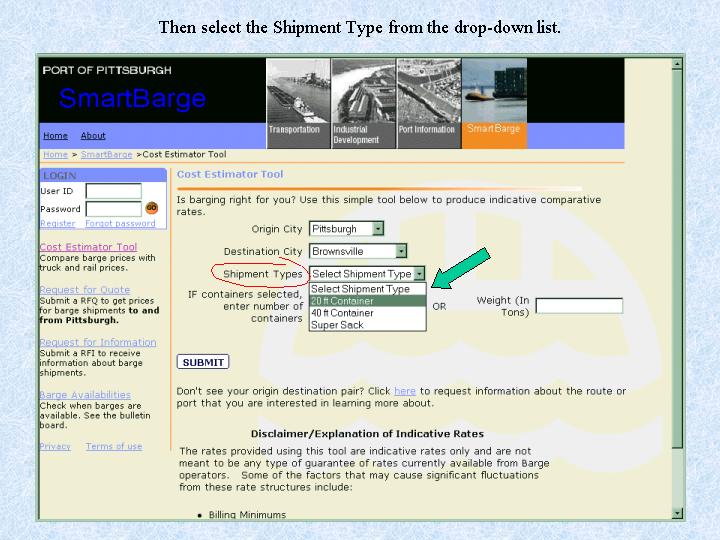
Then select the Shipment Type from the drop-down list.
Slide 25:
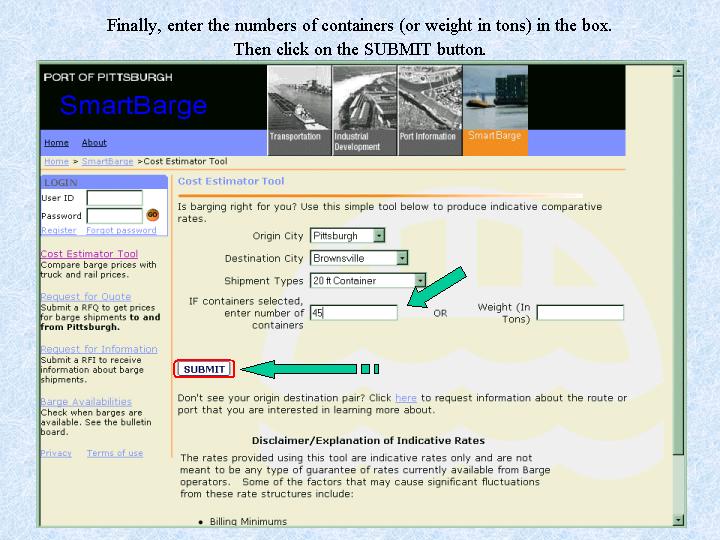
Finally, enter the numbers of containers (or weight in tons)
in the box.
Then click on the SUBMIT button.
Slide 26:
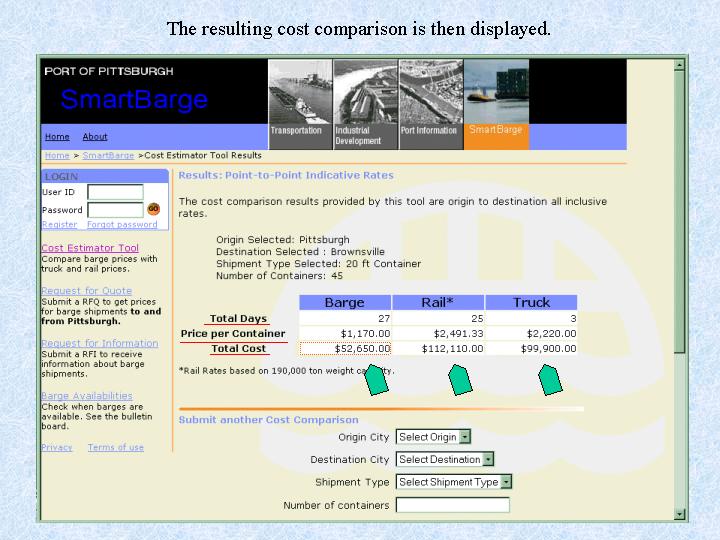
The resulting cost comparison is then displayed.
Slide 27:
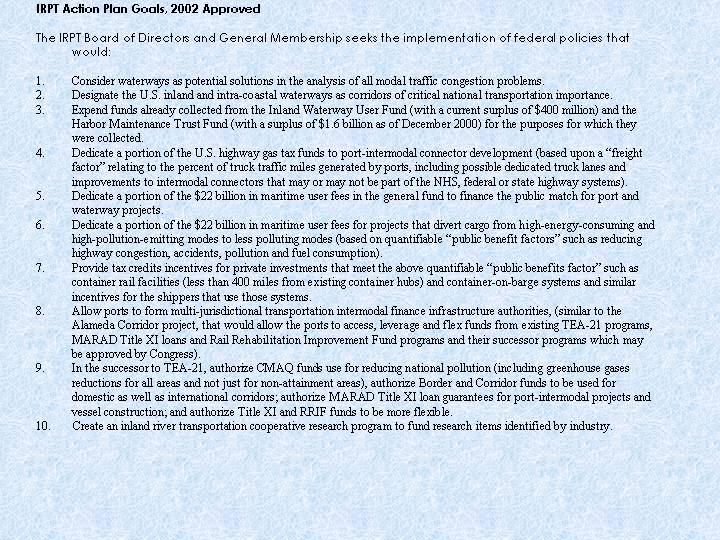
IRPT Action Plan Goals, 2002 Approved
The IRPT Board of Directors and General Membership seeks the implementation
of federal policies that would:
1.
Consider waterways as potential solutions in the analysis of all modal traffic
congestion problems.
2.
Designate the U.S. inland and intra-coastal waterways as corridors of critical
national transportation importance.
3.
Expend funds already collected from the Inland Waterway User Fund (with a current
surplus of $400 million) and the Harbor Maintenance Trust Fund (with a surplus
of $1.6 billion as of December 2000) for the purposes for which they were collected.
4.
Dedicate a portion of the U.S. highway gas tax funds to port-intermodal connector
development (based upon a “freight factor” relating to the percent
of truck traffic miles generated by ports, including possible dedicated truck
lanes and improvements to intermodal connectors that may or may not be part
of the NHS, federal or state highway systems).
5.
Dedicate a portion of the $22 billion in maritime user fees in the general fund
to finance the public match for port and waterway projects.
6.
Dedicate a portion of the $22 billion in maritime user fees for projects that
divert cargo from high-energy-consuming and high-pollution-emitting modes to
less polluting modes (based on quantifiable “public benefit factors”
such as reducing highway congestion, accidents, pollution and fuel consumption).
7.
Provide tax credits incentives for private investments that meet the above quantifiable
“public benefits factor” such as container rail facilities (less
than 400 miles from existing container hubs) and container-on-barge systems
and similar incentives for the shippers that use those systems.
8.
Allow ports to form multi-jurisdictional transportation intermodal finance infrastructure
authorities, (similar to the Alameda Corridor project, that would allow the
ports to access, leverage and flex funds from existing TEA-21 programs, MARAD
Title XI loans and Rail Rehabilitation Improvement Fund programs and their successor
programs which may be approved by Congress).
9.
In the successor to TEA-21, authorize CMAQ funds use for reducing national pollution
(including greenhouse gases reductions for all areas and not just for non-attainment
areas), authorize Border and Corridor funds to be used for domestic as well
as international corridors; authorize MARAD Title XI loan guarantees for port-intermodal
projects and vessel construction; and authorize Title XI and RRIF funds to be
more flexible.
10. Create
an inland river transportation cooperative research program to fund research
items identified by industry.
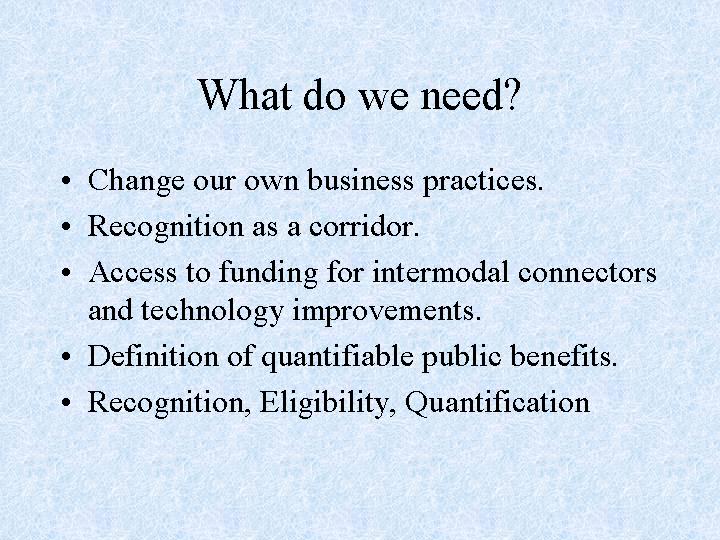
Slide 28:
What do we need?
• Change our own business practices.
• Recognition as a corridor.
• Access to funding for intermodal connectors and technology improvements.
• Definition of quantifiable public benefits.
• Recognition, Eligibility, Quantification