Slide 1:
National Multimodal Freight
Trends/Issues/Forecasts/
Policy Implications
Slide 2:
Objectives…
Discuss emerging trends
Present national freight analysis efforts including forecasts
Identify some of the emerging policy issues toward transportation reauthorization
in 2002-2003
Slide 3:
Emerging Freight Trends and Issues
Markets/Logistics (demand)
From national markets to global markets
From a manufacturing to a service economy
Increased DOD reliance on commercial freight system
Moving to customer dictated just-in-time delivery system
Carriers/Transportation Systems (supply)
From modal fragmentation to cross-modal coordination
From system construction to system optimization
Public Policy
From economic deregulation to safety regulation
From modal to multi-modal surface transportation policy
Increased environmental accountability
Slide 4:
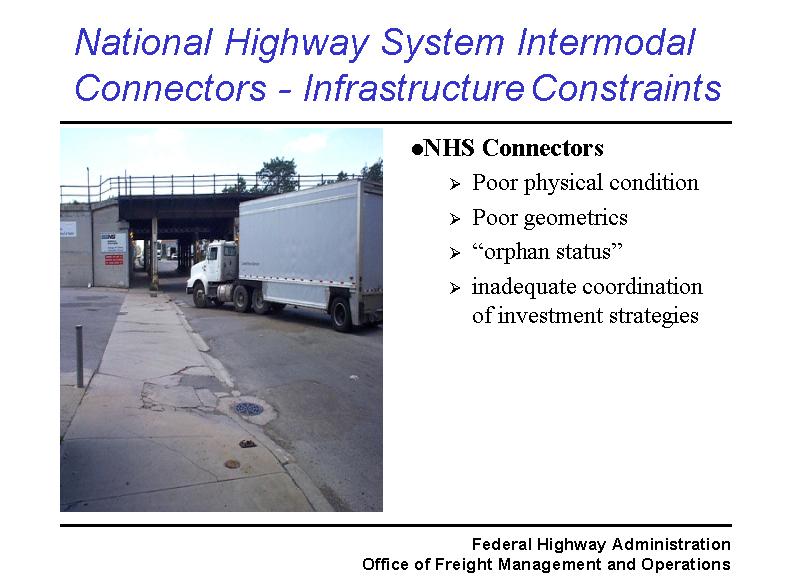
National Highway System Intermodal Connectors - Infrastructure
Constraints
NHS Connectors
Poor physical condition
Poor geometrics
“orphan status”
inadequate coordination of investment strategies
Slide 5:
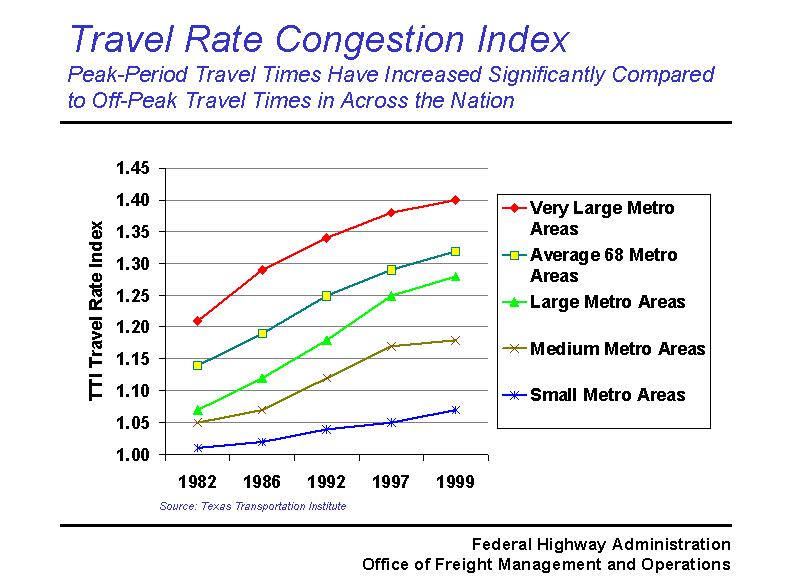
Travel Rate Congestion Index Peak-Period Travel Times Have Increased Significantly Compared to Off-Peak Travel Times in Across the Nation
Slide 6:
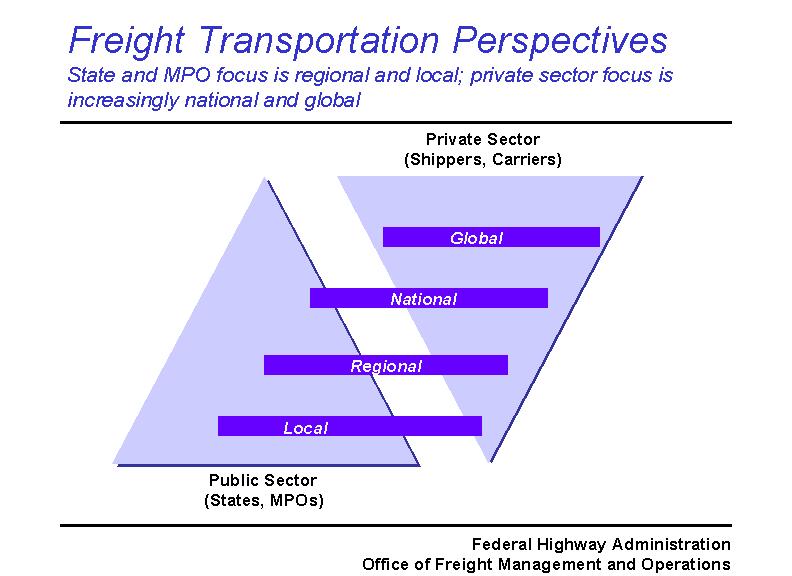
Freight Transportation Perspectives State and MPO focus is regional and local; private sector focus is increasingly national and global
Slide 7:
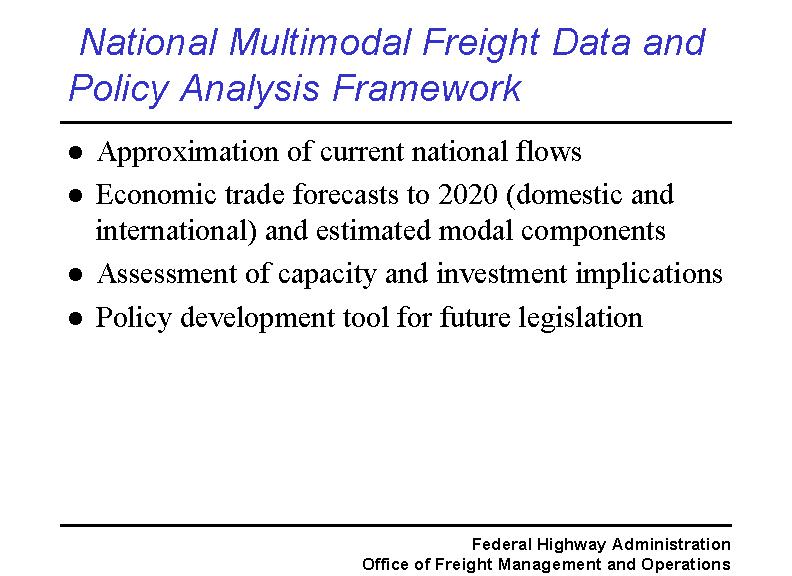
National Multimodal Freight Data and Policy Analysis Framework
Approximation of current national flows
Economic trade forecasts to 2020 (domestic and international) and estimated
modal components
Assessment of capacity and investment implications
Policy development tool for future legislation
Slide 8:
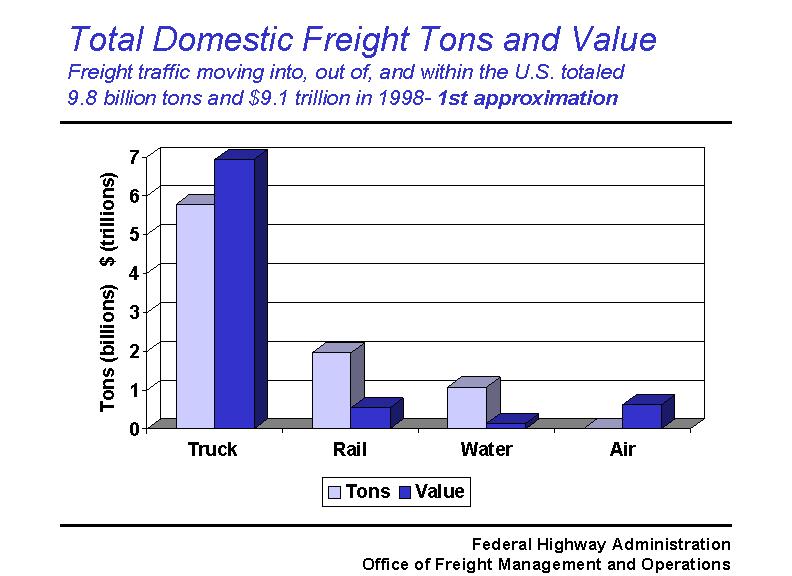
Total Domestic Freight Tons and Value Freight traffic moving into, out of, and within the U.S. totaled 9.8 billion tons and $9.1 trillion in 1998- 1st approximation.
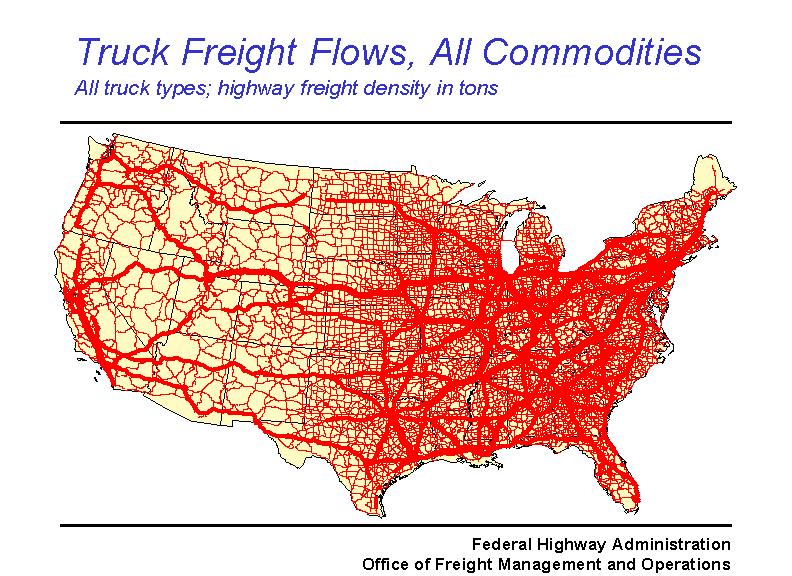
Slide 9:
Truck Freight Flows, All Commodities All truck types; highway freight density in tons
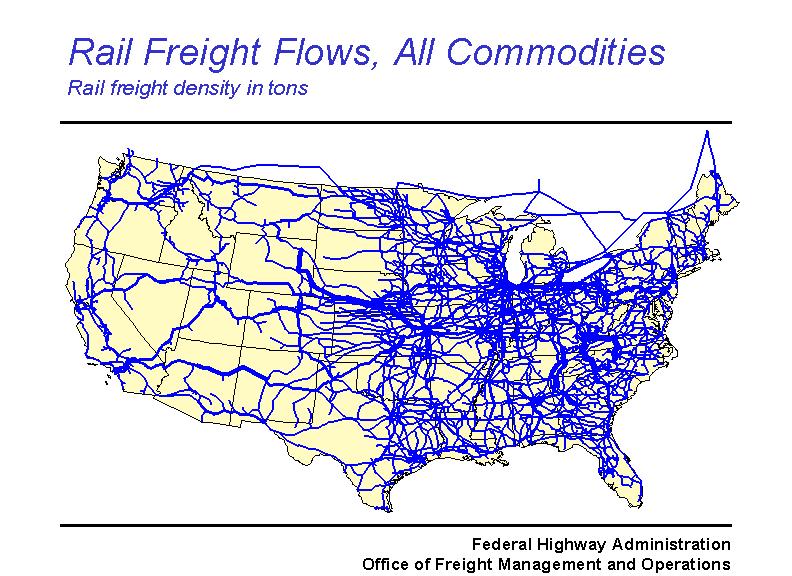
Slide 10:
Rail Freight Flows, All Commodities Rail freight density in tons.
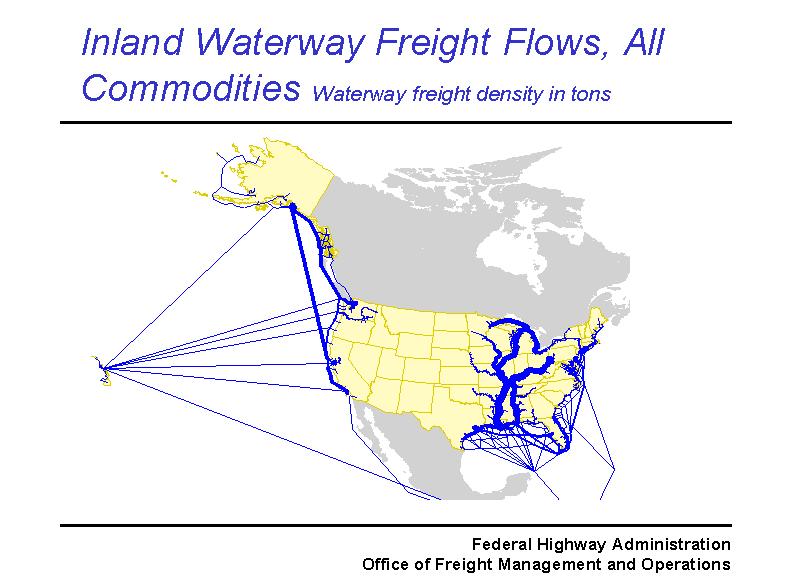
Slide 11:
Inland Waterway Freight Flows, All Commodities Waterway freight density in tons.
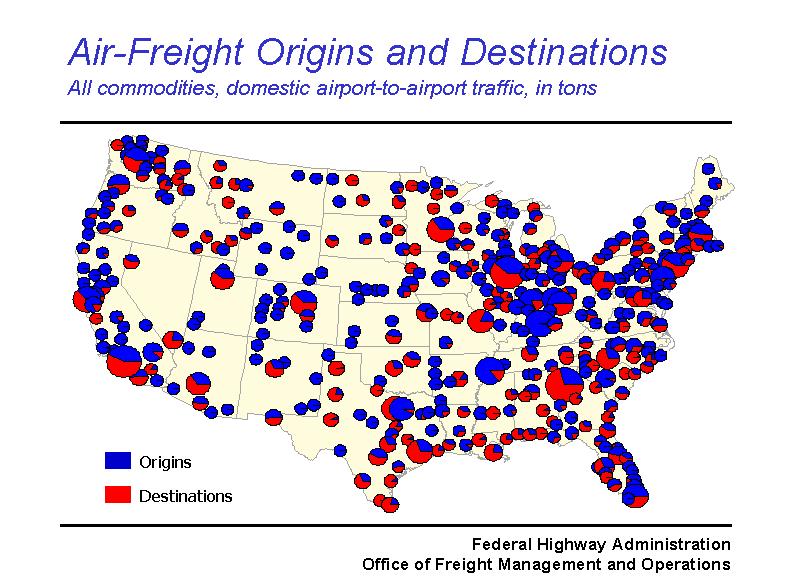
Slide 12:
Air-Freight Origins and Destinations All commodities, domestic airport-to-airport traffic, in tons.
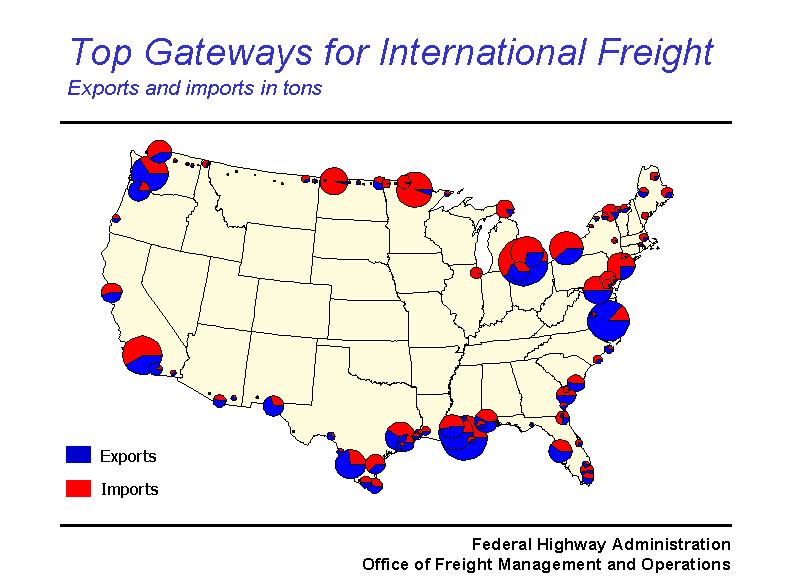
Slide 13:
Top Gateways for International Freight Exports and imports in tons
Slide 14:
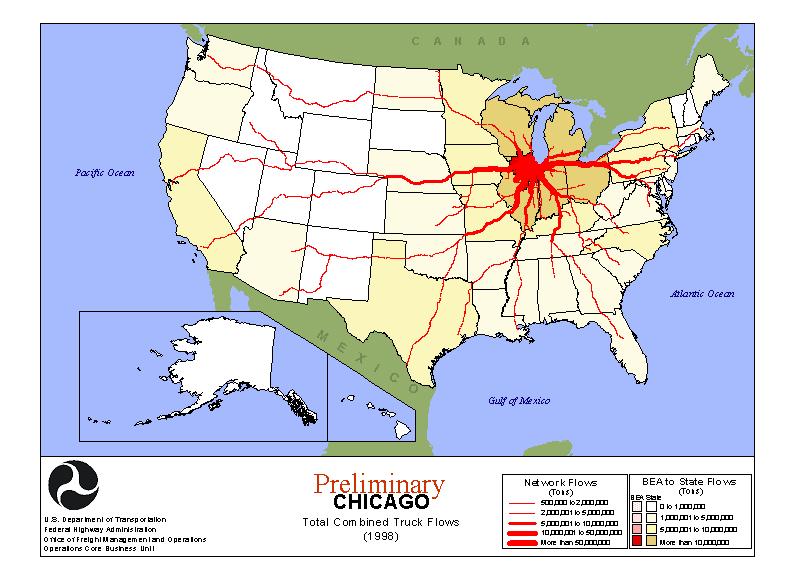
Total combined trcuk flows at Chicago in 1998.
Slide 15:
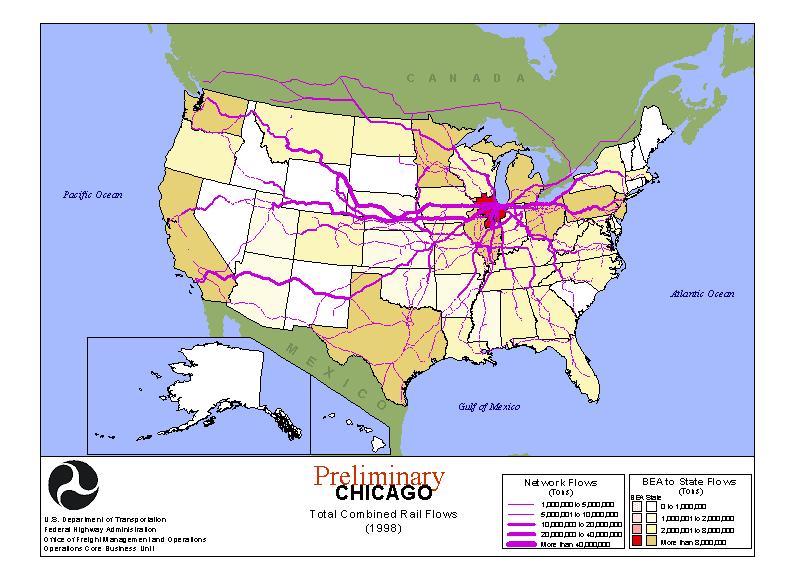
Total combined rail flows at Chicago in 1998.
Slide 16:
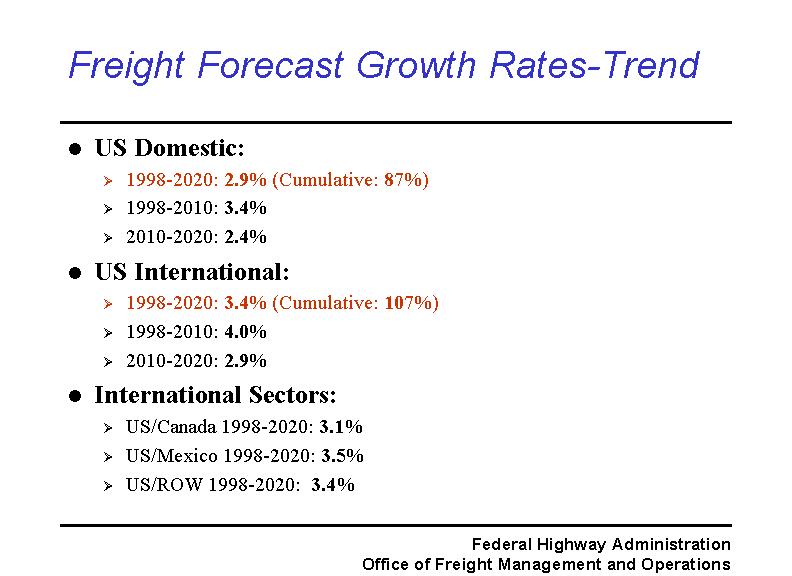
Freight Forecast Growth Rates-Trend
US Domestic:
1998-2020: 2.9% (Cumulative: 87%)
1998-2010: 3.4%
2010-2020: 2.4%
US International:
1998-2020: 3.4% (Cumulative: 107%)
1998-2010: 4.0%
2010-2020: 2.9%
International Sectors:
US/Canada 1998-2020: 3.1%
US/Mexico 1998-2020: 3.5%
US/ROW 1998-2020: 3.4%
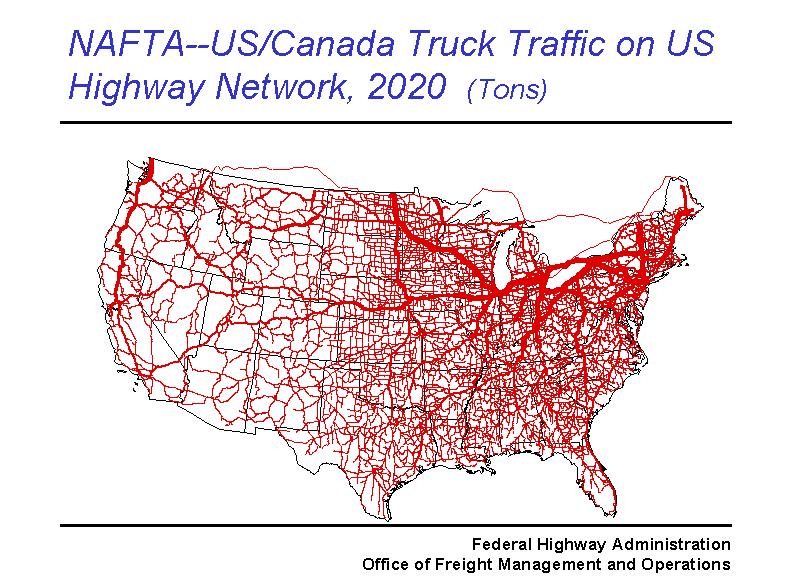
Slide 17:
NAFTA--US/Canada Truck Traffic on US Highway Network, 2020 (Tons)
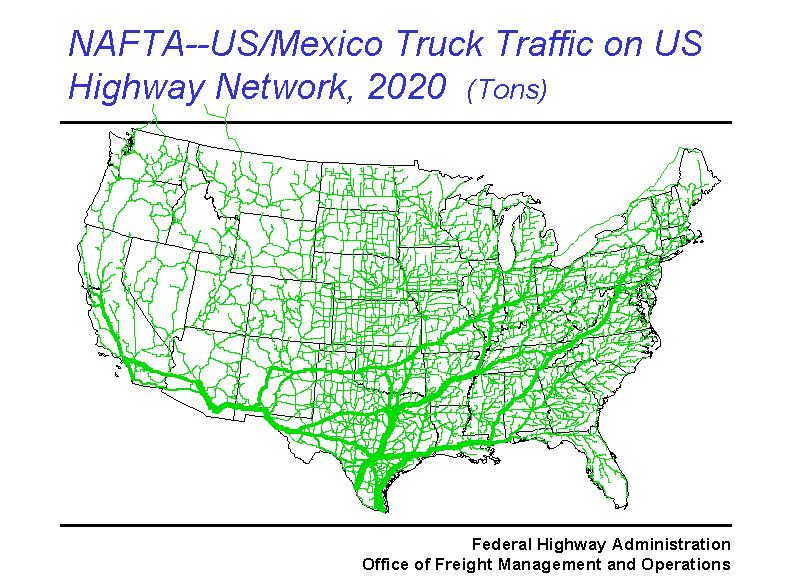
Slide 18:
NAFTA--US/Mexico Truck Traffic on US Highway Network, 2020 (Tons)
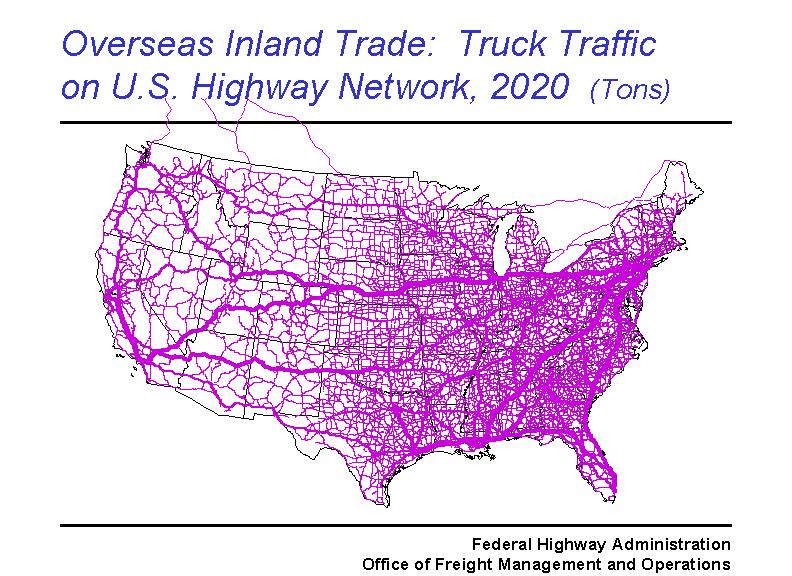
Slide 19:
Overseas Inland Trade: Truck Traffic on U.S. Highway Network, 2020 (Tons)
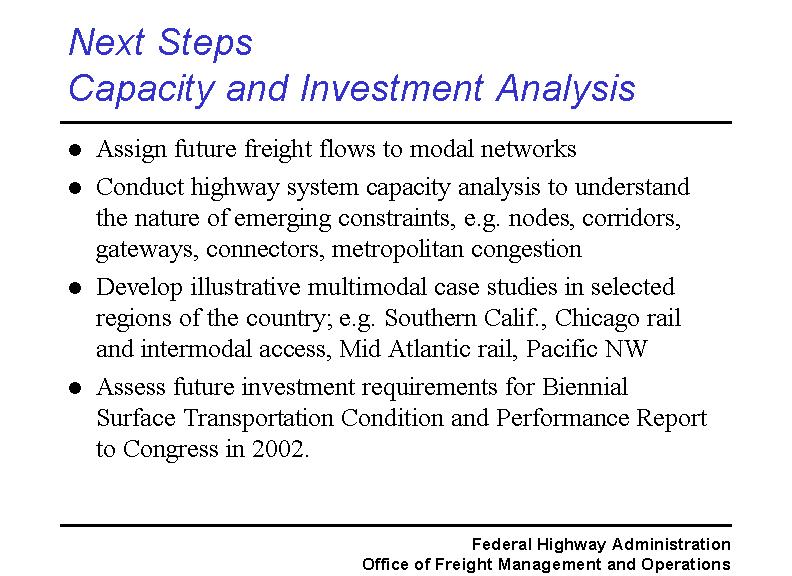
Slide 20:
Next Steps
Capacity and Investment Analysis
Assign future freight flows to modal networks
Conduct highway system capacity analysis to understand the nature of emerging
constraints, e.g. nodes, corridors, gateways, connectors, metropolitan congestion
Develop illustrative multimodal case studies in selected regions of the country;
e.g. Southern Calif., Chicago rail and intermodal access, Mid Atlantic rail,
Pacific NW
Assess future investment requirements for Biennial
Surface Transportation Condition and Performance Report to Congress in 2002.
Slide 21:
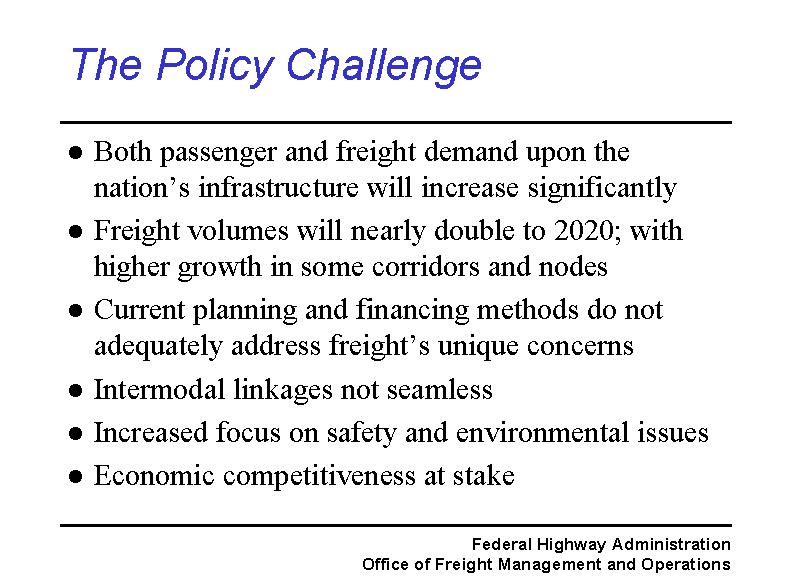
The Policy Challenge
Both passenger and freight demand upon the nation’s infrastructure will
increase significantly
Freight volumes will nearly double to 2020; with higher growth in some corridors
and nodes
Current planning and financing methods do not adequately address freight’s
unique concerns
Intermodal linkages not seamless
Increased focus on safety and environmental issues
Economic competitiveness at stake
Slide 22:
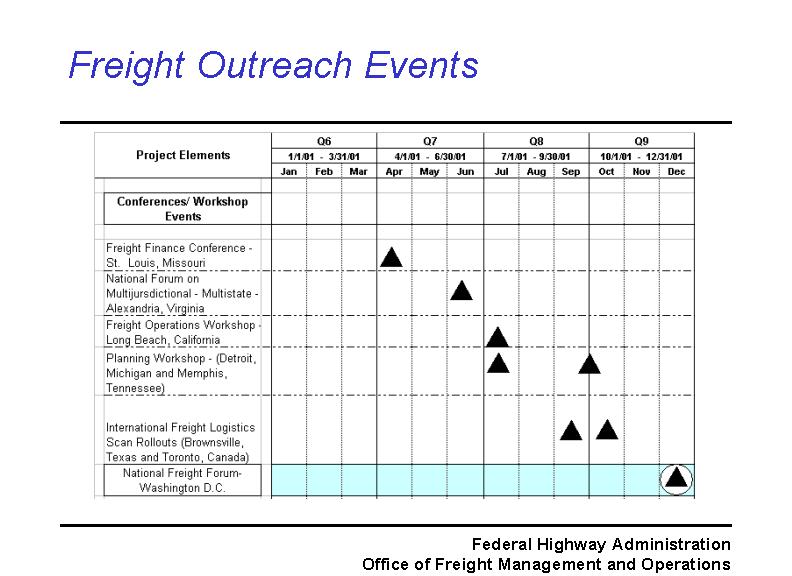
Freight Outreach Events
Slide 23:
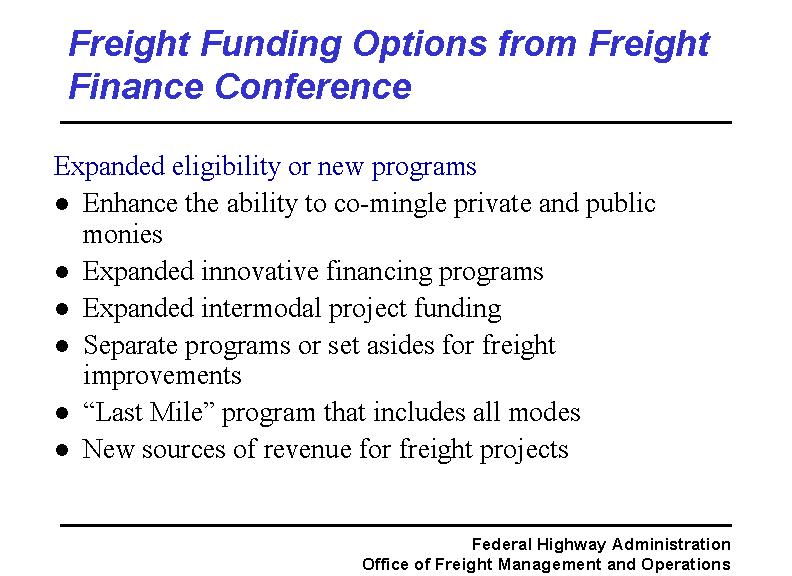
Freight Funding Options from Freight Finance Conference
Expanded eligibility or new programs
Enhance the ability to co-mingle private and public monies
Expanded innovative financing programs
Expanded intermodal project funding
Separate programs or set asides for freight improvements
“Last Mile” program that includes all modes
New sources of revenue for freight projects
Slide 24:
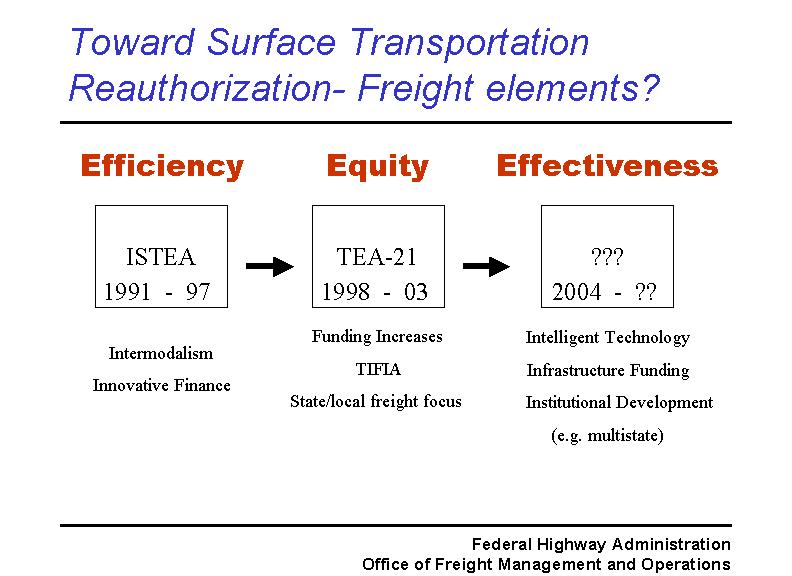
Toward Surface Transportation Reauthorization- Freight elements?
Slide 25:
Toward Surface Transportation Reauthorization- Freight elements?
FHWA Office of Freight Management and Operations, USDOT
http://www.ops.fhwa.dot.gov/freight
Gary Maring
Director
gary.maring@fhwa.dot.gov