Slide 1:
A NEW FRAMEWORKA NEW FRAMEWORK
Slide 2:
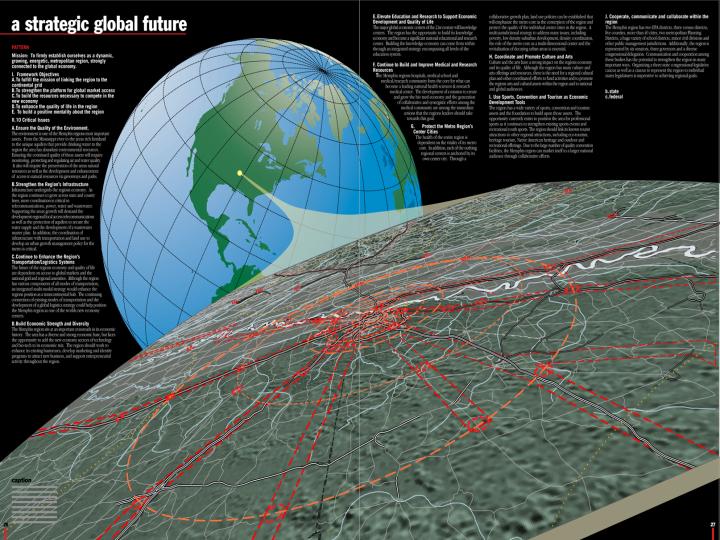
Strategic Global Future
Slide 3:
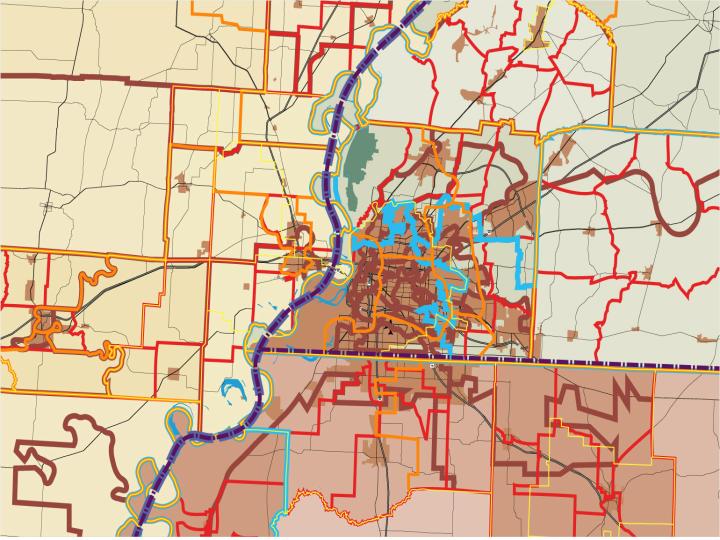
Regional Political Map
Slide 4:
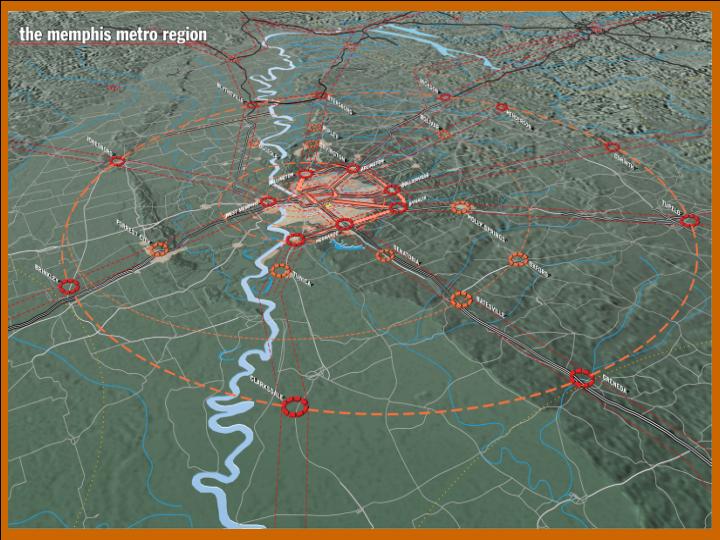
Memphis Metro Region
Slide 5:
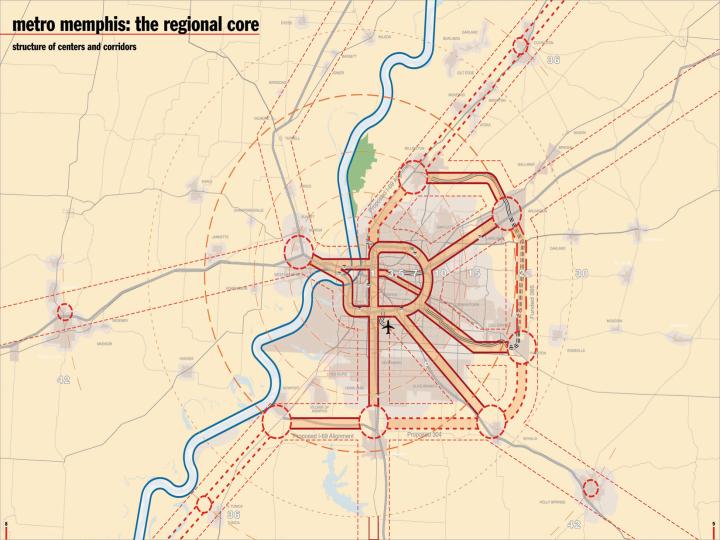
Memphis: The Regional Core
Slide 6:
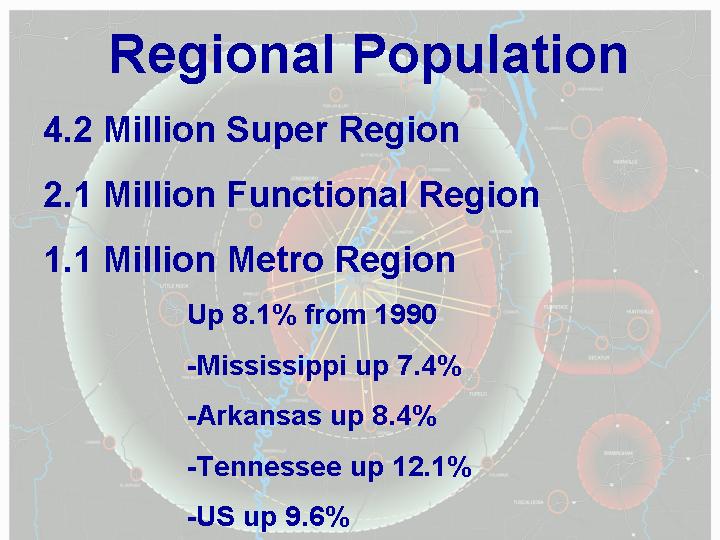
Regional Population
4.2 Million Super Region
2.1 Million Functional Region
1.1 Million Metro Region
Up 8.1% from 1990
-Mississippi up 7.4%
-Arkansas up 8.4%
-Tennessee up 12.1%
-US up 9.6%
Slide 7:
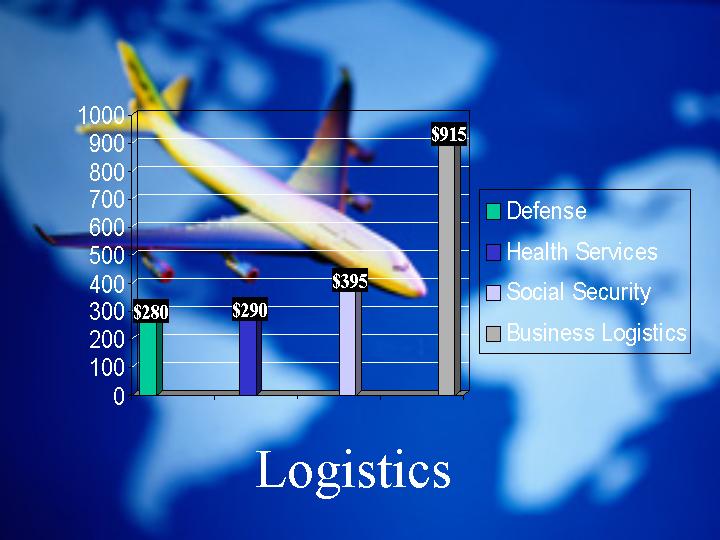
Logistics

Slide 8:
CMC
FedEx
MCI
Nike
Sears
SITEL
NextLink
BellSouth
Promus
AutoZone
Pfizer
St. Jude
Unisource
Time Warner
Executive Call Center
Stream International
Omni Financial services
International Paper
Brother
General Electric
Slide 9:
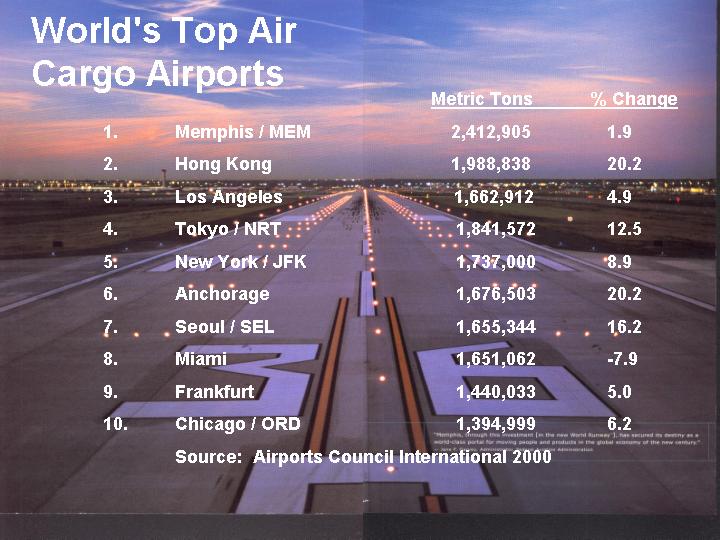
World's Top Air Cargo Airports
Metric Tons % Change
1. Memphis / MEM 2,412,905 1.9
2. Hong Kong 1,988,838 20.2
3. Los Angeles 1,662,912 4.9
4. Tokyo / NRT 1,841,572 12.5
5. New York / JFK 1,737,000 8.9
6. Anchorage 1,676,503 20.2
7. Seoul / SEL 1,655,344 16.2
8. Miami 1,651,062 -7.9
9. Frankfurt 1,440,033 5.0
10. Chicago / ORD 1,394,999 6.2
Source: Airports Council International 2000
Slide 10:
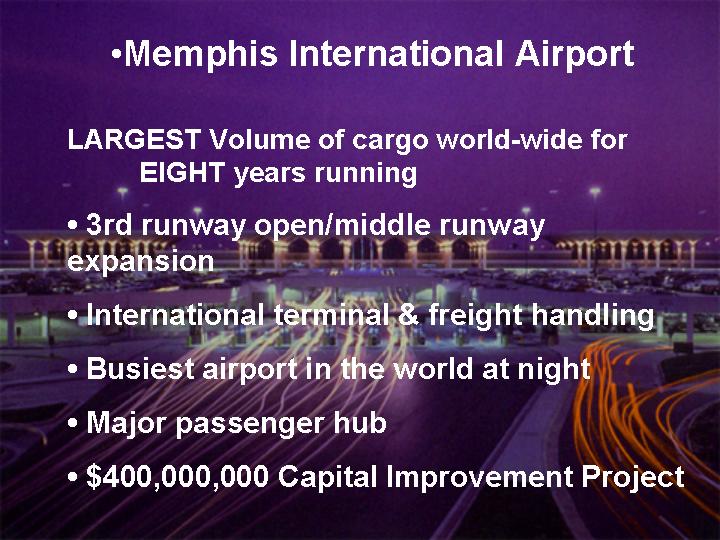
Memphis International Airport
LARGEST Volume of cargo world-wide for EIGHT years running
• 3rd runway open/middle runway expansion
• International terminal & freight handling
• Busiest airport in the world at night
• Major passenger hub
• $400,000,000 Capital Improvement Project
Slide 11:
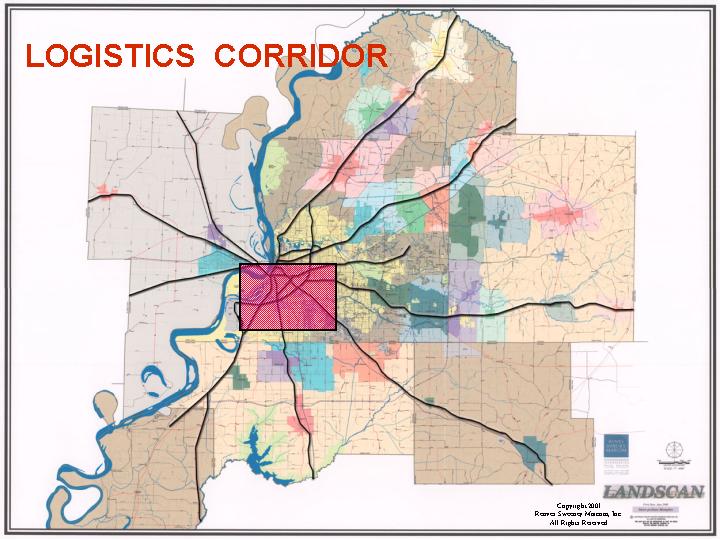
LOGISTICS CORRIDOR
Slide 12:
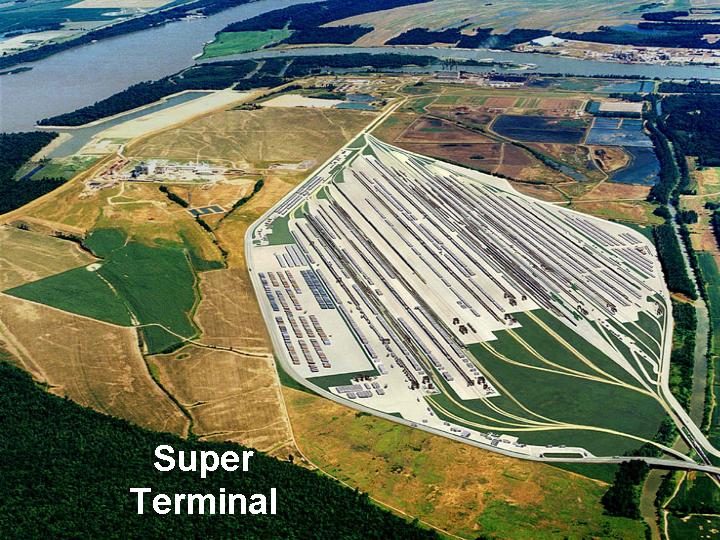
Supre Terminal
Slide 13:
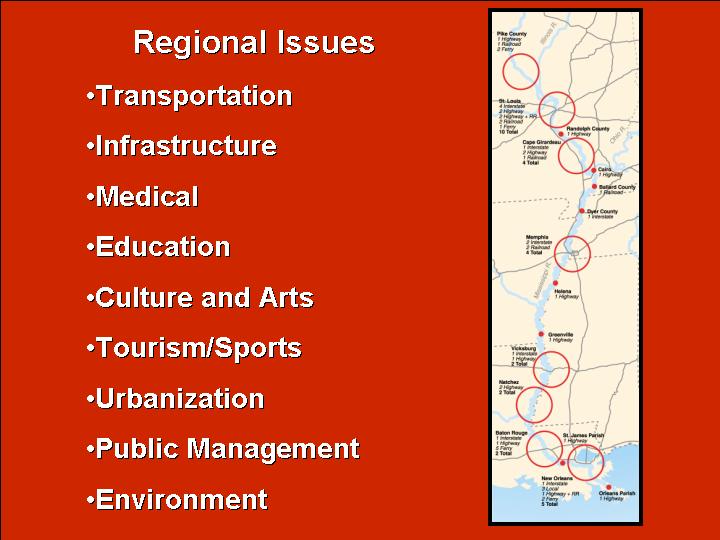
Regional Issues
Transportation
Infrastructure
Medical
Education
Culture and Arts
Tourism/Sports
Urbanization
Public Management
Environment
Slide 14:
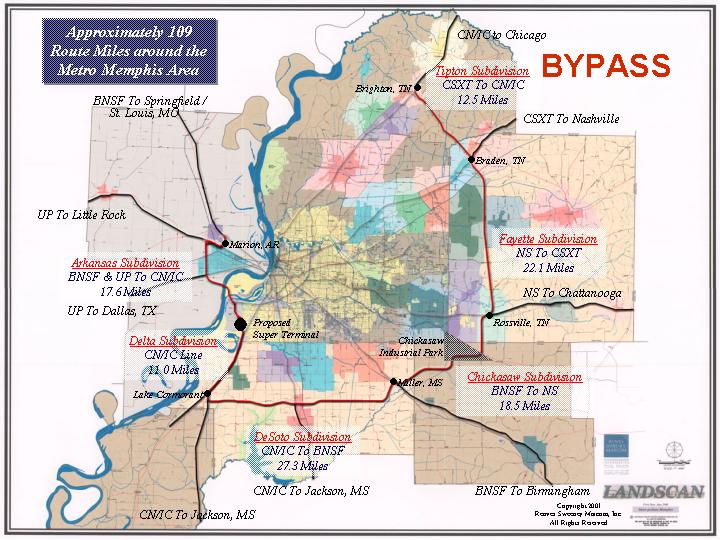
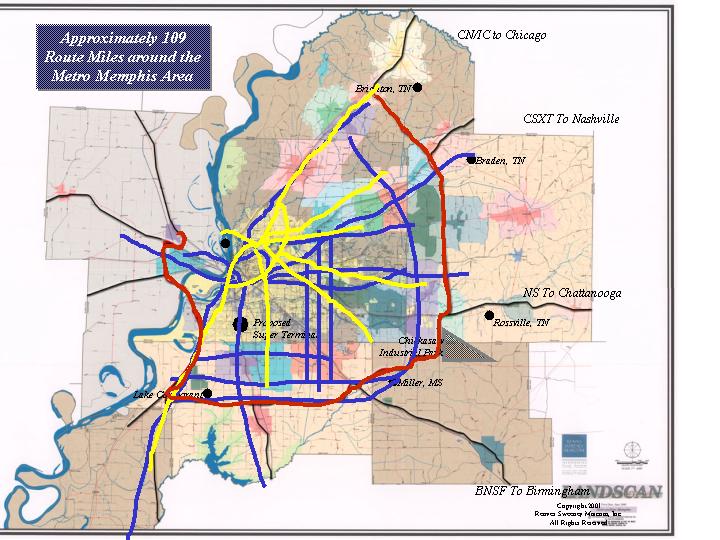
Approximately 109 Route Miles around the Metro Memphis Area
Slide 15:
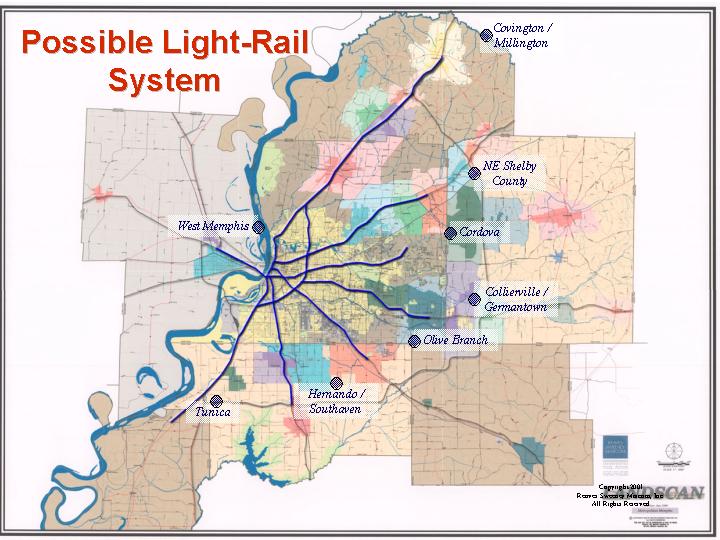
Possible Light-Rail System
Slide 16:
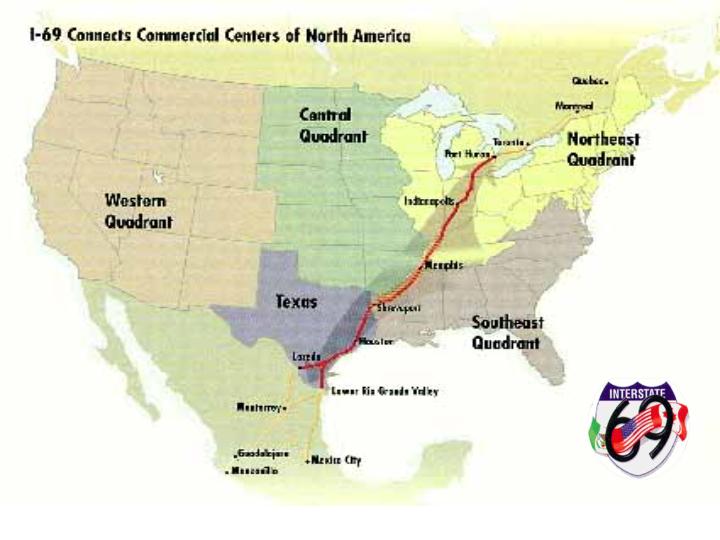
I-69 connector commercial center of north America
Slide 17:
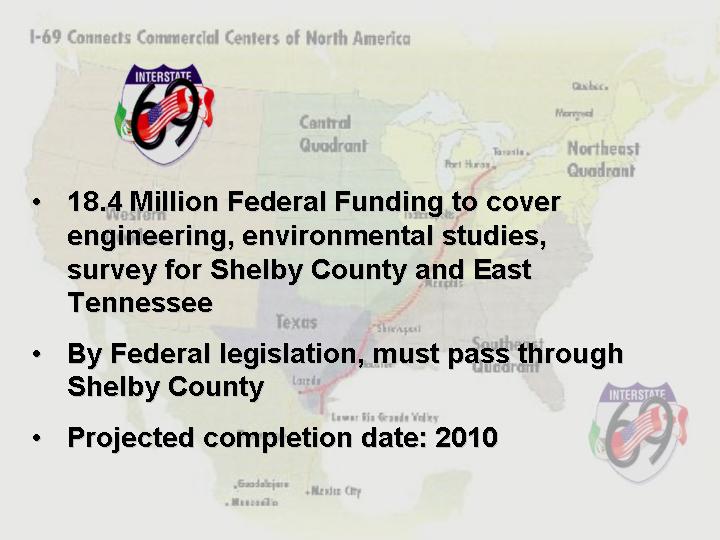
18.4 Million Federal Funding to cover engineering, environmental
studies, survey for Shelby County and East Tennessee
By Federal legislation, must pass through Shelby County
Projected completion date: 2010
Slide 18:
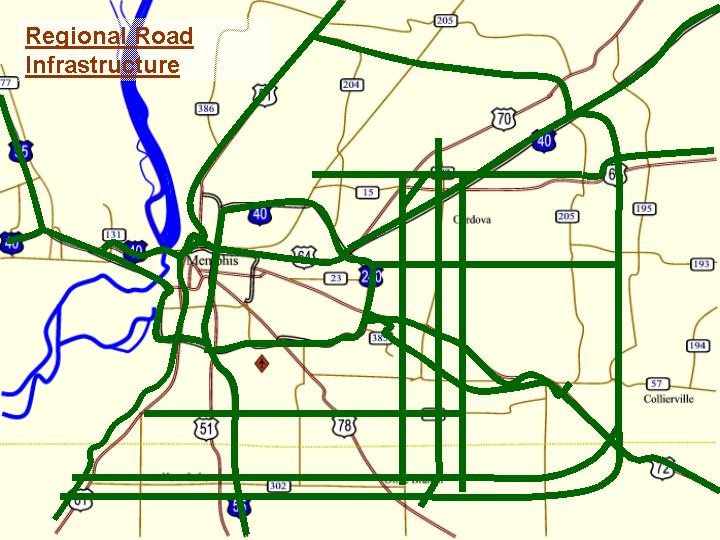
Regional Road Infrastructure
Slide 19:
Approximately 109 Route Miles around the Metro Memphis Area