| Skip
to content |
|
|
|
Welcome to Ramp MeteringSelect image below for the Ramp Metering Deployment Map
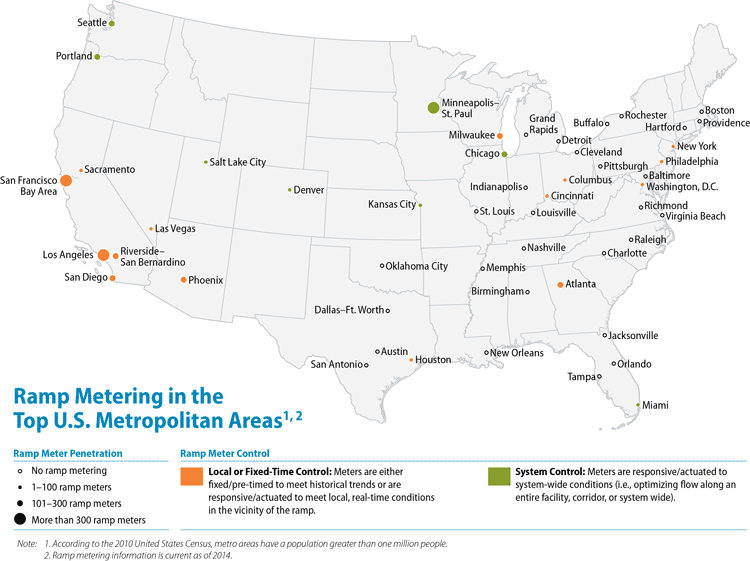
A map of the continental United States showing the ramp metering in the top U.S. metropolitan areas. It shows the ramp meter penetration, listed as either no ramp metering, 1 to 100 ramp meters, 101 to 300 ramp meters, or more than 300 ramp meters. It also shows the ramp meter control for each area that has ramp metering, listed as either local or fixed-time control, or system control. Areas of note are Minneapolis-Saint Paul, with more than 300 ramp meters with system control, and the San Francisco Bay Area and Los Angeles, both with over 300 ramp meters and local or fixed-time control. All other areas that have ramp metering have fewer than 300 ramp meters, and the majority of top U.S. metropolitan areas have no ramp metering.
Source: U.S. DOT. This web site is intended to support agencies and regions considering implementing, expanding, or improving ramp metering in their area. Through customized workshops, tools, guidance documents, resources, and peer exchanges, FHWA can assist with technical assistance and support to implement, expand, or improve ramp metering. Ramp Metering Goals and Benefits What's New
External Stakeholder ResourcesWeb Sites (Guidance, Evaluations, Research, Information)
Videos
You may need the Adobe® Reader® to view the PDFs on this page. |
||
|
United States Department of Transportation - Federal Highway Administration |
||