Orange County Integrated Regional Mobility - Smart District
b) Project Narrative
i. Project Description
1. Introduction
Caltrans District 12, Orange County, submits this grant application, on behalf of the region and its agencies, to the U.S. Department of Transportation (USDOT) Federal Highway Administration (FHWA) under the Advanced Transportation and Congestion Management Technologies Deployment (ATCMTD) program.
Central Orange County including City of Anaheim is a center of tourism hosting over 46 million visitors per year, who spend approximately $500 million on transpo1iation. In addition to the high volume of tourists visiting the Orange County/Anaheim region, the tourism industry employs approximately 157,000 people in Orange County accounting for a significant portion of the transportation-related activities in terms of commuting to and from the various workplaces.
Central Orange County, including City of Anaheim, experiences seasonal traffic pattern fluctuations due to a variety of impactful planned special events including tourists visiting the Disneyland Resort, Major League Baseball(MLB) games at Angel Stadium, and National Hockey League (NHL) games at the Honda Center. These facilities also host concerts and other ente1iainment events throughout the year. Orange County is also a popular destination for business conferences, often held at the Anaheim Convention Center. The resulting increase of traffic across the multi-modal transportation system creates severe congestion and mobility problems for local citizens, tourists, residents and businesses. This proposal presents a vision for an integrated regional mobility and special events management system that will promote an optimal load balancing and cross-agency coordination across the regional multi-modal network.
The Orange County Integrated Regional Mobility system will provide for deployment of innovative technologies and new demand management strategies for reducing the impacts of non-recurring congestion related to special events within the region. The Orange County Integrated Regional Mobility - Smart District project will incorporate advanced data fusion and analytics along with decision support technology, built for Caltrans by UC Berkeley/PATH (Partners for Advanced Transportation Technology) as part of the I-210 Integrated Corridor Management (ICM) project, to improve agency collaboration and coordination; provide a Mobility on Demand (MOD) application to include Orange County Transit Authority (OCTA) rail and bus services and to leverage the Anaheim Regional Transportation Intermodal Center (ARTIC) multimodal transportation hub; and provide a Smart Parking application to optimize parking within the City of Anaheim, helping to alleviate corridor congestion. Further technology will be deployed as part of a pilot for Connected Transit vehicles around the area of the ARTIC hub to help with transit safety and travel reliability.
Caltrans District 12 and its partners seek to enhance safety and mobility across the region through fulfillment of the following:
- Connecting the transportation agencies and service providers within the county and outside by deploying a districtwide Information Exchange Network enabling all agencies to share their real-time events, traffic conditions and cameras.
- Balancing multi-modal demand on major corridors within the project area, bounded by the I-5, SR-57 and SR-91 freeways, through active demand management to provide acceptable levels of service (LOS).
- Developing and deploying advanced analytics and business intelligence dashboards to monitor current conditions within the county.
- Deployment of integrated regional mobility solutions to provide enhanced mobility services including an integrated MOD application across all transportation services.
- Deployment of Smart Parking solution to provide optimized use of existing parking facilities and on-street parking within the City of Anaheim.
To achieve these goals and outcomes, our project efforts will focus on the following initiatives:
- Enhanced Data Collection, Fusion, Distribution and Archiving
- Development of a Data Fusion Environment to collect and fuse Traffic Signal information (Caltrans, Cities and County), Transit information (Orange County Transit Authority (OCTA)), Freeway (Caltrans D12), and Arterial (City and County) information
- Improve Incident Response to Incidents and Special Events in the Region
- Develop Integrated Corridor Management Strategies including multi-modal multi-agency response plans
- Implement the UC Berkeley/PATH developed Caltrans - Decision Support System to promote response plan coordination
- Expand Regional Smart Mobility
- Deploy a parking management system within the City of Anaheim with a focus around the special event venues (Disneyland Reso1i, Angel Stadium, Honda Center & Anaheim Convention Center).
- Implement the Decision Support System over the region and provide a performance measures application to ensure optimized operational level of service.
- Expand Regional Mobility as a Service offerings
- Integrate various mobility on demand services and implement a Mobile Application
- Leverage the existing ARTIC multi-modal transportation hub
The Orange County Integrated Regional Mobility project is envisioned as a showcase for the deployment of a multi-agency, multi-modal, Integrated Regional Mobility management system focused on the tourism, special event management and non-recurring congestion. Most, if not all, of the proposed initiatives will be repeatable and transferable to other urban regions of the State and Country which share similar issues and challenges.
2. Entity Entering the Agreement
2.1. Partners
Orange County Transit Authority (OCTA), City of Anaheim, City of Brea, City of Buena Park, City of Santa Ana, City of Tustin, City of Yorba Linda, Orange County Public Works, Southern California Association of Governments (SCAG), California Highway Patrol (CHP) Westminster, California Highway Patrol (CHP) Santa Ana
2.2. Management Approach
Caltrans will be responsible for the overall management of the Orange County Integrated Regional Mobility - Smart District. We will employ a range of standard project management techniques based on the Project Management Body of Knowledge (PMBOK) to effectively manage the range of activities and stakeholders required under this design build/on-call services contract.1 To facilitate the comprehensive and proactive management of the services to be executed, Caltrans will follow typical project management best practices and develop an overall Project Management Plan (PMP) to guide the delivery of the project. The PMP will be composed of multiple components that detail the execution, management, control, collaboration, and coordination required of the various tasks, and will be updated on a regular basis. These components include:
- Systems Engineering Management Plan — A living document that details Caltrans's process of the executing, managing, and controlling of the technical aspects throughout the lifecycle of the initiative.
- Concept of Operations — Documents the guidelines developed and agreed upon between agencies and partners.
- Work Breakdown Structure — A breakdown of the initiative into smaller components that organizes Caltrans's work into manageable tasks.
- Scope Management Plan — Defines the processes used to ensure that the tasks include all of the activities required to ensure successful delive1yof the task orders to Caltrans. It also defines how the scope will be defined, developed and verified.
- Schedule Management Plan — Defines the task order milestones, activities, deliverables and planned start and finish dates.
- Cost Management Plan — Details the processes for managing financial resources throughout the duration of the task to ensure that it is completed within budget. It is inclusive of all resources needed to complete the task including labor, equipment, and facilities.
- Risk Management Plan — Documents the anticipated risks, likelihood of occurrence, estimated impacts, and planned mitigation strategies.
- Resource Management Plan — Details approaches for allocating resources to the various tasks. At a minimum, this is inclusive of financial resources, inventory, human skills, production resources, and other resources such as information technology (IT).
- Communications Management Plan — Details what information is required to successfully deliver the tasks, who needs what information and when, format of the information, and who is responsible for disseminating the information.
- Quality Management Plan — Details the acceptable level of quality for each task order deliverable or product as defined by Caltrans, and how the quality standards will be ensured.
3. Geographic Area
Transportation within the County of Orange is affected by the neighboring districts of 7, 8 and 11. Within the County of Orange, there are 34 cities, one County, Caltrans D12 and OCTA sharing the responsibility of managing traffic and transportation. There are currently little to no integration of information or means of communications and cooperation among agencies.
Within the county, the ve1y heavily trafficked Triangle comprised of the I-5, SR-57 and SR-91 freeways are approximately 19 miles in length, and are ranked 8th, 11th, and 17th respectively, in the State of California in highest vehicle annual hours of delay in 2010. The Triangle adjoins the City of Anaheim centrally, although it is also adjacent to the neighboring cities of Buena Park, Orange, and Fullerton. This area was chosen because it was ranked #13 as the worst bottleneck in the United States at over 16 million hours of annual delay. Within the project area are four major event venues that frequently draw in even more traffic volume to the already congested network. These major venues include Disneyland, the Convention Center, Angel Stadium, and the Honda Center. When all four venues are active, the amount of visitors could be double the City's population. In 2014, Caltrans District 12 initiated an ICM project with the goal to update the freeway infrastructure for effective management of traffic congestion during planned and unplanned special events, manage availability of excess capacity along parallel arterials, and provide transit services within the corridors through system integration. The ICM project would address roughly 26.35% of the total congestion of corridors in the Triangle or 15.99% as it compares to the total corridors in the entire district. A distinct characteristic of the project area is the layout of the three corridors such that each corridor could readily provide alternate route guidance to any two other corridors to better manage traffic demand. This corridor management could only be accomplished through the cooperative management of Integrated Transportation Systems (ITS) and Connected Vehicle (CV) resources between the state and local agency.
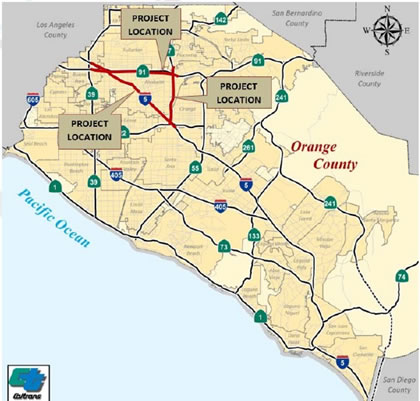
Figure 1: Project Location "Triangle"
4. Real-World Issues and Challenges
4.1. Lack of Integrated Transportation Management
Currently, traffic management is only conducted at the individual agency's jurisdictional level. For example, Caltrans' traffic are managed through the Traffic Management Center (TMC) in partnership with California Highway Patrol and other first responders. If a freeway traffic diversion onto City streets is required, the City manages the diverted traffic without the benefit of an Integrated Corridor Management strategy. There is no data on traffic condition on the local. There's no mechanism, institutional or technical, for an integrated approach to best serve a spillover traffic situation. The reasons for this are manifold:
- Incomplete and disconnected technological infrastructure systems
- Uncoordinated signal management strategy between multijurisdictional infrastructure
- Lack of communications to share real-time data and video
- Incompatible traffic control software at the TMC level except at spot locations
- Non-compliant traffic communications protocol that enables Center-to-Center (C2C) (Local to State) or Center-to-Field (C2F) (Local to field) control of devices and equipment, etc.
4.2. High Level of Corridor Congestion
The proposed project area is densely populated and home to major theme parks (Disneyland, Knott's Berry Farm, and others) as well as several other large event centers and tourist attractions that bring millions of visitors to the area each year. The three-targeted corridors ranked 8th, 11th, and 17th in the State of California in highest vehicle annual hours of delay in 2010. The project area was recently ranked #13 in the U.S. as the worst traffic bottleneck with over 16 million hours of annual delay. Currently, there is a very high level of congestion along the identified project corridors, which will worsen with the continued growth in demand and the infeasibility of expanding freeways and arterials.
4.3. Lengthy and Unreliable Trips
Travelers experience lengthy and extended commute times (unreliable trips).
4.4. Parking Availability
Most cities have sufficient parking inventory and based on the studies conducted for the City, Anaheim is no different. The issue is changing behavior of motorists so that they can find and use the parking inventory efficiently, in Anaheim, this may include directing motorists to off-street parking on and shuttling them to the attractions and special events freeing up valuable on-street parking for residents and merchants.
4.5. Insufficient Access to Multi-Modal Opportunities for Travelers
The project location within Orange County focuses on an area with record high tourism and is home to multiple venues for special events. Orange County in 2015 had 47 million visitors. The following elements are proposed to meet the needs of travelers.
- Mobility on Demand
- First mile, last mile
- Connectivity
- Park and ride
- Bike/Ped facilities
- Transit
- Real time information
- Automating processes
- Special events - traffic circulation optimization (including parking)
4.6. Vulnerability to Natural Disasters
Orange County is vulnerable to natural disasters including earthquakes and fires. These disasters would present significant additional transportation and traffic management challenges in an already strained system. In their 2015 earthquake forecast, the U.S. Geological Survey indicated that the Southern San Andreas Fault, which runs just east of Orange County continues to be the most likely site for a major 6.7 or bigger earthquake within the next 30 years.
5. Transportation Systems and Services
In order to meet the needs of developing a Smart District, an Integrated Management System will be developed and used as the core system to collect and store local and State data, disseminated information, manage the transportation network for the region and evaluate the need for actions. Figure 2 shows the anticipated high-level system architecture to be applied, where white elements are owned or provided by Caltrans, green elements are partner agencies to Caltrans and yellow elements will be provided by the project team.
The following list summarizes the transportation systems and services that are being proposed for this project. This list also details the purpose of the systems and services and the specific technologies being recommended for deployment.
Transportation data is collected and processed, and made available to the operators and public on various platforms. In that regard, our proposed system will:
- Collect, validate, translate, and fuse data from various data sources including; Caltrans, OCTA, City of Anaheim, other cities within the county and other local agencies as well as third party traffic data and weather information providers.
- Consolidate the data from all sources into one single, centralized database and make the data available to the operators through a multi-layered dynamic information exchange network for situational awareness.
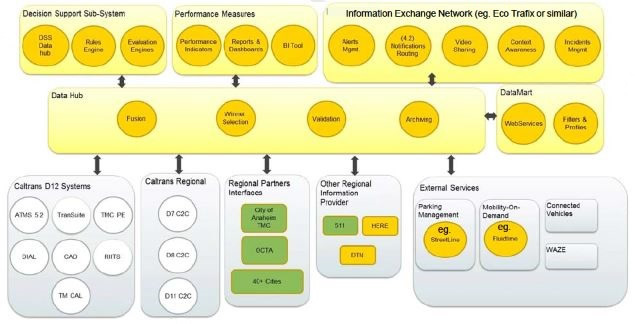
Figure 2: High Level System Architecture
- Share the fused data with headquarters and other project partners using a web services data mart for secure data dissemination and sharing.
- Implement a performance measures/performance management platform to dynamically monitor and operate the Smart District transportation network based on performance measures key performance indicators.
- Integrate with the University of California, Berkeley, California Partners for Advanced Transportation Technology, Decision Support System (DSS) application to provide an expert rules engine as a DSS implementation to assist project stakeholders with cooperatively responding to Triangle region incidents, congestion, and events.
- Provide parking management services from the Street line parking management software system and provide data to the data mart for dissemination to the Smart District partners.
- Provide connected vehicle technology to the Public Transportation System to help improve the Transit operations within the City of Anaheim area.
- Create safe, complete, door-to-door connections and travel ways to jobs, housing, educational opportunities, healthy communities, and more by integrating all mobility offerings into one common market-place using the Fluid Time Mobility On-Demand application.
5.1. Data Collection and Fusion Sub-System/Data Hub
The purpose of the Data Collection and Fusion (also called the Data Hub) sub-system is to facilitate the sharing of information from various data sources such as Caltrans, OCTA, City of Anaheim and other local agencies, real-time and static, in a common fo1mat to ease the transfer of data from external sources to the Data Hub. The Data Hub also receives data from multiple data connectors described in the next section of this document. As the data is made available from the source, the Data Hub will be responsible for collecting the data, validating the data for accuracy, translating the data into a common fo1mat recognizable by the Fusion platform, and fusing the data into a single database.
The Data Hub will provide the majority of the functionality needed for the data sharing within the project system boundaries. As the amount of data to be shared between the project systems and external sources is vast, the Data Hub will be one of the key components of the system required to deliver a successful Smart District implementation. The Data Hub is the data layer for the Smart District platform in simplest terms.
The main functionality of the Data Hub needed for a successful project implementation includes:
- The receipt of current status of devices, roadway and transit networks within the corridor.
- Provision of roadway link information to external systems to include link speeds, volumes, travel times, and weather conditions for the calculation of alternate routes and modes.
- Provision of incident, construction, and special event information to stake holder agencies and to external systems.
- The storing of inventory of ITS devices, network data, and device ownership for the transpo1tation network.
- The receipt and storing of pre-agreed upon incident response plans developed and approved by project stakeholders.
- The storage of a history of implementation of pre-agreed upon incident response plans and associated response plan activities provided in response to a plan activation.
- Provision of transit information to external systems to include routes, schedules, current location of transit vehicles for the calculation of alternate routes and modes. Provide an interface to the Smart District platform data fusion database, responsible for providing all of the data collected, fused, and stored in the system.
In short, the Data Hub will be the interface that is responsible for connecting the internal components of the Smart District platform with the external sources that provide the real-time transportation information originating from the field, including Automated Transportation Man. Sys (ATMS) systems, traffic signal systems, weather systems, Caltrans Performance Measurement System (PEMS) Data Source and the like.
5.1.1. External System Data Connectors
External system data connectors represent external software components and their respective interaction within the Smart District system. There are several external data connectors required to be integrated with the Smart District system. Whenever possible, standard data formatting, such as Traffic Management Data Dictionary (TMDD), should be used to facilitate the ease of data sharing between a provider and subscriber. These data connectors are divided into three types of interfaces:
- Data providers: Provide data to the Smart District system; these data interfaces are dictated by the provider and the System must include an interface developed to meet the process, protocols, and formats of the provider. The provider must have an associated schema or data definition for the Smart District system to follow.
- Data subscribers: Receive data from the Smart District system; these data interfaces are dictated by the System and the provider must develop their interface to meet the process, protocols, and formats developed by the System. The Smart District system must provide the subscriber an associated schema or data definition.
- Data providers/subscribers (bi-directional): Receive data and provides data to the Smart District system; interfaces that are typically bi-directional include Center-to-Center interfaces, which typically have defined processes, protocols, and formats for data subscriber and data publishing.
5.1.1.1. Caltrans Data Connector
An interface to the Caltrans District 12 ATMS and other systems for various data sources (network, devices, event, etc.) will be developed to request the real-time data and integrate it into the Information Exchange Network (IEN) (e.g. EcoTrafiX or similar) system and ultimately the various dissemination mechanisms such as the Data Mart Web Services. Besides the ATMS 6 system that is currently being used by District 12 and that will provide volume, speed, DMS, CCTV, operator generated messages, and travel time data, the DIs will be built for the following other Caltrans D12 systems:
- Signal Systems — Transcore — Transuite system
- TMC performance measures system
- DIAL — For event management
- TM CAL — Event entry system
- TM CAD — Statewide police CAD system.
It is anticipated that the system will also have a data connector that will connect to the Center-to-Center data feeds from the surrounding districts to provide awareness along the borders of Orange County. These Districts are D7, D8 and Dl1.
An interface to the OCTA General Transit Feed Specification (GTFS) data will be developed to request and receive static rail and bus transit data and integrate it into the IEN system and ultimately the various dissemination mechanisms such as the Data Mart Web Services. OCTA provides bus and MetroLink rail service in the region, and is used as an alternate mode during times of special events and major incidents. As a partner, OCTA can utilize the IEN event management module to assist with operations during a major special event or incident, and the event data can be shared via the Data Mart with consumers such as the DSS Data Hub to evaluate and recommend relevant transit related response plans where necessary.
5.1.1.3. City of Anaheim Data Connector
An interface to the City of Anaheim traffic management center for all data sources available (network, devices, event, etc.) will be developed to request the real-time data and integrate it into the IEN system and ultimately the various dissemination mechanisms such as the Data Mart Web Services. The data provided by the City of Anaheim will provide the situational awareness along the arterials within the Triangle area. A key part of this information will be the current status of the signalized intersection, allowing the system to determine what devices are available when implementing response plans. The signal control data interface developed for the City of Anaheim TMC data will further be used to connect all available and connected signals within the region to the IEN as described in 5.1.1.6.
As a part of this project, a HERE - real time traffic data connector will be developed to consume link speed and travel time data from the HERE web services. HERE data can be used to provide real-time and historical traffic data on the highways and arterials in the project region. All HERE data will also be fused and shared via the Data Mart Web Services to internal sub-systems, as well as with the DSS Data Hub to assist with real-time condition evaluation and response plan recommendations. In addition, the link speed and travel time data collected from HERE will be disseminated via the performance measures dashboards for data analysis. The evaluation and analysis of historical data can be crucial in planning strategies for upcoming special events, used to help ease congestion based on past performance.
5.1.1.5 PATH DSS Data Connector
The PATH Decision Support System (DSS) data connector will be developed to facilitate the consuming of DSS response plan recommendations from the PATH Data Hub. As the data is collected from the Smart District Data Hub via the Data Mart Web Services discussed below, the PATH DSS Data Hub will evaluate the current situation and make response plan recommendations for the Triangle Region for implementation in the IEN Graphical User Interface (GUI) (also discussed below in section 5.1.7). The PATH DSS Data Connector will be responsible for collecting the response plan recommendations from the PATH DSS to provide in the IEN GUI for operators to implement the plan.
5.1.1.6. Traffic Signals Data Connector
For this project, a National Transportation Communications for Intelligent Transportation System Protocol (NTCIP) based Data Connector will be developed between the signal system(s) and the IEN platform. Status data from the Traffic Signal system(s) will be shared via the Data Mart Web Services and can be used for evaluation within the DSS for response plan recommendations, as well as allow signal plan and intersection state information to be considered as part of the real-time model. Recommended signal timing plans can be activated as part of selected strategies in response to major events.
A Waze Data Connector will be developed and will be responsible for polling the Waze feed, consuming the feed response in Extensible Markup Language (XML) format (both XML and JavaScript Object Notation (JSON) formats are available for consumption), and converting the traffic alert and jam information into events that will be stored in the Data Hub data fusion platform database. In parallel, a list of roadways and intersections will be built that will be used to geo-locate the individual alert and jam events that will be created within the system. If needed, a cross reference (translation) table will be created that will map the roadways and intersections provided by Waze to the system's static roadway network so that events can be properly geo-located on the IEN maps and associated correctly with the IEN underlying static roadway network. In addition, a cross reference table will also be created to map the Waze event types and sub-types with IEN and Caltrans event types and sub-types that are stored in the local data repositories. As the traffic information that is made available by Waze is crowd-sourced information, Waze provides a reliability index (from 0-10) and user rating (from 1-6) along with the information that is shared in the feed. Caltrans will work to identify acceptable values with which to allow for event creation within the IEN system. These values will also be configurable in order to allow for future modification if needed.
5.1.1.8. Smart Detection System Connector
Common Language Runtime (CLR) Analytics is working in collaboration with the University of California in Irvine (UCI) in developing a smart detection system. They propose converting the existing vehicle detection stations (i.e., loops, tubes, video imaging and ITS counting stations) into classification stations. The data output from CLR Analytics include; vehicle count, speed, weight, type (by classification), emissions, tracking and turning movements. The resultant data is captured in real time allowing adaptive ramp metering, queue management, parking management and vehicle miles traveled. The proposed system is compatible with existing detection hardware providing efficient and flexible solution based on big data analytics.
5.1.2. Information Exchange Network (IEN)/ Graphic User Interchange (GUI)
Information Exchange Network and ICM solution, is proposed to manage the District's transportation networks by connecting all stakeholders and maintaining situation awareness in the project region. Figure 3 below shows a sample of the GUI.
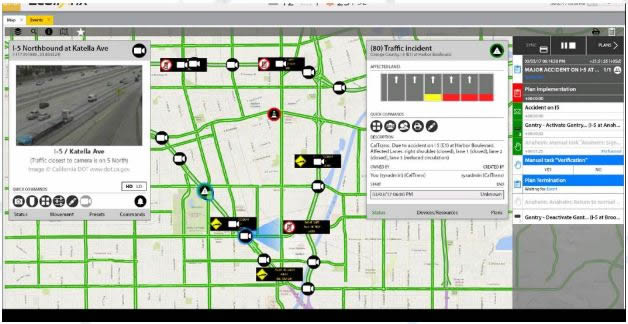
Figure 3: ExoTrafix GUI
The GUI offers the opportunity to actively participate in travel time reduction, traveler safety improvements and CO2 emissions reductions. By gathering traffic data into a real-time dynamic visualization approach, agencies can now optimize and improve traffic using data-driven decision support for proactive response to incidents and events.
The GUI will:
- Enable the Orange County District and its partner agencies to move ahead of traffic congestion, increase their situational intelligence and improve resiliency to disruptions.
- Increase infrastructure safety by providing best situation awareness and event lifecycle management.
- Accelerate District 12's sustainability, quality of life, meeting regulatory targets and maximizing user mobility and satisfaction.
5.1.2.1. Situational Awareness for Informed Decisions
Traffic conditions are monitored continually, feeding dynamic map displays and also level of service algorithms to detect anomalies. Field devices and equipment are continuously monitored for status and real-time data. The GUI will capture, aggregate, and archive all data, status and alarms, help operators and managers to view, analyze and maintain situation awareness in a common operational view.
Our solution is hardware and device agnostic, meaning there are no dependencies on a particular make or model of ITS device; all types of devices can be integrated for monitoring command and control. This wide range of device integration capabilities allow highly flexible and modular evolution of installed systems to add newer features, updated devices and subsystems with no dependence on a particular brand or model. This allows the customer, to focus on their data and services in a "normalized" way. The customer will never lose the ability to integrate a new traffic device, equipment or sub-system in the future.
5.1.3. Data Mart Web Services
The Data Mart Web Services are an integral part of the Smart District project, allowing for easy dissemination of collected and fused data to Headquarters and project partner agencies. Fused data will be made available to project partners and third-party application developers through a Data Mart. Information will be published to various data consumers via numerous transportation methods, most notably XML web services. The high impact, real-time traffic, transportation, weather and ITS device static and dynamic information will be shared with various data consumers, including the public, private agencies and social media outlets and third-party application developers.
With the use and availability of the web services, the proposed decision support system for the project area Triangle, and other project consumers can use their simulation models and/or notification mechanisms in order to predict roadway situations and recommend alternate routes in response to a possible adverse condition.
Providing an efficient, secure, and performance mechanism to ensure the accuracy and reliability of the sharing of very large sets of data among various systems and platforms an integral part of a successful Smart District deployment. Therefore, the Data Mart Web Services will serve as a key dissemination mechanism responsible for providing the sharing of data among the County and its partner agencies, thereby helping to improve data sharing in the District and its surrounding regions and partners.
5.1.4. Performance Measures/Performance Management Dashboards
Perfo1mance measures are recognized as an important element of all Regional mobility management systems. TMC operations managers and operators have a responsibility to know how, when, and where to institute a wide range of strategies. These changes cannot be sensibly implemented without knowledge of the appropriate information upon which they are based. The IEN performance measures module will be deployed to provide both output and outcome based performance measures for the District. The IEN performance measures module will allow the operations organizations to visually inspect the real-time operation of the transportation networks in the District. The software will allow each agency and user to configure the graphic depictions, reports, and measures used by the system for their purposes. The performance measures will provide District 12 and its partners with a real-time indicator of how the network is performing versus historical performance.
5.1.5. Decision Support System
Caltrans' connected corridors program has invested in developing a statewide data management and decision support systems applications for use in ICM implementations as part of the I-210 ICM pilot project. The use of these systems will reduce both the overall implementation costs and schedule risks of the District 12 ICM project.
As a member of our team, PATH will provide us with installation and training services for the cloud based data hub and will work with us on planning the use of both the document and streaming data processing paths. PATH will also assist us with installation and training services related to the rules based decision support system. This support will include assistance with modification of existing rule templates for use in District 12.
The DSS envision as part of the Smart District will be composed of three core elements:
- The Data Hub
- Expert rules engine/evaluations
- Response plan database
The operational concept for this DSS application are shown in Figure 4
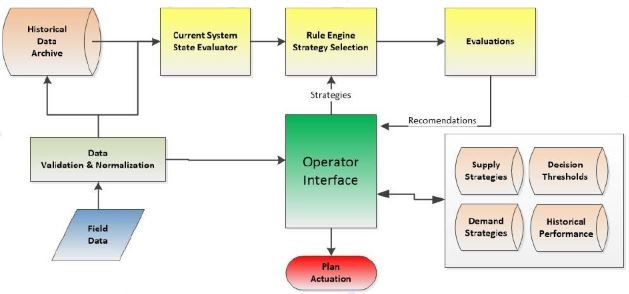
Figure 4: DSS Operational Concept
System operations start with a need to collect comprehensive and reliable information about how individual elements are operating. This need includes collecting information from traffic sensors, control devices, probe vehicles, transit monitoring systems, parking monitoring systems, and user-generated data through mobile applications and social networks on a 24-hour/7-day-a-week basis. Information about active incidents, weather, construction and maintenance schedules, and other planned events may also be collected. All collected data must be validated prior to being used to ensure no erroneous information is used in system evaluations. Data processing may also involve the application of data fusion algorithms designed to address potential discrepancies among data collected from various sources and gaps in collected data. The DSS data hub will connect to the overall data hub to gather the relevant information source to be provided by the Data Interfaces and the Data Hub.
5.1.5.2. Expert Rules Engine/Evaluations
In order evaluate the network and to manage given events and incidents within District 12 an Expert Rules Engine will be applied. At every evaluation cycle, available management strategies would be evaluated by the Expert Rules Engine to determine their effectiveness in addressing the identified operational problems. Only the strategies that can physically be implemented would be evaluated. The system evaluations would be done by drawing strategies from rules or playbooks describing potential supply-side and demand management solutions. The DSS rules engine would be designed to operate in a real-time environment using the current conditions for plan evaluation. It would use various processes and analytics to evaluate current system operations, determine the near-term impacts of individual strategies or groups of strategies, and provide recommendations on which strategies to implement. Depending on system setup and capabilities, these evaluations could be conducted every 5, 10, or 15 minutes.
5.1.5.3. Response Plan Database
The response plan database will be a combination of supply strategies elements and demand strategies elements that will be used to build the response plans using the PATH selected engine, that will use either a data base of elements or a playbook of complete response plans to generate or select the plan to be implemented by the system. These strategies will be developed as part of the system plan phase and entered within the database. As the system collects information the historical performance of the response plans will be collected to use in future evaluations of the response plans by the Expert Rules Engine.
5.1.6. Parking Management
Smart Parking involves a fully integrated parking ecosystem that benefits residents, visitors, merchants, and the City. To accomplish this, it is critical that parking is viewed holistically to include on street metered and non-metered spaces, city-owned off-street parking, as well as private parking supply that is available to the public.
Smart Parking includes not only sensors, but also and more importantly a change in the way parking is under stood, managed, and interacts with stakeholders. It gathers real-time data about parking occupancy and payment status. Analytics use these new sources of data to empower city leaders to improve policy and pricing based on real information about supply and demand and enforce that policy more effectively. A Smart Parking system communicates real time information to drivers so that they can make better decisions, locate parking quickly, and pay using modem technology, improving compliance and optimizing the utilization of parking assets.
In meeting the needs of parking management, an application similar to Streetline will be used. These applications provide the tools necessary for the city to optimize existing parking inventory and as a result, the city can realize the following key benefits:
- Increase commerce and sales tax revenue by drawing motorists to a city where parking can be more easily located and found more quickly.
- Increase meter revenue.
- Changing the behavior of motorists.
- Avoid the expense of constructing new parking structures.
Parking management analytics and historic data can now accurately determine parking occupancy of each block face with only one sensor in each block face. For example, the Streetline Hybrid Platform can generate 90% accuracy in 60 days using only one sensor per block face and powerful analytics.
The above sensing strategy to be implemented for the City of Anaheim is the foundation of a new approach to Smart Parking called The Hybrid Platform. The Hybrid Platform is comprised of the following three components:
- Hybrid smart parking data capture
- Analytics engine
- Mobile and web applications for the City, its merchants, residents and visitors.
5.1.6.1. Hybrid Smart Parking Data Capture similar to Streetline
To create the most accurate and most comprehensive parking occupancy data, the Hybrid smart parking first captures data with three sensing devices: in-pavement sensors; cameras overhead; and smart phone. Then expands the quality and quantity of total data by leveraging existing data sources for other sensors, parking payment, LPR, gates, and other data that is relevant to parking occupancy. The Hybrid also gathers all parking prices and policies as part of the solution installation. Figure 5 provides a high-level view of the typical data inputs to the hybrid platform.
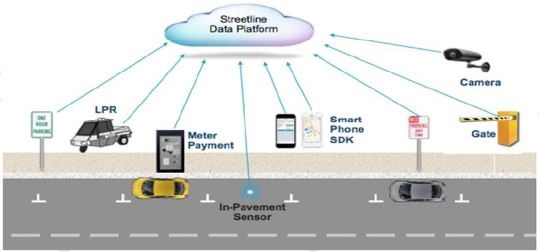
Figure 5: Streetline Hybrid Platform Data Inputs
5.1.6.2. Analytics Engine similar to Streetline
The analytics engine is a machine-learning analytics engine hosted on secure server infrastructure that ingests and combines the above data sources to provide real time consumer guidance in addition to occupancy analytics. The use of the single sensor per block face provides the analytics engine with the ability to continuously adapt to the quality and prevalence of additional data sources, all the while providing best in class consumer guidance and analytics.
5.1.6.3. Mobile and Web Applications for the City, its Merchants, Residents and Visitors
Utilizing the occupancy demand data generated by the hybrid platfo1m, the city can access a range of mobile, web and Application program interface (API) tools for the city to obtain a city-wide view of occupancy demand, optimize curbside utilization, make info1med policy decisions and provide real-time guidance to available parking spaces.
As part of this project the application will provide the City of Anaheim with all the sensor, gateway, and repeater hardware infrastructure, planning and installation services, professional analytic consulting services, Software as a Service (SaaS) analytics, and maintenance and on-going support of the complete hybrid platform for a duration of three years to the City of Anaheim for the coverage of 200 metered and unmetered contiguous block-faces.
5.1.7. Connected Vehicle Technology
Transit signal priority is probably one of the important factors to encourage modal shifts from single occupancy vehicles to mass transit. Within the industry, several technologies are existing to allow a transit vehicle to request preferential treatment at signalized intersections. Additionally, different factors such as minimum number of passengers or being a minimum number of minutes behind schedule are used to dete1mine whether a transit vehicle should be given priority at an intersection. Lastly, the method of requesting preferential treatment by a traffic signal controller can also vary, i.e., vehicles can directly communicate with a traffic signal controller or can first send the request to a transit management central system, which determines that the request is valid, then send this request to the central system that controls the signal controllers, and from there to the appropriate signal controller. In this context, it needs to be noted that most of these TSP technologies are single purpose technologies, i.e., they can be used for transit signal priority only.
Connected Vehicle technologies also offer the capability to provide preferential treatment, but simultaneously offer the possibility and capability to use the same on-board units and/or roadside units for different purposes, such as red-light violation warnings or weather warnings or work zone warnings - all besides enabling TSP.
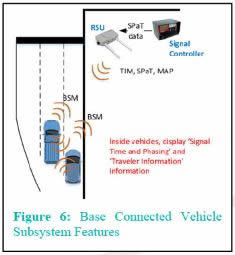
To demonstrate this capability, the OCTA is proposing to install a Connected Vehicle subsystem, which will include twenty transit vehicles with on-board units (OBUs) traversing a specific corridor. Along the corridor, signalized intersections will be equipped with ten CV-compatible roadside units (RSUs). The proposed features to be accomplished by the Connected Vehicle subsystem are:
Broadcasting of Signal Phasing and Timing (SPaT) and geographic layout of signalized intersections (MAP) messages to provide equipped vehicles (passenger and transit vehicles) with information about the downstream traffic signals including green and red time remaining.
Collecting detailed location, speed, and heading information from equipped vehicles (Basic Safety Message [BSM] data).
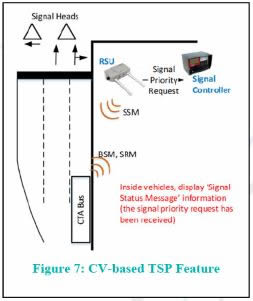
Broadcast transit signal priority request messages (SRM) from equipped transit vehicles to signalized intersections and receiving signal status messages (SSMs) as acknowledgment. This TSP feature would be deployed to evaluate a V2x-based transit system against the existing, single-purpose TSP system.
For its CV applications and project architecture development, the project will use the Connected Vehicle Reference Implementation Architecture (CVRIA), which provides a definition and typical Physical, Logical, and Communications Diagrams for each CV application, (http://local.iteris.com/cvria/).
During the Concept of Operations development within the Planning Phase of this project, the transit signal priority route, the exact location of the roadside devices, and the to-be-equipped vehicles will be determined.
5.1.8. Mobility on Demand (MOD)
The City of Anaheim is a center of tourism with nearly 46.1 million visitors per year who spend about $500 million on transportation (https://visitanaheim.org/plan/plan-your-trip). Besides tourists visiting the Anaheim region, the tourism industry employs about 157,000 people in Orange County accounting for another big portion of the travel activities in terms of commuting to and from the various workplaces.
Figure 8 shows that an efficient integrated transportation network and high-quality mobility offerings are key to ensure further economic growth of the region. In cases where transportation modes are not being connected and transit offerings are not being fully utilized due to first-last mile restrictions, costs might exceed budgets and the travel experience might be lacking.
The proposed MOD solution similar to Fluidtime contributes to reducing transportation issues that urban regions face due to increased travel demand, and where investing in further infrastructure is limited. It brings the various offerings from different transport modes into one common platform providing intermodal information, booking as well as ticketing thus giving travelers and tourists easy access and high quality seamless journey experiences.
The MOD solution is based on a software as a service system with a modular set of components with the objective to make transportation systems easily accessible for the traveler and more efficient for the operators. The MOD is a multimodal integration system, connecting various publicly accessible transportation modes providing a personalized mobility service via smartphone apps.
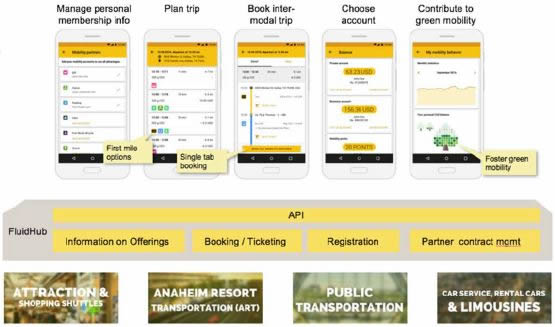
Figure 8: FluidHub Connects Mobility Offerings and Provides Users a Seamless Travel Experience
The proposed system allows the smart integration via intelligent linking of different mobility services like:
- Individual transport
- Public transport and shuttle services (including demand responsive transpor1t)
- Car and bike sharing and rental services
- Limousine and taxi services, while:
- Considering real-time data during route planning
- Supporting backend and management services
- Providing external and internal channels for news, incidents and events, etc.
As part of this offering, smartphone apps for Android and iOS as well as a responsive Web-Apps will be provided. The smartphone apps are developed natively to ensure high performance, availability of newest software features as well as to ensure the best user experience. These applications will be provided via the respective App stores.
To improve the overall transport system and especially mitigate the first-last mile problem, the Hub supports the dynamic linking of public-transport and demand-responsive offerings including taxi services.
The MOD will add the various publicly available transportation offerings to the Hub service infrastructure allowing the District to provide a smart-phone app based service to travelers that will provide them information on all available transport modes, buy tickets and book on-demand services, as well as have easy access to the booked offerings.
The successful deployment of the MOD solutions requires technical data connections (APIs) to the available transport operator IT systems to retrieve dynamic information on availability, to register with and to book selected transport modes. The integration of the Hub solution with a backend accounting system is not part of this proposal. Nevertheless, after a detailed technical analysis, a connection to an accounting system can be offered and implemented.
6. Deployment Plan
This section describes some of the high-level tasks and considerations that will be addressed during the deployment of the District management system.
6.1. Deployment Sequencing
It is expected that the deployment of the components/subsystems of the solution to be deployed in a logical and consistent manner. Based on the Systems Integration experience of Caltrans team, we expect the Solutions described in Section 5 to be deployed in the following order, and shown in the Figure 9 below.
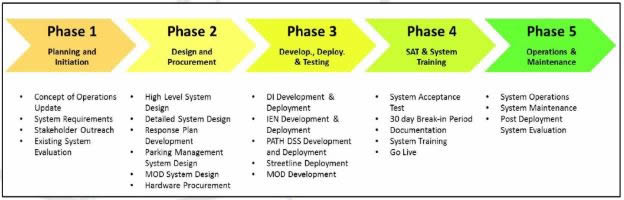
Figure 9: Deployment Phasing
6.1.1. Phase I - Initiation and Planning
Phase one will include the planning stages of the project. During the stage, the details from the external systems and any design document such as the triangle area ICM Concept of operations document will be collected and the overall system architecture will be review for consistency in the project. Also, during the initial phase the team will work with all the stakeholders to ensure that the goals of the project are still being meet by the proposed solution. The Planning stages will also include the initial evaluation of the pre-deployment system conditions to be used as part of the final evaluation of the system. This work to be done by the University of California, Irvine will allow for the final system benefits to be calculated after the go-live and during the operations and maintenance.
6.1.2. Phase II Design and Procurement
Phase II will include the development of both the high level and detailed designs, as well as the integration and implementation plans for the system. In parallel the development data interfaces outlined in section 5.1.1 will be started for the Caltrans systems. The Response Plan development will be started, and the rules engine will be created based on the findings from the stakeholders' meetings as part of Phase I. Based on the detailed design the procurement process for the hardware and software required for the project will be started. This phase will also include the design of the Parking Management System, the Mobility-On-Demand system and the Connected Vehicle Pilot.
6.1.3. Phase III Development, Deployment and Testing
Phase III will focus of the development and deployment of the system as documented in the detailed design in Phase II. This development will also include the configuration of the PATH based DSS rules engine and DSS data base, the implementation of the IEN and the deployment of the 3 external services. Initial testing and systems training will be conducted as part of the phase III deployment, completing with the go live and documentation of the system.
6.1.4. Phase IV Systems Acceptance Testing
Phase IV will provide the final acceptance testing of the Smart District System as well as any required factory acceptance testing of installed hardware. Following the successful testing of the systems final documentation will be developed and the system will be live.
6.1.5. Phase V Operations and Maintenance
Following the acceptance of the system, will be a 24-month operations and maintenance phase. It is anticipated that Caltrans will be tasked to operate and maintain the systems that are deployed within their jurisdiction and/or systems. The team will examine areas where it may be necessary for specific vendors to operate and maintain their systems for at least a start-up/shake down period. Caltrans and the regional partners will work to ensure that any needed O&M funds are programmed onto the TIP when this project advances beyond the initial four-year period.
7. Regulatory, Legislative, or Institutional Challenges
The hurdle facing the proposed project is the institutional challenge of integrating infrastructure between agencies with different cultures and operating philosophies. For instance, there might be instances where Caltrans' objectives (e.g., rerouting freeway off-ramp traffic) and the City's objectives (e.g., coordinating traffic signals) could differ. The partners intend to address the challenges by launching the project with the development of the aforementioned Concept of Operations (Con Ops) document. This high-level planning document will outline common goals, expected benefits, partner-specific objectives, and other potential conflicts (e.g., interagency TMC operations, relinquishment of certain right of way, maintenance, future expansion, IT security and the use of equipment and devices for the overall benefit of the ICM). The partners anticipate that the Con Ops will address potential conflicting objectives and ensure that the partners' expectations are aligned. Thus, the key is to cooperatively develop and agree to a high level Con Ops that considers the overall goal of the entire project over the benefit of any single partner.
8. System Performance Improvement
System performance is a result of the various projects that support the goals of the study. The following system performance improvements are expected because of the project elements identified in the proposal and the partners anticipate the following performance improvements as a result:
- Traffic congestion will be reduced: With improvements in traffic monitoring, measured as vehicle hours of delay, because traffic managers will be able to detect and respond to traffic incidents more quickly, which will allow needed resources to be allocated more efficiently.
- System efficiency will be improved: With the addition of a new IEN GUI to provide situation awareness. Partner operators will have access to a new graphical user interface that will allow them to be in constant control of the current situation within their transportation networks.
- Improved interagency collaboration: With the addition of the aforementioned IEN GUI to allow agencies to coordinate and collaborate and implement inter-agency strategies to resolve issues due to congestion quickly and efficiently.
- Access to transportation services will be improved: With the addition of a new multi-modal trip planner, Smart Parking, and Mobility on Demand services. Commuters and travelers will have access to newly developed services that will provide highly beneficial information that will allow and encourage the use of mass transit and other modes of transportation.
- Measured improvements in incident response performance measures: By gathering traffic data into a real-time dynamic visualization approach, the District will be able to optimize and improve traffic using data-driven decision support for proactive response to incidents & events. The County and its partner agencies will see significant performance improvements for event management and response, including alarm and incident detection, and the status of action/response plans. This means that working with partner agencies, collaborative, proactive traffic management is now possible allowing for greater speed in event clearance, traffic mitigation and recovery, including the potential to modify construction schedules in the event traffic conditions warrant a change to pre-authorized lane closures.
- Measured improvements trip reliability measures: ICM implementation on key corridors will result in improved trip reliability for both automobile and transit travelers. Improved situational awareness from the ICM system, coordinated response plans enabled by the DSS, actionable information will lead to travel times becoming more reliable (as measured by travel reliability indicators, buffer, planning time indices for car and transit schedule adherence.)
- Measured improvements in overall traveler safety: Safety performance measures to evaluate the safety benefits to the District and surrounding areas, including overall crash rate, fatality and injury rates will be analyzed. Indirect measures including vehicle speeds, speed variability, the number of traffic violations, percentage reduction in rescue response time and public perceptions will also be considered.
9. Safety, Mobility, and Environmental Benefits
Based on the expected system performance measurements the following key outcome performance indicators are identified for our project. These measures will be further defined as part of the evaluation task along with the data collection and management approach. Other input and output related performance measures will also be defined. For example, the team will assess the improvements to situational awareness, the use of the DSS and the effectiveness of the mobility applications that are proposed as part of the pilot. However, measures of effectiveness for input and outputs are not presented in the table below due to page limit restrictions.
10. Vision, Goals, and Objectives
Vision:
- Create a system management culture.
- Have a performance based framework for all TMS work activities and funding prioritization; Establish a well maintained and high performing TMS infrastructure that supports real time traffic management.
- Cooperatively develop and implement real-time (active) traffic management to optimize flow, safety, and aid regions and the State to meet greenhouse gas (GHG) reduction targets from transportation.
- Renew consensus on and adhere to critical statewide standards.
Goals:
- Increase corridor throughput.
- Improve travel time reliability.
- Improved incident management.
- Enable intermodal travel decisions.
Objectives:
- Increase accessibility to various modes of transportation (empower and assist traveling public in making informed decisions.
- Identify real-time available alternatives for route and travel mode diversion along the corridor.
- Improve travel time reliability for all modes, including arterial travel times and sharing with partners.
- Prioritize non-recurring congestion.
- Leverage modern Decision Support tools to maximize operator's efficiency.
- Implement a complete route diversion strategy using parallel frontage roads, strategic arterials, and mass transit.
- Provide advanced traveler data.
- Pre-trip or while en route with complete multi-modal trip builder.
- Allow travelers to mode shift en route.
- Create a demonstration project that is replicable to other Orange County agencies in order to bring ICM county-wide. The Orange County Integrated Regional Mobility - Smart District project will be the first phase of a much larger overall county ICM deployment. It is envisioned that the Orange County Integrated Regional Mobility - Smart District project will result in a deployment "roadmap" that will enable other public and private agencies to join the ICM project. The roadmap will enable future partners to identify how they will connect to the ICM framework by providing concrete examples of shared operational philosophies, communications methods, ITS infrastructure requirements, etc. Future ICM intertie is achieved in two stages. The first stage, when covered in the project deployment, is to create a secure and reliable fiber optic communication infrastructure within the ICM Triangle portion with ICM intertie hubs to accommodate future partners. The fiber optic work within the ICM Triangle would include three new communication hubs that would serve as ICM intertie at Harbor/SR-91 freeway, State College/SR-57 freeway and Orangewood/SR-57 freeway. The intertie hubs on Harbor Blvd. would serve as a connection point to Caltrans for cities of Anaheim and Fullerton, on State College Blvd. as connection point for cities of Fullerton and Placentia, and on Orangewood Ave. for cities of Anaheim and Orange. See Figure 2 for the fiber communications vision in the ICM Triangle. Building from the ICM Triangle infrastructure, the second stage is to extend the fiber communication network beyond this area to accommodate other public and private partners in Orange County. The vision is to link the agencies and partners in order to cooperatively manage the entire corridor with a consistent ICM goal. Future infrastructure on strategic ICM arterials will be repaired and retrofitted with a secure and robust network just like the ICM Triangle project and provide for additional intertie hubs so that future partners could join the Orange County ICM initiative.
11. Partnership Plan
The following are the list of private partners associated with this proposal:
- Kapsch TrafficCom Transportation (KTT) System Integrator, Deployment of O&M, and Connected Vehicle.
- Streetline — Developer of real-time parking management applications.
- Fluidtime — Provider of MOD solutions that are based on a Software as a Service system with a modular set of components with the objective to make transportation systems easily accessible for the traveler and more efficient for the operators.
- DTN — Integrator of real-time weather sources of data to provide real-time forecasting weather conditions and weather alerts, which are critical during special events and Hurricane Evacuation.
- HERE Provider of real-time travel time and speed data on the roadway facilities.
- WAZE — Utilized in a Caltrans agreement to access real-time data on facilities within the county.
- PATH — University of California Berkeley, Partner with Caltrans to provide DSS and Fusion Engine.
- University of California, Irvine — UCI to provide traffic data including volumes, speed, and vehicle type classification.
*The products identified in this grant were used only for the purpose of pricing the presented concept.
12. Leverage Existing Investments
Caltrans District 12 is in a unique position to leverage its existing investments in developing an advanced transportation and congestion management technology deployment.
The District has an existing network of ITS elements to include Closed Circuit Television Cameras, Dynamic Message Signs, Ramp Metering and Traffic Monitoring System stations, Traffic Signals, and a very complete fiber optic field communication network. In addition, the District has received funding in the amount of $35M to add additional ITS infrastructure over and above the existing systems mentioned.
A very refined network of ITS elements in the neighboring cities in and around the triangle region allows for the possibility of integration to local agencies for better management and transport of services, people and goods along the freeway and local arterial roadways.
The Anaheim Regional Transportation Intermodal Center provides rail, bus, taxi and other services for daily commuters, visitors and leisure travelers. It serves as a train station for Amtrak intercity rail and Metrolink commuter rail, as well as a bus station used by the Orange County Transportation Authority, Anaheim Resort Transportation, Greyhound, and Megabus.
Systems used to connect facilities like ARTIC with the existing ITS infrastructures mentioned above can effectively address some of the real-world issues and challenges such as corridor congestion, lengthy and unreliable trips, and insufficient access to multi-modal opportunities for travelers.
13. Schedule
We are proposing a 3-year schedule, with a 24-month planning/design/build phase followed by a 12-month Operations and Maintenance phase. Figure 10 shows the proposed 36-month schedule for the 5 phases of the project.
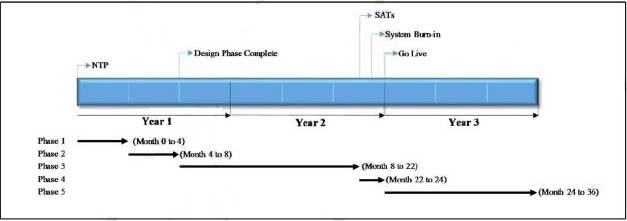
Figure 10: 36 month proposed schedule.
14. Support of USDOT ITS Initiatives
The new ITS Strategic Plan for 2015-2019 outlines the direction and goals of the Department's ITS Program and provides a framework around which the ITS Joint Program Office and other Department agencies will conduct research as well as development, and the adoption activities to achieve these. The ITS Strategic Plan's framework is built around two key ITS Program priorities: realizing connected vehicle implementation and advancing automation.
- Realizing Connected Vehicle Implementation: Builds on the substantial progress made in recent years around design, testing, and planning for deployment of connected vehicles across the nation.
- Advancing Automation: Shapes the ITS Program around the research, development, and adoption of automation-related technologies as they emerge.
The priorities reflect stakeholder feedback on the need for the ITS Program not only to conduct research, but also to help with deployment and implementation of specific technologies related to connected vehicles and automation. The priorities indicate where the bulk of transportation research and innovation is heading. They are not exclusive of other technologies or research areas. In addition, the ITS Strategic Plan includes program categories to provide the necessary structure for research, development, and adoption of ITS technologies. These include:
- Connected Vehicles — Primarily focuses on adoption and eventual deployment of the system.
- Automation — Focuses on topics related to automated road-vehicle systems and related technologies that transfer some amount of vehicle control from the driver to the vehicle.
- Emerging Capabilities — Focuses on future generations of transportation systems.
- Enterprise Data — Continues existing efforts in operational data capture from stationary sensors, mobile devices, and connected vehicles and expands into research activities involving the development of mechanisms for housing, sharing, analyzing, transporting, and applying those data for improved safety and mobility across all modes of travel.
- Interoperability — Focuses on how to ensure effective connectivity among devices and systems.
- Accelerating Deployment — Advances the work from adoption to wider-scale deployment in coordination with several other DOT agencies.
The ITS Strategic Plan was developed with significant stakeholder input from all relevant parties, both within and external to the Department. Close collaboration with all surface transportation modes (highways, rail, transit, motor carriers) and other agencies within the USDOT, such as the National Highway Traffic Safety Administration, helped shape the direction of the plan.
1The Project Management Body of Knowledge (PMBOK) is a set of standard terminology, processes, and guidelines for project management. The body of knowledge evolves over time and is presented in A Guide to the Project Management Body of Knowledge which is sanctioned by the Project Management Institute. [Return to Note 1]