Volume 1 - Technical Application: Transcending Boundaries with Surveillance, Monitoring and Action for Resilient Transportation (SMART) Infrastructure via Integrated Network-Wide Management
1. Project Narrative
1.1 Project Overview
New England and the U.S. Northeast Megaregion, a network of urban clusters that comprise 20% of the nation's GNP, is a demonstration site for the deployment of advanced sensing and data management technologies that ensure surface transportation infrastructure is maintained to fulfill its role as the backbone of all forms of mobility. Its focus is on sustaining functional and properly maintained roads and bridges to ensure safe and efficient mobility as well as supporting the nation's economy. A lack of attention to maintenance impairs the function of alternate modalities, and inhibits freight delivery systems and also the growth of advancements in mobility, such as connected vehicles, autonomous vehicles and safety features.
Multiple mobile advanced sensor systems will collect information that will trigger actions across modalities and align decisions to dollars. Investments will be optimized through direct short-term maintenance strategies, long-term decision-making, and resource allocation with respect to maintenance, repair, and construction of road surfaces and bridge decks. These technologies, which will operate within traffic at highway speeds and are consistent with MAP-21 mandates, will enable DOTs and local municipalities to inspect infrastructure without traffic closures. The ultimate goal is to enable agencies to better manage their transportation assets through optimizing resource allocation, preventive maintenance processes, coherent responses to critical conditions, and, importantly, region-wide planning.
A Northeastern University-led consortium brings together asset owners, users, technology providers and researchers across jurisdictions and modalities to create a neutral ground for integrating multi-stakeholder perspectives, and to serve as knowledge brokers and technology experts. Northeastern University, designated by the U.S. DOT as a Beyond Traffic Innovation Center representing the Northeast Megaregion, will deploy this multiple-technology deployment effort via the Northeast SMART Infrastructure Consortium beginning in the New England region and extending throughout the Northeast Megaregion and into the Northeast Corridor by year 4.
This deployment will demonstrate how the assembly of heterogeneous data from multiple mobile sensors can provide the basis for short-term and future decisions, cross-cut decision making entities, and enable the federal government to ensure the sustained performance of an interconnected multi-modal national transportation system. This approach provides advantages to state DOTs and municipalities, enabling them to integrate with larger networked decision-making systems, at no cost, while aligning their decisions in ways that will be sustainable beyond the term of this project and support the Beyond Traffic 2045 vision and mandates. Recognizing institutional challenges of deploying new innovative technologies and integrating new data sources into decision-making, this initiative is based on an integrated strategy of engagement with key organizations, including those encumbered in legacy processes; this engaged approach is critical to successful deployment.
1.1.1. Introduction - Summary of the Project and Technology Deployment
America's transportation infrastructure is in decline with insufficient resources to adequately repair and maintain it [1]. There is an urgent need for network-wide inspection data to enhance smart decision-making and to maximize the impact of repair investments. Beyond Traffic 2045 Trends and Choices [2] urges the nation to take better care of legacy transportation systems and to build what is new and necessary, while taking into account social and economic trends, and encourages the use of technologies to maximize the benefit of old and new transportation assets. It also identifies the need to improve federal, state, and local coordination.
To monitor and assess the condition of surface transportation assets, multiple sensor systems will be deployed through the Rapid Roaming Sensor Network (RRSN), and as the basis for the integrated network-wide management system, will result in:
- preservation, maintenance, and rehabilitation strategies that reduce congestion, improve safety, improve mobility for all population segments,
- optimization of maintenance activity and service life, and
- minimize overall life cycle costs of transportation assets.
Region-wide multi-modal considerations: A key benefit is the support for integrated decision-making through the data extracted from the RRSN, including information concerning the impact across transportation modalities such as freight. To provide the foundation to understand the interaction between modalities, the deployment of these technologies will give agencies more ubiquitous and distributed data collection methods (Section 1.1.10, concerning distributed sensing). A significant feature of these new sensor systems is that they will integrate with legacy systems and operate within and during traffic, eliminating the need for regular-inspection road closures. By substantially reducing lane closures and work zones required for traditional pavement and bridge deck condition evaluation, along with the ability to schedule more timely and effective maintenance, these new technologies change institutional norms for assessing and managing repairs and therefore maximize the impact of repair dollars. Consequently, system performance improvements related to safety and mobility will be evaluated (Section 1.1.8); projections at the regional-level for safety, mobility, environment, and financial benefit (Section 1.1.9) will be coupled with the engagement of public support for change and improvement; An independent evaluation (Section 1.1.11) will increase and sustain support for future deployments throughout the Northeast Megaregion; and a qualified deployment team guided by an advisory board will enable the deployment across different organizational systems (Section 1.2).
Organization: The Rapid Roaming Sensor Network (RRSN) deployment effort will be governed and implemented through the Northeast Surveillance, Monitoring and Action for Resilient Transportation Infrastructure Consortium (SMART-IC) consisting of municipalities, Departments of Transportation (DOTs), cities /towns, universities, and industries. Together, through joint governance and decision-making, they will advance infrastructure inspection region-wide, the collective assessment of data, and decision-making around maintenance, repair, and financial resource allocation based on the data and insights collected. This deployment will become a demonstration site that can be replicated in other U.S. megaregions.
Why Northeastern University? Northeastern has an established history of constant innovation in higher education and is an internationally recognized leader in experiential learning. Northeastern's research and community outreach has as its priority societal change and equity relative to benefits for all society's members. Its senior leadership and faculty, through effective interdisciplinary collaborations and strategic funding support, have created solution-tools directly applicable to this proposed initiative. The VOTERS Center for Infrastructure Assessment involves the use of advanced sensing and data management at highway speeds, which is further explained in this proposal. It has already been widely deployed. Northeastern's Transit Program, in collaboration with MIT, promotes innovation in the day-to-day practice of transit agencies; thus knowledge of transit operations and data analytic-needs, are deep. The Boston Area Research Initiative (BARI), an inter-university partnership based at the School of Public Policy and Urban Affairs at Northeastern University uses modern digital data to advance both scholarship and policy through cross-sector partnerships between researchers, policy-makers, practitioners and civic leaders. And representing the university's continued growth and world-relevance is the recent launch of Northeastern's Global Resilience Institute (GRI), which supports new engaged and impactful research project's building on a legacy of work connecting sustainability, security, and health. This project's RRSN deployment, and focus on infrastructure resilience and sustainability, will overlap with this new university-wide commitment to contributing to global resilience at multiple scales. A sought after group for objective evaluation, Northeastern's Dukakis Center for Urban and Regional Policy is a "think and do" tank focused on applied research in economic development, housing, transportation, and workforce development and uses data analysis, multidisciplinary research and a policy-driven perspective for evaluation of economic benefit and policies. The Dukakis Center will provide an independent economic evaluation of the RRSN.
Leveraging existing investments: As shown in Figure 1, the fully deployed RRSN builds on previous National Institutes of Standards and Technology (NIST) [3] and Federal Highway Administration (FHWA) investments [4] (Level 1). This proposed effort, by engaging directly with stakeholders such as the DOTs and municipalities to facilitate the institutional changes, will deploy these innovative advanced technologies (Level 2) and demonstrate the value and consequences of network-wide implementation through multijurisdictional application and impact evaluations (Level 3).
The RRSN responds to Beyond Traffic 2045 objectives by providing highway speed technologies and solutions with a new network-wide management system that will integrate multiple modalities across jurisdictional boundaries as a tool to better align decisions with dollars. Such just-in-time data gathering will provide public agencies with the means to support and inform decisions around resource allocation leading to significant benefit to DOT financial planning and long-term benefits to the regional economies in the Northeast Megaregion.
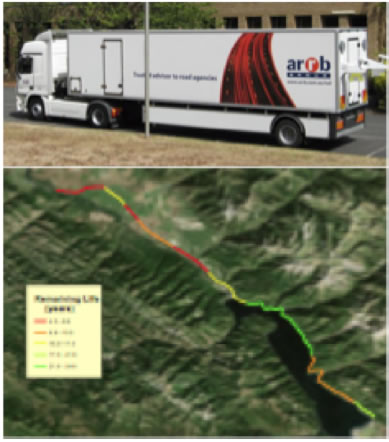
How does it work? The RRSN comprises three sensing systems and an overarching integrated and network-wide management system. The first system is a 20-channel array of high frequency radar capable of collecting measurements at highway speeds suitable for the International Roughness Index (IRI) calculation and at the same time to locate distresses such as rutting, potholes, faulting, and cracks. This system will be deployed on a variety of vehicles that will collect network-wide data while performing their normal activities. Over time, as the number of deployment vehicles increases, the RRSN will provide network-wide actionable information. Secondly, utilizing a Traffic Speed Deflectometer (TSD), additional data for the network will be obtained to provide bearing-capacity measurements to calculate the remaining life of pavements. A third aspect of the RRSN will enable in-traffic bridge deck inspections (without the need for road closure), incorporating 3D ground penetrating radar (GPR), infrared imaging (IR), acoustics, and video measurements. The emerging network-wide infrastructure management system will include network-level geo-referenced data (available to all the DOT systems); will integrate RRSN, third-party, and legacy data across assets and jurisdictions; and will incorporate new advanced technologies as they become available. Importantly, this provides some institutional flexibility by giving DOTs the option to continue using existing systems or to convert to a new network-wide management system. The RRSN data will support the optimization of resources and usage across modalities as information about road surface condition and subsequent traffic congestion can impact freight transportation routes and, in turn, freight trucks, which are damaging to roads; they may be advised to take alternate routes to preserve road conditions.
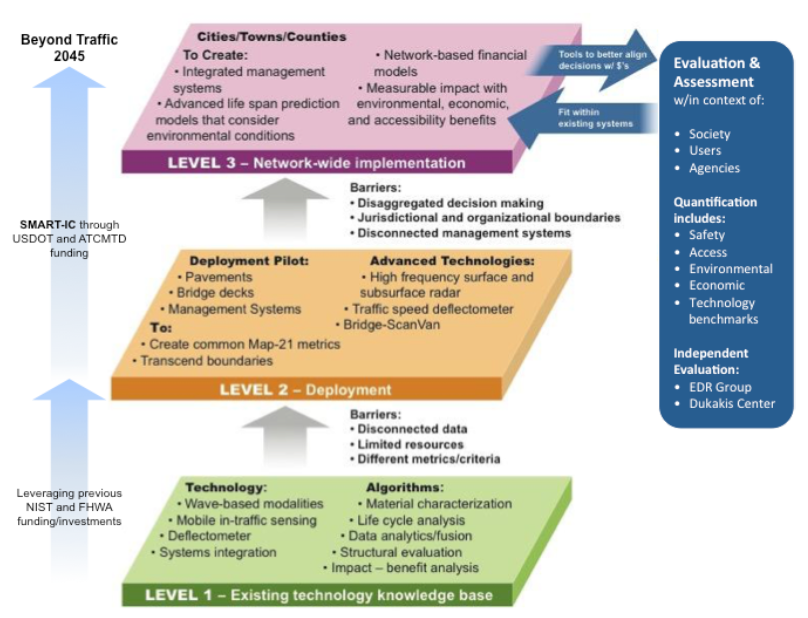
Figure 1: New technology deployment leverages existing investments to create integrated network-wide implementation responsive to Beyond Traffic 2045. Level 2 & 3 described in Section 1.1.5.
Assessment to improve data gathering: Technology that enhances and complements the data available in the integrated network-wide management system will be evaluated for possible additions during the multi-year deployment. Technologies to be evaluated in year 1 include highway-speed friction testing; the use of the RRSN 20-channel array to capture metrics indicative of friction performance; the potential for unmanned aerial systems to collect inspection data; and the viability of satellite data for inclusion in the integrated network-wide management system. In addition to the evaluation of these new technologies, all collected inspection data will be reviewed by asset owners within the context of decision-making within the context of additional quantifiable analysis concerning system performance, safety, mobility and environmental benefits. The entire integrated network-wide management system with supporting technologies will be reviewed and evaluated by inspection and management experts in other megaregions.
The following sections provide the details of the Northeast SMART Infrastructure Consortium, the RRSN technologies, proposed deployment plans, evaluation plans, and how this effort corresponds to the broader ATCMTD vision and goals. Supporting documents, referenced from within this narrative, are included to support claims within Volume 1, Section 2.
1.1.2. A Partnership via the Northeast SMART Infrastructure Consortium
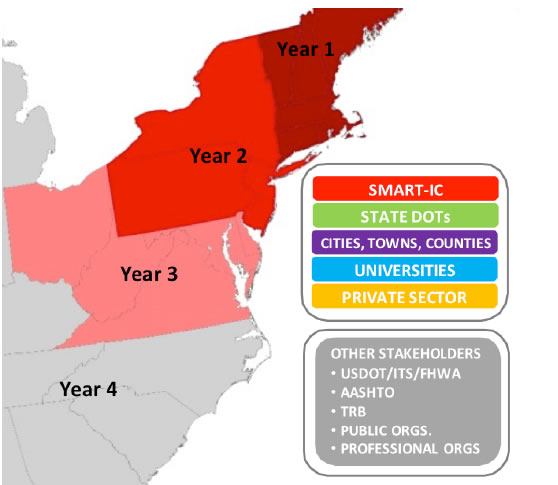
Northeastern University, designated as a Beyond Traffic Innovation Center (BTIC) by the U.S. DOT [5], will enter into agreement with FHWA to form the Northeast Surveillance, Monitoring and Action for Resilient Transportation Infrastructure Consortium; short-titled: SMART-IC. This consortium representing the Northeast Megaregion is comprised of the key players who will guide implementation of the advanced technologies deployed and developed under this proposed initiative. The Northeast SMART-IC is a group of infrastructure stakeholders consisting of asset owners (e.g. DOTs and municipalities), technologists, researchers, and policy experts who will collectively deploy the new technologies to transcend federal, state, and local boundaries and to cross-modalities to develop approaches that better align decisions with dollars. We believe that effective deployment relies on such collaboration across the public and private sectors as well as researchers and Metropolitan Planning Organizations (MPOs). Membership in the Northeast SMART-IC is open to any public or private agency that contributes to the RRSN; thus, membership will expand across the Northeast Corridor during this four-year technology deployment project as shown in Figure 2 and described in Section 1.1.6. Our vision is to grow the Northeast SMART-Infrastructure Consortium into a sustainable professional organization within the U.S. transportation community to be used as a platform for public agencies and private partners to collectively address barriers and establish policies to create and strengthen effective cross-jurisdictional decision-making. A successful Northeast model deployment site can produce successful SMART-IC's across other U.S. megaregions.
The asset owners will identify barriers, and contemporary and future agency-needs; research institutions will support advanced data analysis and will collaborate with the DOTs to identify decision-making metrics that will accommodate their needs; and the private sector will provide access to advanced technologies that meet the challenges identified by the Northeast SMART-IC. Additional stakeholders include U.S. DOT, FHWA, AASHTO, MPOs, and TRB. SMART-IC's governance and the plan to be implemented will incorporate the goals and objectives of Beyond Traffic 2045.
The SMART-IC will be guided by a steering committee comprising DOT/municipality strategy officers, policy makers, social scientists, and research engineers, who will charge subcommittees with responsibility for pavements, bridge decks, and management systems, as well as training, education, and outreach. This organization will underpin timely and reliable deployment implementation. As pointed out in the Intelligent Transportation Systems (ITS) strategic plan, communication and education also contribute substantially to deployment acceleration [6]. The following goals will govern deployment:
- Improve the state of the road and bridge infrastructure using network-wide inspection data for more frequent monitoring of conditions and better decision-making.
- Use integrated network-work wide inspection data to better align decisions with dollars, resulting in increased transportation infrastructure asset value to drive the nation's economy and reach a state of good repair.
- Meet state DOT existing decision-making needs.
- Provide advanced data analysis, visualization, and actionable information.
- Integrate new technology seamlessly into state-level DOT business operations.
- Provide training about advanced technology and metrics.
- Support the need to optimize multimodal system performance.
- Implement an independent, external assessment of deployed technologies and their impact.
Northeastern University will convene the Northeast SMART-IC, and its Office for Research Administration and Finance will establish the necessary inter-institutional agreements consistent with FHWA policy and procedures. Northeastern will require written agreements from each Northeast SMART-IC member who either receives funding or provides a cost-share match, documents that they possess the appropriate programmatic and administrative processes. Letters of support from state DOTs, municipalities, and industry are included in the proposal in the Supporting Document 2.2.
1.1.3 Description of the Geographic Area that the Northeast SMART Infrastructure Consortium will Serve
The technology deployment region begins with the New England region in year 1 and will then expand into the Northeast Megaregion. A prime example of density and economic output, and thus an ideal testbed for this project, the Northeast Megaregion produces more than 20% of the nation's GDP with 17% of the U.S. population on 2% of the nation's land, while New England produces more than 5% of the nation's GDP with 4.5% of the U.S. population on 1.6% of the nation's land [7, 8]. The region is both rural and urban and is subject to weather ranging from subzero temperatures to summer heat over 100 degrees F. The New England states together have a history of dialogue between local-state and regional players, and the practitioner community, such as collaborations that occur via the Annual New England Materials and Research meeting, comprising materials and research directors from the six New England states. The RRSN deployment was introduced at the June 7, 2016 meeting held in Manchester, New Hampshire. The New England Transportation Consortium, a collaborative of the six New England DOTs, is another example of an existing partnership that addresses common research needs.
Thirty percent of highway and bridge infrastructure in the Northeast Megaregion are in need of repair (53% of New England bridges) [9]. The region's massive, complex, and long-established network of road infrastructure will be further strained when the region's population increases by an expected 25% over the next 20 years [10]. In addition, the diverse infrastructure inspection and maintenance strategies practiced by the states in this region make New England and the U.S. Northeast Megaregion and Corridor an ideal testbed for advanced technology deployment.
The initial deployment within New England comprises an aggregate of 22,757 miles of highways (3% of nation's total) and 17,808 bridges (3% of nation's total). Beyond year 1, the RRSN will continue to be deployed within New England and will be extended to municipalities and states south of New England and into the Northeast Corridor. By the end of year 4, SMART-IC aims to deploy the RRSN within the Northeast Megaregion in the U.S., impacting over 10% of the nation's highway miles and bridges [9, 11].
1.1.4. Real-World Issues, Challenges and Opportunities
Aging infrastructure: Highway agencies throughout the U.S. are faced with the ongoing dilemma of how best to manage and maintain a total of 4 million miles of public roads. Built primarily between the 1950's and 1980's, many network components have reached or are approaching the limits of their service lives. It is an ongoing challenge to decide which elements should be preserved, maintained, rehabilitated, or replaced, and when. Critical decisions as to what to do and when must also be made with limited budgets. The conventional methods for condition assessment (e.g., coring, sounding) are too slow; some are intrusive, providing a limited view of a subset of assets, requiring lane closures with traffic impacts that lead to substantial congestion, safety hazards and limiting access to opportunities such as education and work.
Limits of current practice and deployment of new technologies: Technologies for rapid assessment of the surface and subsurface condition of pavements and bridge decks, developed in recent years, are not currently used to their full potential. In addition, decisions about priorities and resource allocation are being made based on old inspection technology, e.g., the pavement condition index (PCI), a manual visual method for quantifying only surface pavement distress. A historic lack of movement toward change is partly explained by the fact that new technologies require modifications in management databases used by agencies and considerable changes in practice. These kinds of institutional changes take time and effort, as well as a commitment to innovation; thus there can often be resistance to deploy innovations due to a stretched staff and limited band-width for institutional change. Failing to find ways to increase frequency of data collection can stem from understandable efforts to contain costs. Since current practices and methods for assessing roadway condition differ among the DOTs, there is no present consensus on the best metrics to use.
Opportunity: Through an engaged and collaborative approach, SMART-IC enables DOTs to try out new technology with minimal risk. The initiative also provides support for institutional and management changes that are essential for successful deployment. The proposed RRSN system will be complementary to existing practice and deployed to create value for municipalities with potential long-term high benefit. As municipalities and state DOTs choose to adopt the system, support for both the technological change and the associated management changes will be available and demonstrated with the constituents. In addition to demonstrating the information capabilities and its potential to enhance decision and resource allocation processes, SMART-IC will work hand-in-hand with the agencies to facilitate long-term changes that incorporate this new condition information into existing management systems during and beyond the duration of this project. During the project period, the public's trust in transportation planning will be further cultivated through SMART-IC education and engagement efforts. This project is timely because DOTs have already identified [12] the advantage of collecting inspection data across a wider range of environmental conditions such as moisture and rain, or at lower temperatures; the project's data will inform critical decisions concerning questions related to lifespan prediction under different environmental conditions.
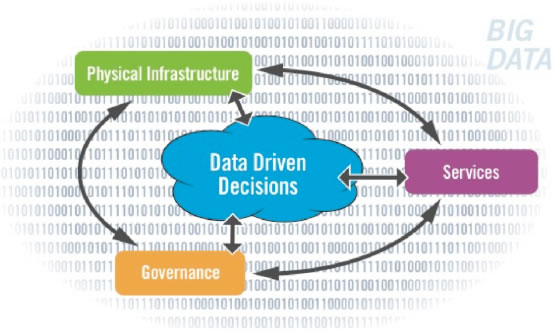
Beyond Traffic Innovation Center @ Northeastern University: In January 2017 U.S. DOT designated Northeastern University as a Beyond Traffic Innovation Center (BTIC) to serve the Northeast Megaregion. This Northeastern BTIC focuses research and outreach on data driven decisions that use the Northeast Megaregion as a testbed to support U.S./State DOT, municipality, and transit agency integrated decision-making.
As shown in Figure 3, the Northeastern BTIC creates decision-making tools that position big data from dedicated and opportunistic sensors to always-ready digitized data with actionable information. The BTIC will impact:
- Physical infrastructure – aligning decisions with dollars;
- Services – supporting the movement of people and things in an adaptive and efficient way; and
- Governance – motivating and creating an environment that fosters and rewards innovative thinking.
1.1.5. Scope of Transportation Systems and Services to be Included in the Project
The technologies and services deployed by SMART-IC target the inspection and management of the transportation infrastructure, specifically the highways and bridges that are under multiple state jurisdictions. To generate performance-based metrics, four technology deployment activities have already been identified by the participating DOTs for network-wide field deployment and evaluation of their efficacy:
- Network-Wide Pavement Inspection (NW-PI) System with a Surface Radar Array at highway speeds (Section 1.1.5.1)
- Network-Wide Pavement Structure Evaluation (NW-PSE) with Traffic-Speed Deflectometer (TSD) and Subsurface Radar (GPR) systems (Section 1.1.5.2)
- In-Traffic Network-wide Bridge Deck Inspection (NW-BDI) using a multi-sensor bridge deck inspection system avoiding lane closures (Section 1.1.5.3)
- Network-wide Management Systems (NW-MS) capable of crossing various boundaries and providing actionable information (Section 1.1.5.4)
Each of these technologies has been developed and demonstrated the ability to deliver quality results; thus these technologies are ready for deployment. In addition, the following complementary feasibility studies described in Section 1.1.5.5 will be performed:
- Evaluation of existing mobile friction testing technology and systems and comparison/correlation to other acoustic sensor data.
- Evaluation of value of remote sensing data from satellite or UAS technology to transportation infrastructure inspection.
1.1.5.1. Surface Radar-Based IRI System for Pavement Inspection (NW-PI)
Current practice and methods for assessing roadways conditions differ among the DOTs [13]. The measurements used typically include a combination of Laser Road Profiling and video analytics, such as provided by a commercial ARAN system, and visual inspection, all of which are used to determine quantities such as IRI (International Roughness Index, [14]), extent of cracking, extent of rutting, potholes, and PCI (Pavement Condition Index [15]). Most DOTs do an annual assessment of their roadway network.
This project, in contrast to current practice, will assess the efficacy of long-term constant pavement monitoring and determine the benefits of constant monitoring and the optimal frequency of pavement monitoring. To facilitate this effort, an automated pavement assessment system will be deployed on multiple state DOT fleet vehicles (the NW-PI). Consortium member StreetScan has developed this multi-channel road surface profiling system (Figure 4) utilizing 24GHz FMCW (Frequency Modulated Constant Wave) Radar technology [16]. The system will provide constant inspection of roadway conditions at traffic speed, across the width of the vehicle, and will measure IRI, rutting, faulting, cracking, potholes, and other pavement distresses as identified by MAP-21. Sample data and their interpretation to support the assertions made here are shown in the supporting documents (Section 2.3.1) including examples identifying the materials on the highway such as manholes, utility boxes, railroad tracks, concrete and asphalt as shown in Supporting Document 2.3: Sensor Proof of Concept.
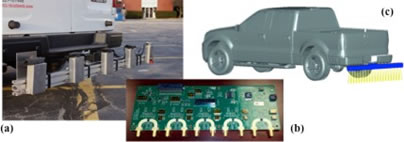
Figure 4: (a) Existing 5 channel surface radar road profiling system attached to trailer hitch (1 circuit board per channel). (b) New 5-channel board for expansion to 20 channels. (c) Conceptual model of 20 channel surface radar road profiling system capable of collecting data at highway speeds to be trailer-hitch mounted on DOT service vehicles.
Currently integrated on its proprietary multi-sensor pavement inspection van (Supporting Document 2.3, Figure 2.3.3b), the system will be customized by StreetScan, expanded to include a sensor count of 20 channels, and adapted to operate as a fully-automated standalone system. The 20-radar channels will be spread across 203cm (80") width providing a measurement at 10.1cm (4") intervals. The system can collect a sample at 1cm intervals up to speeds of 105kph (65 mph). Data is geo-located using a high-precision GPS system. In addition to being locally accessed and controlled wirelessly using a smartphone app or laptop computer, the on-board 4G cellular modem permits the system to be remotely accessed, monitored and controlled from an operation center. The system can easily be mounted via a standard trailer hitch (Figure 3), making it easily moved from vehicle to vehicle; other options for mounting will be considered if required. The system is powered by 12VDC available from the car battery. After being powered on, the automated system requires no user interactions for data collection, transfer, and processing.
System efficiencies: Once the system is powered on and as raw-data are collected, they are processed by an on-board computer into motion-corrected road-profile measurements, using the integrated accelerometers to remove the effects of vehicle oscillations. This on-board pre-processing greatly reduces the data load, creating efficiencies with the capture and transfer of real-time data transfer. The motion-corrected road-profile data and GPS position are automatically uploaded to a cloud-enabled server via the integrated 4G modem or Wi-Fi when available. Data accumulated in the cloud-server are automatically processed and converted to the various road distress measurements of interest, such as IRI, rutting, bumps and depression around manholes, faulting, severe cracking, and potholes. These results are then available for inspection in a Web-based GIS application (1.1.5.4). A new pavement metric can then be compared to the previous measurements. This is a network-wide time-based deterioration analysis and provides actionable information for decision makers.
At the same or lower cost, the 20-channel surface radar system will provide superior cross-lane coverage over the standard 2-sensor laser profiling system for IRI. The performance of the system will be verified per ASTM Standard E950/E950M – 09 for IRI [14]. In addition, the surface radar array system will provide additional information concerning rutting, faulting, cracking, potholes, metal objects, and other pavement distresses.
1.1.5.2. Traffic Speed Deflectometer System for Network-Wide Pavement Structure Evaluation (NW-PSE):
Identification of the strengths and weaknesses within the pavement structure is a more cost-effective approach than assessing surface conditions, and can inform a plan for pavement rehabilitation. Current practice uses a Falling Weight Deflectometer (FWD), a stationary test that requires lane closures and is not suited to network-level evaluation. To address this limitation, the FHWA, in collaboration with over 15 State DOTs, has tested over the past six years a Rolling Wheel Deflectometer (RWD) and a more advanced Traffic Speed Deflectometer (TSD) (Figure 5) for network-level pavement structural evaluations over the past 6 years [17, 18].
The SMART-IC team will deploy a highway-speed data collection system for network-wide pavement structure evaluation and bridge deck condition evaluation, which builds on past work by the FHWA to test with DOTs a Rolling Wheel Deflectometer. The system combines the DOT's TSD, and Ground Penetrating Radar (GPR) (see Supporting Document 2.3, Figure 2.3.3a), and specialized analytical techniques to calculate pavement structural properties. These systems represent the state-of-the-art in pavement condition evaluation, and have been deployed by various states at a level that has shown their viability.
TSD and GPR: Combining TSD and GPR has demonstrated significant potential for highway agencies. For pavement structure evaluation, the TSD measures the deflection under the load of a loaded tractor trailer while driving at normal driving speed. The deflection is measured at several positional offsets from the tire-load using highly sensitive Doppler lasers, which provide a "deflection bowl" that is also produced by conventional Falling Weight Deflectometers. This deflection bowl provides the basis for evaluating the strength of the subgrade and pavement layers, information that is key in determining the pavement structural capacity and predicting its remaining life. These calculations (expanded on in Section 2.3.2) also require the knowledge of the thickness of the pavement layers, complementary information that will be provided by GPR.
The TSD technology, which was developed in Denmark and has been deployed in Europe and Australia over the past five years, has recently been imported to and evaluated in the U.S. in a pooled fund study TPF-5(282) in a number of states. The SMART-IC team member Infrasense, working with the Idaho Department of Transportation, has surveyed and analyzed 735-lane mile roadways with the TSD and GPR. The result will be a detailed estimation of pavement remaining life on the basis of information about subgrade modulus, pavement modulus, and pavement structural number combined with traffic projections. The resulting life projection for homogeneous pavement segments has already been incorporated into Idaho's statewide transportation geodatabase, iPLAN (Figure 5 example), and can be accessed directly on the web [19]. This data now serves as the basis for budgeting and planning cost-effective pavement maintenance and rehabilitation.
1.1.5.3. In-Traffic Multi-Sensor Bridge Deck Inspection System(NW-BDI)
Since decks represent the most significant cost over the life cycle of a bridge, accurate assessment of deck condition is critical for the timely implementation of appropriate deck preservation treatments, maintenance, and rehabilitation. Such planning can significantly extend the life of the deck and reduce unnecessary congestion. Currently, bridge decks are typically inspected using visual inspection and sounding. Visual inspection is required by the FHWA and is deployed by inspectors looking at the bridge deck for spalling, cracks, efflorescence, rust, and other signs of deterioration. Based on how much deterioration is visible, a rating on a scale from 0-9 is assigned to the deck [20]. When sounding is used, it could be hammer tapping and/or chain dragging, both of which look for delaminations within the subsurface. Significant drawbacks are that sounding can only be used on bare concrete decks and it requires lane closures. Currently, data collected from bridge deck inspections are incorporated into an inspection report and are also logged into a computer database, usually AASHTOware [21]. For overall assessment at the network-wide level, GPR is the recommended tool because of its speed and ability to identify delamination and ability to describe the corrosive environment [22]. Importantly, research studies have shown the significant correlation between GPR and rebar corrosion [22-24].
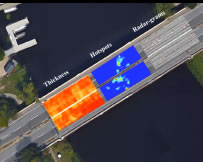
Figure 6: Image of bridge deck overlaid with sample 2D plots indicating top layer thickness, hotspots or areas of debonding, and radargram indicating corrosion potential.
With the development and implementation of a multi-antenna GPR array system operating at traffic speed (Supporting Document 2.3: Sensor Proof of Concept), the GPR survey can sweep each lane with 20-30 antennas operating simultaneously, dramatically changing the efficiency of GPR data collection. Research at Northeastern University carried out under the VOTERS [25-28] program and by other research teams has demonstrated a clear relationship between bridge deck corrosion and delamination and the signals received by a GPR antenna [23]. The GPR data provide extensive detail on the location and severity of deck corrosion and delamination. The cause of rebar corrosion (chloride and moisture infiltration) can be easily disclosed, since chloride causes signal attenuation and moisture slows the GPR signal. By comprehensively mapping and quantifying this information, agencies can determine which decks are free from deterioration or would benefit from preservation treatment or extensive repair and rehabilitation.
Through this project, the NW-BDI system will be assembled using commercial-off-the-shelf technology consisting of: (1) a GPR array system, (2) infrared thermography (IR), (3) surface radar (1.1.5.1), (4) 360-degree camera, (5) bridge deck facing video and (6) a positioning system. The technology can be deployed to quantify asphalt layers and regions of distress as demonstrated in Section 2.3.3. An example of the resulting data is shown in Figure 6, visualizing distress and providing actionable information so that damaged locations can be pinpointed and spatially located on the actual bridge deck for eventual repair.
An overall damage quantity will be provided as well. This will be a percentage (%) of the deck that is considered damaged in contrast to the application of nondestructive testing methods. Subsequently, a repair schedule can be developed, deck repair prioritized and repair funds appropriately allocated, to obtain the largest return on repair investments. Additionally, for the first time, network-wide bridge deck deterioration metrics can be developed from the regular inspection data collection, typically done in two-year intervals.
1.1.5.4. Network-Wide Management Systems (NW-MS)
The proposed management system will create capacity for DOTs and will be adapted and customized to state and local agency needs and their existing processes. The NW-MS will have the capability to take in data from existing systems and use the expanded systems. Inputs and outputs will be well defined and agreed to. In contrast, agencies are currently managing a wide variety of data using a variety of different formats, condition indices, and different geo-referencing labels. Yet a small number of states use geographic information system-based systems (GIS) in their decision-making process: GIS will provide an opportunity for a multijurisdictional-unified solution, with diverse datasets, including legacy data.
Importantly, Beyond Traffic 2045 identifies the need for this system to transcend jurisdictional boundaries. The NW-MS will be designed to work across units internal to the agency and across municipality and state DOT boundaries. The SMART-IC management system will be responsive to concerns across the state by DOTs and municipalities [29], including their difficulties in maintaining and updating databases; a need for training with new software systems or processes; guidance on the presentation of data to non-experts and stakeholders; and reducing the current, long delays between data collection and providing processed results to decision makers.
Making data access sensible: The customized Data Management Platform shown in Figure 7 addresses the many barriers to state DOT adoption. The web-based application to be used with in this initiative is a GIS-oriented platform that accommodates, visualizes, and leverages data from heterogeneous sources. It has an intuitive and user-friendly interface to monitor the assets such as roadway and bridge conditions based on SMART-IC generated, legacy, and other third-party information. This system can easily be expanded to include other assets maintained by the DOTs (e.g., signs and shoulders, rail), extend across jurisdictional boundaries, and prepare the state DOTs to meet the objectives of Beyond Traffic 2045.
The database: To accelerate deployment of the NW-MS, a central SQL-based database will be established on Northeastern servers in year 1, to be moved into the cloud in subsequent years. This database will be dedicated to the SMART-IC datasets acquired from the data-collection deployment activities, in addition to any other relevant third-party datasets. Legacy data can either be hosted locally or remain on the DOT servers. Web-tier authentication will allow authorized users to tap into these databases for visualizing and getting access to the data through a password-protected front-end web interface. A web adapter will be implemented to integrate the database to the NW-MS's web interface while maintaining the distinction between Northeast SMART-IC members and other users. This database will be populated with the following:
- SMART data: Data processing begins once data is uploaded from the SMART-IC vehicles. Datasets, each assigned with spatial references, will be fed into the central database. Processed data layers (e.g., road profile, IRI, pothole, bridge deck delamination, etc.) will be visualized. The high frequency of the SMART-IC generated data updates requires the NW-MS analytic models to be calibrated for shorter time intervals.
- DOT/municipality data: Database design and table schemes will be based on each asset owner's available data and existing databases. A secure connection between the NW-MS database and the existing databases will be established. Legacy data, in addition to other relevant information such as the Linear Referencing Systems, will be integrated. Based on each state DOT's preferences, this data can be moved over into the NW-MS's database or just leveraged by the NW-MS from a state DOT database.
- Third-party data: Additional relevant information would be integrated to be visualized and leveraged by the NW-MS decision-making engine, e.g., climate and load data from long term-pavement performance (LTPP) and the National Oceanic and the Atmospheric Administration (NOAA); this is also used to predict deterioration and future budget needs.
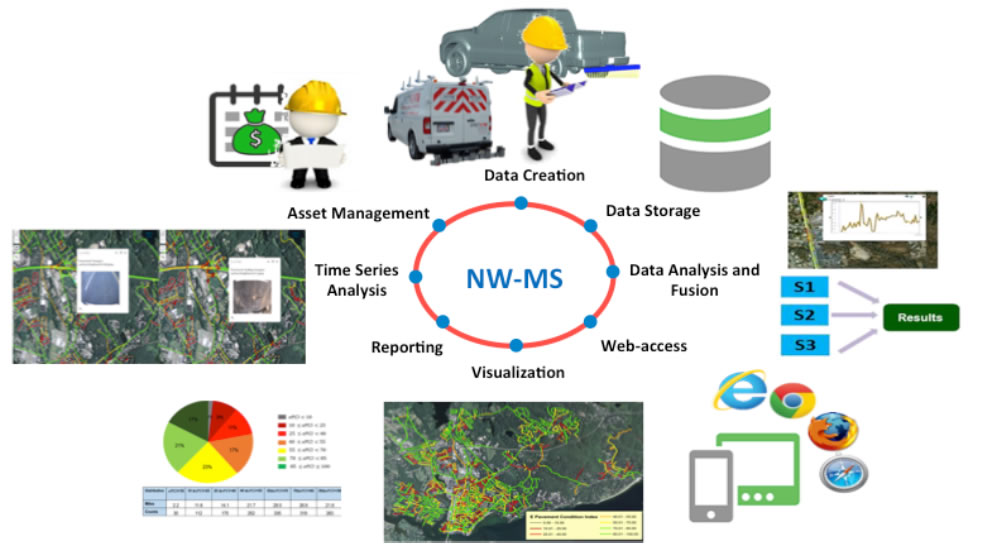
The distinguishing features and key benefits of the NW-MS are:
- Multimodal systems: The system can incorporate data relevant across transportation modes to support usage modeling.
- Ability to manage all assets (pavements, bridges, signs, etc.) in the same GIS-based interface. Therefore, NW-MS can transcend internal boundaries and the external boundaries as data can be shared with neighboring DOTs.
- Performance-based metrics: Rather than using intuition or personal experience, NW-MS's mathematical models incorporate immense amounts of information concerning every meter of every inspected road.
- Zero-expense installation: Users do not need to do any software installations to operate NW-MS.
- Secured web-based access to the records from anywhere via the Internet.
- Automated information update: After each survey, data are automatically processed, placed into the database and updated on NW-MS.
- Powerful visuals: This permits the dramatic presentation of road conditions and the ability to challenge or support maintenance and repair decisions more effectively.
- Customizable nature: The system can be customized based on each DOT's preferences and goals.
- The high frequency of data updates allows comparisons and improvements of analytical models for short time intervals.
1.1.5.5. Technology Feasibility Studies to Strengthen and Support Evaluation
To embrace the advancements in sensing technologies and computing capabilities, each year of the project will include evaluation of new capabilities to add to the SMART-IC platform. In year 1 this evaluation will include a review of mobile friction testing systems and the applicability of remote sensing systems to inspection practice. Each year, the data produced by the deployed technologies will be evaluated for fit to MAP-21 and Beyond Traffic objectives and within the current practice of participating agencies.
- Mobile friction testing technology and systems: Existing mobile friction testing technology and systems at traffic speed will be reviewed, and the capability of new sensors to collect comparable data will be evaluated. Existing systems such as the FHWA funded Dynatest 6875H Highway Friction Tester will be used for baseline measurements. These baseline measurements will be compared to data collected through the SMART-IC NW-PI described in 1.1.5.1 and an acoustic sensor (Supporting Document 2.3.4 for technical description) developed by Northeastern University. Through these comparative studies, comparable Mean Texture Depth (MTD) measured at traffic speed will be proposed.
- Remote sensing capabilities: Satellite data and the use of UAS technology to capture data in difficult-to-reach regions have the potential to provide data not available through alternative sensing systems. For example, satellite imagery provides a landscape view of the network with the ability to quickly identify and perform basic assessment on critical linkages, which can be especially useful in a post-hazard scenario [30, 31]. UAS technology [32-34] has been used for airfield pavement inspection and other transportation related applications related to safety and roadside condition surveys. Advanced UAS data such as eXom mapping and inspection drones [35, 36] can provide infrared imaging of bridge decks to identify existing deck distress and delamination. Challenges are position registration, standoff and non-contracting nature limits type of sensors, traffic safety concerns, short flight, weather, and the availability of qualified operators.
Following a year of evaluating the different friction testing, remote sensing and stand-off monitoring systems a decision will be made to integrate remote sensing capabilities into the NW-MS platform starting in year 2.
1.1.6 Deployment Plan and Long-Term Operation
The Northeast SMART-IC has identified four key deployment activities, as described in Section 1.1.5, with the potential to change not only the long-term operation and maintenance approach of the road and bridge networks, but also to improve their quality and performance, reduce congestion and increase safety. Under this funded initiative, SMART-IC will deploy them in year 1 with the collaboration of the state DOT consortium team members. The true value will become obvious in subsequent years when the network-wide capability to monitor the deterioration of roads and bridges can be quantified. While our initiatives will define and anticipate activities in years 1 and 2; the subsequent years' activities will be determined by findings and progress during the first two years.
Process of deployment: The partner agencies (DOTs and municipalities) will play a major role in the deployment strategy and scope, and in evaluating and adjusting the deployment activities. Key to a successful deployment is the annual evaluation of the viability of the data collected for decision-making purposes within and across agencies.
Independent evaluation: Looking ahead to dissemination beyond the model deployment implemented by the SMART-IC, an independent evaluation will be performed by an independent panel of agency representatives and researchers described further in Section 1.1.11.
Continuous assessments: SMART-IC's deployment plan has a dynamic multi-year strategy as illustrated below. Each year we will add state DOTs to SMART-IC; starting with year 2 we will invite municipalities (cities, towns, and counties) to learn from our self-assessment and utilize what SMART-IC has to offer in the second year. Some will decide to continue taking advantage of the benefits by choosing to deploy the technologies themselves or partner with the appropriate engineering service provider. New technologies will be incorporated into the RRSN following the feasibility studies described in Section 1.1.5.5 (A detailed timetable is provided in Sec. 1.1.13.)
Deployment Activity 1 – surface radar pavement inspection - Year 1: The pavement inspection deployment activity described in Section 1.1.5.1 (NW-PI) will deploy a 20-channel surface radar array system on each of 31 existing government vehicles to collect data across New England and on federal, state, and local infrastructure. The allocation is approximately one vehicle per 500 highway miles in a participating state (Table 1). The NW-PI system collects data while traveling over the highways for any business for which the vehicle is used, making the data collection ubiquitous. The data is automatically transferred and accumulated by SMART-IC for advanced data analysis, visualization, and extraction of actionable information. This will produce IRI data and other highway distress information more frequently, across the full width of the lane and in all lanes in which the maintenance vehicle travels. Years 2-4: This allows for network-wide surveillance, i.e., monitoring and visualization of the deterioration of the IRI and other distresses (Section 1.1.5.1). It also lays the foundation for the development of enhanced life-cycle models. To achieve the standards of Beyond Traffic 2045, it is important to first demonstrate the viability of distributed sensing in a limited geographic area. SMART-IC envisions an expansion of this activity to additional Northeastern states in subsequent years; in year 2 this would include: New York, Pennsylvania, New Jersey; year 3: Delaware, Maryland, and Washington, DC.
Deployment Activity 2 - pavement structure evaluation - Year 1: The network-wide pavement structure evaluation system (NW-PSE, Section 1.1.5.2) is deployed through two dedicated vehicles. The TSD will be rented to collect at least 1,200 miles of structural properties data throughout the partner states. The GPR data will be collected with an existing system from the SMART-IC partner Infrasense. The array of highways will be selected in close collaboration with the state DOTs. Years 2-4: Another 1,200 miles of highway sections will be surveyed each year. Starting in year 3, some sections from year 1 will be re-surveyed to create a time-series that provides quantifiable information on the deterioration process and to establish recommendations for a regular inspection interval. The NW-PSE activity will be expanded to newly participating states during these years.
Deployment Activity 3 - bridge deck inspection - Year 1: The in-traffic network-wide bridge deck inspection sensing solution (NW-BDI, Section 1.1.5.3) will be deployed on one dedicated bridge deck inspection vehicle. In the first year, SMART-IC expects to survey at least 400 bridges in the participating New England states (Table 1) without causing bridge closures. The bridges will be selected in close collaboration with the state DOTs. Year 2-4: An additional 400 bridges will be surveyed every year. A small subset of bridges will be surveyed every year to create a time-series that provides quantifiable information on the deterioration process of the bridge deck. This will be the basis for recommendations for a regular inspection interval. The NW-BDI activity will be expanded to bridges in newly participating states and include more bridges in subsequent years. The ultimate goal is to make it feasible to survey all bridges in every state in a 3-year period, and thereby create for the first time the capability of surveilling bridge decks network-wide at regular intervals without closing bridges. This provides an evidence-based deterioration timeline that allows the DOT to prioritize network-wide repair. In addition, it creates improved metrics that will support the development of enhanced life-cycle models.
Deployment Activity 4 - management system transcending state boundaries - Year 1: The network-wide management systems activity (NW-MS, Section 1.1.5.4) is an overarching activity that supports the previous three activities and creates the connections to legacy and third-party data. NW-MS will be an environment in which data is ubiquitous and encourages decisions concerning alignment and resource allocation across traditional governmental boundaries and state-level districts. Multiple efforts will run in parallel to create an expandable data management system that can grow, in accordance with Beyond Traffic 2045, and at the same time provides access to legacy data. An inventory of all available geographic referenced legacy data and systems to be included in the NW-MS will be collected in collaboration with the DOT partners. Commercially available solutions will be explored and compared to the proposed cloud-based solution described in Section 1.1.5.4. Relevant third-party data to be included will be identified. After these initial questions have been answered, the NW-MS architecture will be designed and implemented. It will require flexible data import and export features, well-documented data descriptions and formats (metadata), and geospatial tagging. Year 2-4: The NW-MS will be extended to other interested DOTs. New data from the other activities will be included. The monitoring features for the time-series data will be implemented based on the identified needs of the DOTs and the results of impact analyses.
1.1.7. Regulatory, Legislative, Institutional Challenges – Bringing Down the Barriers
Well-intended legislation often has unintended consequences related to the ability of state and local governments to obtain needed funds for repair and maintenance, i.e. The Moving Ahead for Progress in the 21st Century (MAP-21) legislation eliminated the Highway Bridge Program, rolling it into the National Highway Performance Program (NHPP) where it resides in the Surface Transportation Program. While MAP-21 provides for well-justified performance-based decision making, off-system bridges are now no longer included, so the public investment in bridges is less assured due to two competing programs with no guaranteed set-asides for repair. On the other hand, state agencies are looking to benefit from the Fixing America's Surface Transportation (FAST) Act, which gives agencies more flexibility with inspection planning horizons [38].
Adoption of new innovative technologies by public agencies can be constrained by many factors [39, 40]. Unintended barriers to innovation result from changed legislation changed planning horizons, complex regulations, as well as cultural and institutional resistance within organizations. State agencies have to be knowledgeable about the latest legislation while taking into account their financial resources and already established planning milestones. Change, that also necessitates selecting new service providers or the adoption of new methods, puts a strain on agencies. Additionally, the use of new metrics, due to new technology applications, requires management system changes, along with the necessity to connect data to legacy systems. For these multiple interconnected changes to occur, an integrated approach to deployment that considers the social change, in addition to the technological change, is essential [41].
The different organizations responsible for managing maintenance of the complex transportation system, each have different institutional constraints to deploying new innovative technologies. These organizations are oriented around their legacy systems. So, deploying new technologies to ultimately benefit the megaregion requires a capacity for and commitment to join and change internal decision-making processes by adjusting existing decision-making mindsets. The design of the SMART-IC initiative and RRSN deployment is based on acknowledgment of this central challenge of technology deployment; by engaging agency policy makers, decision makers, and engineers from the beginning to promote the adoption of the new technology, the initiative will support both technological change as well as the social and management changes that are required for effective long-term deployment.
The vision: Cross-jurisdictional decision-making must have access to data from all sources and across jurisdictions. This requires consistent data that is pooled into a single management system. Through this project, RRSN will demonstrate how the assembly of heterogeneous data from a multi-array of sensors can provide the basis for short-term and future decisions, cross-cut decision-making entities, and help the federal government carry out its responsibility "to ensure the sustained performance of an interconnected multi-model national transportation system" [42].
A bold vision, as MAP-21 calls for, requires substantial unity across states, districts, and municipal units. The RRSN, in generating useful and time-sensitive information for roadways and bridges, will strategically cross boundaries in order to create and deploy unified, evidence-based approach to repair and maintenance. A major challenge is to bring the differing interests of stakeholders (private sector, public agencies, researchers, practitioners) into a frame that is mutually reinforcing and unifying. A key feature of SMART-IC is the identification of common barriers to the deployment of new technologies among different agencies and jurisdictions.
Another key feature is facilitating collaboration in the development of shared solutions for a unified approach without threatening existing agency processes. SMART-IC provides strategic opportunity to evaluate new systems in a way that does not threaten existing methods and systems and to create collectively common metrics and specifications across states to meet federal requirements.
SMART-IC's deployment success requires reliable technology and processes to integrate and evaluate the data, respect and integration of legacy data, as well as organizational systems and policies that will apply the new data to decision-making processes. The Boston Area Research Initiative (BARI) and the Northeastern School of Public Policy will be members of SMART-IC and they will work with policy setting organizations within each municipality (state DOT, town or service provider) to determine how best to align their policy and governance to the new network-based management system and ensure the new datasets to provide actionable information. SMART-IC will facilitate:
- Frequent and direct engagement with agency management throughout the technology deployment process to support institutional and management changes;
- The creation of management processes that can mediate or integrate the complexity emerging from interactions and the system as a whole as it reacts to stressors; and
- Anticipation of the impact of the new technologies within the whole transportation system and the organizations that support the different system components.
1.1.8. Quantifiable System Performance Improvements: Assessments
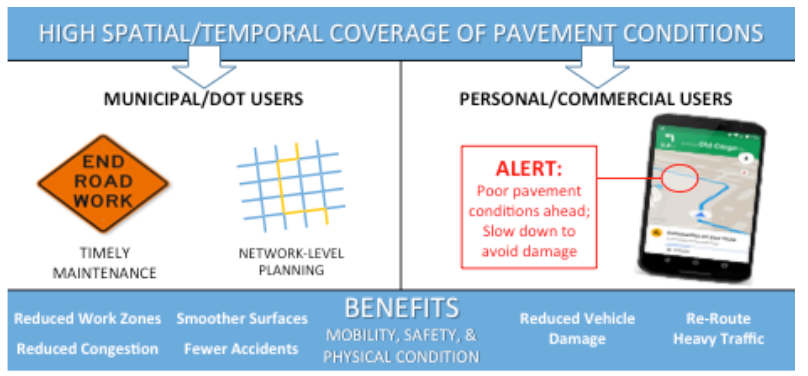
The proposed network-wide pavement and bridge inspections will better serve users' mobility and positively impact the crucial safety issues as shown in Figure 8. Nationally, work zones contribute to 10% of congestion annually and increase by 50% non-recurrent congestion [43]. Work zones cause 24% of non-recurring freeway delay, equivalent to about 888 million hours in 2014 [44]. In addition, the total hours of highway congestion delay in the top 50 metropolitan areas has grown by 36% [45]. Evidence shows that work zones are related to accidents and safety issues: these accounted for 1.2% of all crashes in 2013 [44]. Approximately 12-16% of traffic crashes are due to roadway environmental conditions including substandard roadway conditions [46].
1.1.8.1 Quantification for Safety, Mobility, and Traffic Projections
In 2014, Americans spent 6.9 billion hours in traffic [47]. The proposed network-wide pavement and bridge inspections will positively impact mobility by reducing congestion improving safety (Figure 8). The primary project tasks will address three expected advantages from the deployment of the proposed inspection technology.
- Timely scheduling of maintenance activities: Timely decisions will reduce driver exposure to substandard conditions.
- Systematic planning of maintenance activities at the network level: Making decisions at the network level will allow the optimal scheduling of actions that takes into account all the areas of improvement we seek to impact including congestion and safety.
- Use of network-wide inspection data and third party data in the cloud will validate the merit and advantages of using traffic-speed data collection and management systems following the rigorous data model specified in Supporting Document Section 2.4.
Optimizing system efficiency: Key questions concerning mobility and safety will be addressed using available traffic simulation tools and data. We take guidance from the Highway Safety Manual [48], which supports the evaluation of the impacts of transportation projects on safety, including crash costs. Under different scenarios of maintenance strategies, the benefits due to reduced travel times, delays, queues, and travel time reliability, will be evaluated. Depending on the scope of the network analysis, both microscopic and mesoscopic traffic simulation models can be utilized. Caliper Corporation will provide their transportation planning and traffic simulation tools, TRANSCAD and TransModeler, for the related studies. In addition, the guidelines provided by FHWA's Work Zone and Traffic Analysis Tools [49] will support the analysis. For example, the QuickZone [50] traffic analysis tool provides a useful means to evaluate travel-time impacts.
- Identify a transportation network of appropriate scope and complexity, in partnership with SMART-IC agencies.
- Establish baseline maintenance plans based on current practices for the proposed network within each agency.
- Develop optimal network-level maintenance plans using the more detailed data of pavement condition and existing pavement management systems.
- Evaluate impacts on traffic over time of the maintenance plans and compare various metrics to the base case using simulation models and standard traffic assignment models.
- Assess traffic redistribution and impact on aggregate safety measures using scope of work zones corresponding to the alternative maintenance strategies, and traffic assignment models.
- Provide relevant input for comprehensive life cycle cost analysis described in Section 1.1.9
The methodology and results of the analysis will be presented to local stakeholders and the SMART-IC Advisory Board for feedback on the main assumptions, input data, and interpretation of the main findings.
1.1.8.2 Savings in Direct and Indirect Fuel Use and Emissions
In 2014, congestion led to 31 billion gallons in wasted fuel, equivalent to more than 15% of the total consumed. Poor road conditions, in addition to contributing to congestion, also wastes fuel through increased rolling resistance and resulting sub-par vehicle fuel economy. Improvements in pavement monitoring and maintenance using SMART-IC deployment data will lead to less congestion from work zones and road accidents as well as smoother roads, leading to direct fuel savings. Even just a 10% reduction in rolling resistance can lead to 1-2% improvement in fuel economy; a smooth roadway surface can bring down overall fuel consumption by 2.5% [51], equivalent to nearly $10 billion dollars in direct fuel savings just for the East Coast region.
Saving fuel has environmental benefits through reduced emissions, thus improving air quality and reducing health impacts for drivers and local residents. The transportation sector is responsible for the majority of anthropogenic carbon monoxide (CO) and nitrogen oxides (NOx) emissions in the United States, as well as 30% of all volatile organic compounds (VOCs) and 15% of greenhouse gas (GHG) emissions. Reductions in these emissions through direct fuel savings can be easily estimated using established emissions factors.
Improved pavement management systems also lead to fuel savings and reduced emissions indirectly, both through optimized use of pavement construction and maintenance equipment, as well as upstream through savings in the production of fuels and pavement materials.
Quantify direct fuel savings – Year 3: Direct fuel savings from decreased congestion will be quantified by combining results from the mobility and traffic projections with the fuel savings module of the TREDIS suite (see Section 1.1.9). Direct fuel savings from improved surface conditions will be quantified by combining network-wide pavement roughness improvements (projected from deployment data) with current VMT data for each road type (from state DOTs and FHWA) in existing physical models of vehicle fuel economy [51].
Quantify direct emissions reductions – Year 3: Using direct fuel savings results from above emissions of the criteria air pollutants CO, NOx, particulate matter (PM), VOCs, sulfur dioxide (SO2, primarily from diesel fuel), as well as CO2, will be estimated using emissions factors from the EPA MOtor Vehicle Emission Simulator (MOVES) current model version (2014a).
Quantify indirect energy and emissions benefits – Year 3: Fuel and emissions savings from optimized road maintenance practices, as well as savings associated with reduced pavement material requirements, will be estimated using the Athena Pavement Life Cycle Assessment (LCA) software package. Fuel and emissions savings associated with direct fuel savings will be estimated using LCA data from the National Energy Technology Laboratory for U.S. motor fuels.
1.1.9. Quantifiable Regional Cost Savings
Poor road and other surface transport conditions impose annual costs to households and businesses of $130 billion for the entire U.S., including $97 billion in vehicle operating costs, $32 billion in lost time, and nearly $2 billion in safety and environmental costs [45]. Poor surface transportation and congestion lead to increases in the cost of business travel and shipping [52]. Furthermore, maintenance deferments have consequences that include poorer pavement performance leading to a reduced level of service, early deterioration, higher user costs, and accelerated pavement deterioration and, in some cases, an earlier-than-usual need for high-level treatments such as replacement [53]. Given current road conditions and investments, as a result of congestion, a loss of more than 2.5 million jobs is estimated in 2025 [54].
On the other hand, extensive prior research, both empirical and model-based, has shown the economic benefits of timely pavement monitoring and maintenance strategies [55-59]. A commonly cited result is that every $1 spent on pavement preservation before significant deterioration has occurred produces $6-$10 in avoided or delayed rehabilitation or reconstruction costs [60].
The determination of life cycle costs of alternative pavement management programs is an important part of a defensible and rational decision-making process for maintaining a pavement system in acceptable working condition. The proposed network-wide monitoring system, with its rapid, data-rich, and high-resolution results, is expected to reduce agency costs, user costs, and social costs to local communities as shown in Figure 9. Specific areas of direct cost savings include:
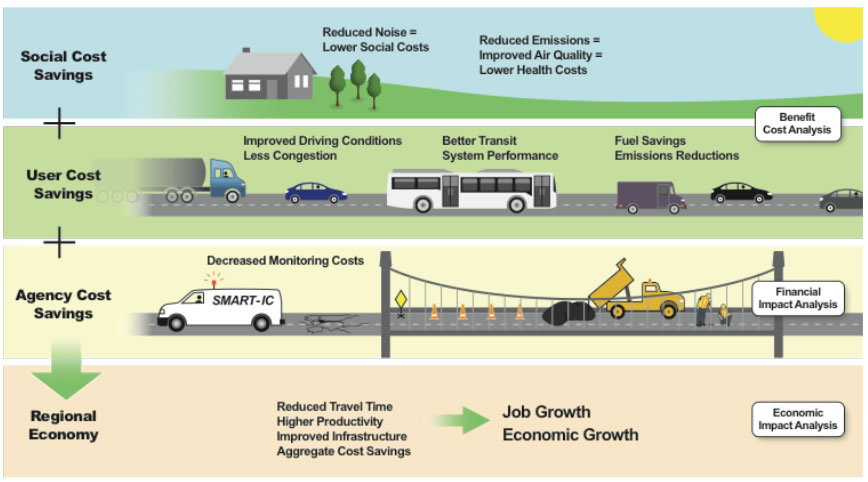
Agency: Monitoring costs enabling more frequent and comprehensive data; preventive maintenance, thus avoiding more expensive rehabilitation and reconstruction costs;
- User: Fuel savings, travel-time savings (from the ability to travel at higher speeds and subject to fewer lane closures); reduced damage to vehicles; improved safety;
- Social: Savings related to improvements in local environmental conditions, including noise and air quality, with concomitant health benefits that can be valued in economic terms.
Life-cycle costs: As described previously, a robust life cycle cost analysis (LCCA) is critical to justify funding for research and implementation for the proposed project and to show that overall project objectives are being met. Data-driven LCCA will provide a platform for optimal economic decision-making around maintenance scheduling and operations, as well as a robust basis for potential future analysis that incorporates direct and indirect environmental considerations.
The project team has already conducted a preliminary LCCA for a small-scale deployment of the proposed system in the single municipality of Concord, MA. In an analysis of multi-year datasets, we found that simply moving from a 4-year to a 3-year inspection cycle reduced overall agency costs by >20% while nearly doubling the remaining service life of pavements [61]. In addition to agency and user costs, we included the health and environmental benefits of avoided pollution, using damage functions from the U.S. DOT TIGER program. Our analysis showed a reduction in agency costs of 90% (largely due to avoided material and construction costs), a reduction in user costs of 17% (including fuel, repair, and passenger exposure to carbon monoxide and VOCs), and a reduction in health and environmental costs of 13% (again largely due to reduced emissions from construction and related traffic congestion).
Cost-savings evaluation: In order to carry out an assessment of potential cost savings for the Northeast Megaregion, the SMART-IC will engage, as an independent evaluator, the EDR Group of Boston, MA. EDR has developed a suite of economic analysis models for transportation called TREDIS, which provides Benefit-Cost Analysis, Economic Impact Analysis, and Financial Impact Analysis for transportation planning. Additionally, TREDIS incorporates wider economic benefits into transportation evaluation. Its integrated framework ensures a consistent and accurate accounting of impacts that can be viewed from the perspectives of different stakeholders, geographic areas, time periods and modes. This enables unique insights into the nature of project and program benefits, and it provides extensive information supporting technical requirements for transportation system investment analysis. TREDIS and its components have been successfully applied in 43 U.S. states, and 7 Canadian provinces. The system is compatible with most currently available travel demand models, and accepts results obtained from a variety of air quality, economic forecasting, international trade, and commodity flow models and databases. In addition to modeling agency and user costs, TREDIS also includes the impact of transportation infrastructure improvements on GDP growth.
In order to carry out an assessment of potential cost savings for the Northeast Region, the SMART-IC will partner with the EDR Group of Boston, MA. EDR has developed a suite of economic analysis models for transportation called TREDIS, which provides Benefit-Cost Analysis, Economic Impact Analysis, and Financial Impact Analysis for transportation planning. Additionally, TREDIS incorporates wider economic benefits into transportation evaluation. Its integrated framework ensures a consistent and accurate accounting of impacts that can be viewed from the perspectives of different stakeholders, geographic areas, time periods and modes. This enables unique insights into the nature of project and program benefits, and it provides extensive information supporting technical requirements for transportation system investment analysis. TREDIS and its components have been successfully applied in 43 U.S. states, and 7 Canadian provinces. The system is compatible with most currently available travel demand models, and accepts results obtained from a variety of air quality, economic forecasting, international trade, and commodity flow models and databases. In addition to modeling agency and user costs, TREDIS also includes the impact of transportation infrastructure improvements on GDP growth.
Verify monitoring cost savings – Year 3: Monitor and verify costs of inspection from network-wide inspection program deployment activities and compare against historical cost data for conventional inspection programs, gathered from state DOT and municipal members of the SMART-IC.
Verify maintenance cost savings – Year 3: In partnership with state DOTs, monitor and assess the changes in road maintenance activities and associated costs from deployment activities, comparing these against a historical baseline (controlling for factors such as weather and total VMTs).
Quantify agency and user cost savings and economic growth– Years 1-4: Through an independent evaluation the EDR Group will quantify and project regional economic growth as described earlier. Utilize TREDIS suite to analyze effects of LCCA-based agency and user costs and assess the resulting economic impacts from the quantifications and projections described in Sections 1.1.8 and 1.1.9. VMT data will be used from states and FHWA, as well as other appropriate measures based on Highway Performance Monitoring System (HPMS), the National Bridge Investment Analysis System (NBIAS) and other conventional data sources. Three additional types of economic analysis will be conducted: benefit cost analysis (BCA), economic impact analysis (EIA) and financial impact analysis (FIA) as shown in Table 2.
Benefit Cost Analysis (BCA) will assess the relationship between user-benefits derived from improved system performance, and the costs and cost savings of implementing the proposed systems. These analyses incorporate both baseline conditions, e.g., current inspection practices and operational improvements under a changed inspection regime. Typically, life cycle costs for the baseline and improvements are compared along with user-benefits such as travel time-savings, improved reliability, and emissions reductions associated with congestion reduction. Additionally, TREDIS considers wider economic impacts of improved market access due to congestion reduction and safety benefits.
Economic Impact Analysis (EIA) will examine how improved business factors affect productivity, derived from reduced operating costs (labor, equipment, logistics support, etc.), and how this moves through the overall economy of a state or region. The effects of cost-savings on household expenditures and business operations are also assessed. Potential savings are examined due to increases in job creation, positive wage effects associated with job creation, increased GDP due to business cost-savings, and increased tax revenues due to higher business sales and revenues. These effects are assessed on an industry sector-by-sector basis as well as the ways that different sectors recover and pass through these savings to consumers.
Financial Impact Analysis (FIA) will examine the effects of implementation of the new systems on cash flow and monetized return on investment; costs are compared between current practice and new system implementation. This assessment examines the costs over time, taking into consideration both up-front capital costs and ongoing spending decisions. It will assess internal rates of return (IRR) as well as examine the differential in the IRR between public and private participants (including concession options), if these turn out to be important factors for consideration.
Baseline analyses using TREDIS will be conducted at a statewide level for regions in year 1. In subsequent years, more focused analysis on sub-state regions (multicounty regions, highway districts, MPOs and individual cities) will be conducted as prototypes as special pilot projects based on actual deployment data.
Quantify social cost savings – Year 3: Reductions in congestion-related emissions and those associated with improved surface conditions, quantified in 1.1.8.2, will be combined with pollution damage functions from the U.S. DOT TIGER program to estimate the social benefits of improved pavement monitoring and maintenance. Reductions in noise will be analyzed using the soon-to-be-released FHWA Traffic Noise Model 3.0, with extensions to valuation of health benefits. TREDIS will be applied to these economic results to assess the broader benefits of overall emissions reduction on economic growth.
Quantify potential nation-wide savings – Year 4: Estimate potential cost-savings from future implementation of the proposed programs in other regions of the country, using as a basis the results for staged implementation of the proposed network-wide inspection programs.
Additional data will be collected to evaluate performance metrics related to safety and congestion. The specific data sets and models that will be used are included in Supporting Documents Section 2.4.
1.1.10. Vision, Goals and Objectives
Applicant vision: In 2045 transportation infrastructure inspection in the U.S. will be continuous through distributed sensing, using a variety of mobile sensors for decision making. The RRSN architecture will be a network-wide management system allowing data to be imported from existing and new sensors and sensing systems collected by any future mobile data acquisition platform. The resulting data concerning infrastructure condition will be available in the cloud to all public and private stakeholders and fully integrated into a common cross-jurisdictional multi-modal management system.
Benefit of model deployment: The SMART-IC deployment provides benefits consistent with the ATCMTD model deployment expectations summarized in Table 3.
2045 Goals: The RRSN will be designed to produce significant cost savings in performing inspection that will lead to safer and less congested roads; measurable economic benefits to the region; significantly improved accessibility; reduced emissions; and measurable public benefits (e.g., access equity, consistent with the SMART-IC goals identified in Section 1.1.2.).
2045 Objectives:
- Increase overall transportation infrastructure asset values by prioritizing maintenance investments based on actual condition and performance outcomes and realize the SMART-IC goals described in Section 1.1.2.
- Fully integrate the RRSN into routine inspection functions within state and local agencies.
- Deploy a cross-jurisdictional management system to public and private agencies to direct multi-stakeholder decision-making and inform usage demand for different modalities.
- Deploy the RRSN across the Northeast Megaregion and extend dissemination efforts in other U.S. megaregions.
- Provide incentives for vehicles of opportunity already on the highway network to install multipurpose distributed sensing for infrastructure-related timely decision making.
SMART-IC Vision: The SMART-IC the consortium that will manage the deployment of the RRSN and contribute to the realization of the Beyond Traffic 2045 vision. SMART-IC will become an established private-public collaboration to provide a functional mobile sensing network and an effective asset management system integrated into state-level and local agency functions for pavement and bridge deck inspection encompassing the New England and the Northeast Megaregion.
SMART-IC Goal: Implement a 4-year deployment beginning within the New England region and extending throughout the Northeast Megaregion by engaging counties, cities and towns with a demonstrable cross-jurisdictional multimodal cost-benefit tool for inspection, maintenance decisions, U.S. economy, environment, access, and long-term financial benefits.
SMART-IC Objectives:
- Create partnerships across industries, state agencies, and municipalities to identify collective challenges and solutions and thus identify how to best deploy the RRSN to meet the needs of all stakeholders.
- Deploy an integrated multi-modal management system for the Northeast Megaregion for use at the state, county, and town levels.
- Demonstrate effectiveness across demographics including urban, rural areas, and varied population income levels.
- Demonstrate measurable safety, economic and environmental long-term benefits.
- Develop data management tools that can adapt to changes in hardware and changes in inspection methodologies to be used up to 2045.
- Integrate data and decision-making activities into a network-wide framework.
- Create a governance structure for SMART-IC that is sustainable beyond ATCMTD funding and promote deployment in additional areas of the U.S.
The SMART-IC goals, objectives, and activities are aligned with the following ATCMTD goals:
- Reduced costs and return on investments, including through the enhanced use of existing transportation capacity: The RRSN results in improved management decisions and enables long-term planning resulting in cost-efficient technology to support inspection at lower costs resulting in enhanced use of transportation capacity. Assessment activities will quantify savings.
- Delivery of environmental benefits that alleviate congestion and streamline traffic flow: The in-traffic inspection made possible through the RRSN will reduce the need for road closures streamlining traffic flow. Life cycle decision-making will lead to improved road condition. Assessments will quantify cost-reductions and environmental benefits.
- Measurement and improvement of the operational performance of the applicable transportation networks: The impact analysis incorporating multimodal systems will include a network analysis to measure operational performance improvements.
- Reduction in number and severity of traffic crashes and an increase in driver, passenger, and pedestrian safety: In-traffic inspection, improved planning, integrated decision making across jurisdictions will reduce closures and maintenance also improving safety. Assessments will quantify to what extent a reduction of road closures reduces crashes and increases safety.
- Collection, dissemination, and use of real-time transportation related information: The network-wide management system is designed to collect and disseminate data on demand and can intake data integral to inspection as they become available, including available real-time data. This data can be integrated with other ITS-related systems. Dissemination of the RRSN collected data will lead to improvements in mobility, access, and the economy.
- Monitoring transportation assets to improve infrastructure management and positively impact maintenance, investment decisions, and repair: The RRSN will continuously monitor pavements and bridge decks resulting in asset-related decisions with the goal to reduce costs, guide investment decisions, and ensure infrastructure improvements.
- Delivery of economic benefits: In-traffic inspection will reduce congestion and delays leading to economic benefits, especially for freight and overall improved system performance. Evaluations will quantify economic benefit to agencies, regions, and the nation to demonstrate the financial impact of the SMART-IC integrated network-wide management systems and its associated sensors.
- Accelerated deployment of vehicle-to-vehicle; vehicle-to-infrastructure advanced technologies: RRSN ensures core transportation infrastructure remains functional, a fundamental requirement for advancement in V2V or V2I technologies. Once deployed, RRSN can communicate roadway hazards (e.g., potholes) to other drivers or vehicles. If inspection results in a reduced load rating, connected infrastructure can alert oncoming vehicles if weight is not permitted in certain network regions.
- Integration of advanced technologies into transportation systems management: RRSN will shift asset management from current functions to an adoption of the measurements required from advanced technologies into a single management system.
- Demonstration, quantification, and evaluation of impact on safety, efficiency and the movement of people and goods: RRSN's impact, as it is deployed in New England states, will be quantified in an extensive external evaluation focused on environmental, safety, access, and economic impact.
- Reproducibility of successful systems and services and knowledge transfer: A SMART-IC priority is to develop a system transferable to other megaregions; it will leverage previous NIST and FHWA investments (e.g. VOTERS and TSD).
1.1.11. Plan to Partner with Private Sector and Public Agencies
Multiple Departments of Transportation and municipalities have acknowledged the value of the RRSN and indicated their strong interest in supporting its deployment and a partnership (see support letters included with Supporting Documentation Section 2.2). The SMART-IC is the vehicle for public private partnerships. The SMART-IC is building on existing relationships between academic researchers, DOT research departments, and municipality innovation offices. The letters included in Section 2.2 are representative of the partnerships that SMART-IC will forge between technology providers, researchers and agencies. Participating universities already have ongoing partnerships with state DOTs and MPOs; the University of Vermont administers the New England Technology Consortium, a collaboration across all six New England DOTs. University of New Hampshire faculty researchers collaborate with the NH-DOT in pavement indicators; faculty at the University of Rhode Island and Roger Williams University work with the RI-DOT on bridge inspection and monitoring; and faculty at the University of Vermont collaborate with VT-DOT in the use of ground penetrating radar for pavement evaluations. In addition, Northeastern, the University of Vermont, and Infrasense have previously successfully collaborated in the development of the NIST-funded VOTERS technology. The SMART-IC will successfully build on these existing partnerships to create a sustainable, multijurisdictional partnership for network-wide inspection.
Northeastern University will leverage the U.S. DOT Beyond Traffic Innovation Center network to expend SMART-IC and disseminate technology and practice to other U.S. megaregions. Agencies related to these different modes of transportation will be invited to join SMART-IC. A SMART-IC advisory board will be formed with representatives from stakeholder organizations such as AASHTO, NASTO, TRB, other policy-setting organizations, and representatives from asset owners in other U.S. megaregions. The steering committee and subcommittee structure of SMART-IC enables the consortium to adapt its governance when new members are added who may represent different concerns. Northeastern's Office of Government Relations will be engaged with the Governor's Office for each New England state to garner support for the State DOT during the grant period and to sustain the RRSN after the grant period ends. Furthermore, the College of Engineering will provide SMART-IC headquarters a space as a meeting area for consortium members (Support letters from Provost Bean and Dean Aubry included in Supporting Documents Section 2.2).
Private sector engagement includes technology developers and service providers (StreetScan, Infrasense, and Greenwood Engineering through SMART-IC member Infrasense), whose participation enables them to respond to the challenges encountered in the field. Information technology firms that will be invited to join SMART-IC include ESRI for GIS systems, Caliper for transportation modeling, and GE, creator of PREDIX enterprise software, which incorporates data from multiple sources for the objective of optimization. RRSN's current partnerships with these industries enables SMART-IC to have access to the most recently developed technology and information technology trends.
1.1.12. Plan to Leverage and Optimize Existing Resources
This initiative's technology development will leverage over $20 million in prior investment for sensing technology. This is a positive context for expanding the RRSN technologies. Multiple roaming sensors have already been developed and deployed in a limited way by SMART-IC team members and others associated with highway agencies in the U.S. and abroad. In addition, this proposed project builds on an investment by NIST that produced the VOTERS prototype that collects inspection data at highway speeds. Michael P. Collins, Commissioner of Public Services for the City of Beverly advocates for the value of the sensor technology integrated with the management system in Supporting Document 2.2. In addition, Federal Highway "pooled" funds have been used to compare network level structural pavement evaluation technologies that collect data at highway speeds. As shown in Figure 1, the goal of the SMART-IC is to ramp up this deployment to a scale where the impact on infrastructure management can be documented and quantified, and thus the stage is set for changing highway agency management practices through widespread and permanent implementation of new systems. The New England region represents an ideal initial deployment region for this effort. The close proximities and shared climatic and construction conditions will facilitate the implementation of cross-jurisdictional collaboration and deployment. In addition, as described in supporting letters in Section 2.2, participating agencies will provide legacy and current inspection data and expertise along with other contributions.
1.1.13. Schedule for Technology Deployment
The Deployment schedule across all SMART-IC team members is shown in Table 4. This schedule will be replicated in years 2 to 4 following the initial deployment plan described in Section 1.1.6. Tasks for economic, environmental and safety studies conducted by the university partners are in Section 1.1.8 and 1.1.9.
1.1.14. Integration with ITS Program or Innovative Technology Initiatives
New England, and eventually the Northeast Megaregion, will demonstrate to the whole nation how to deploy advanced sensing and data management technologies that ensure that the transportation infrastructure can fulfill its role as the backbone of all forms of transportation. Without functioning and properly maintained roadways and bridges, it is not possible to ensure safe and efficient mobility, and a lack of attention to this slows the growth of advancements in mobility, such as connected vehicles, autonomous vehicles and safety features.
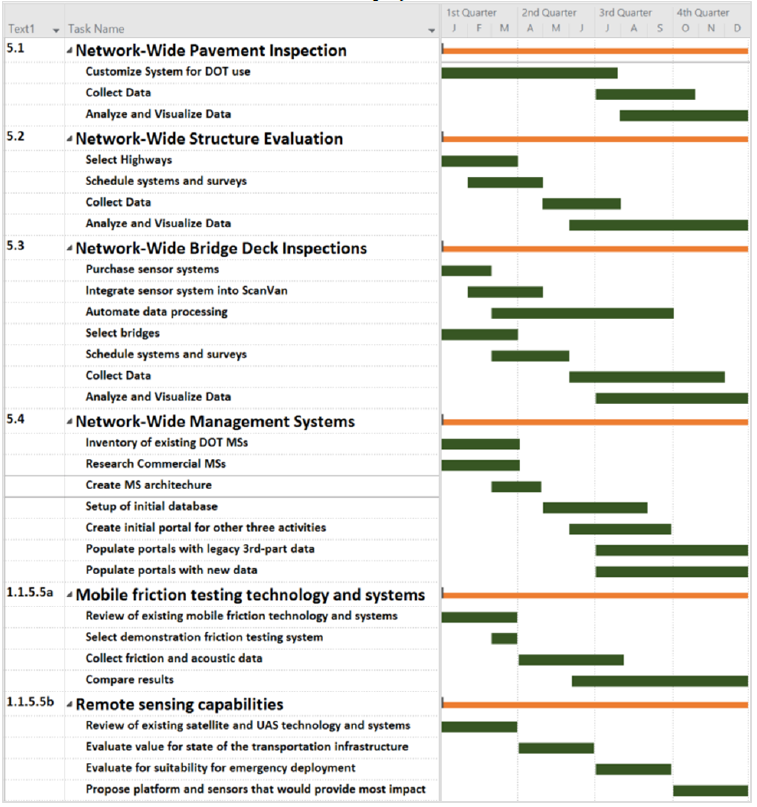
The ITS report mandates continued support for research, testing and demonstration of innovation that will understand and find solutions for an aging infrastructure within a complex, multimodal, connected transportation network. The Northeast SMART-IC is a direct response to this mandate. In addition, Beyond Traffic 2045 (p. 183) identifies policy options that directly correlate to the expected outputs from the SMART-IC:
- Incentivizing coordination across jurisdictions.
- Strengthening planning and project development.
- Improving data collection-analysis capabilities and enabling transportation programs to become more performance based.
- Quantifying economic benefits and lifecycle costs of projects to aid in maintenance and investment decisions.
The plan outlined in this project description addresses all of those requirements, creating a management platform that will be forward-compatible, i.e., able to handle new data from V2V or I2V sensing and include them in embedded analysis tools. Since all SMART-IC-deployed technologies operate in traffic, they are contributing to reducing one of the three main causes of nonrecurring congestion by reducing the need for certain inspections in work zones (Sections 1.1.5.2 and 1.1.5.3).
1.2. Staffing Description: Redacted
Redacted
Redacted
Redacted
Redacted
Redacted
Redacted
Redacted
Redacted
Redacted
Redacted
Redacted
Redacted
Redacted
Redacted
Redacted
Redacted
Redacted
Redacted
Redacted
Redacted
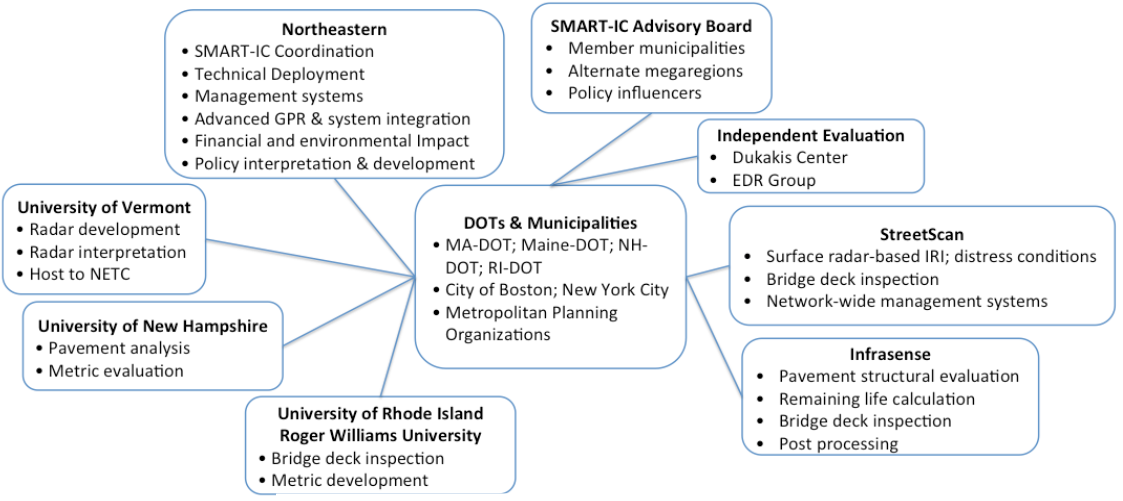
Redacted
Redacted
Redacted