DATA-DRIVEN, ACTIVE, AND CONNECTED DRAWBRIDGE AND TRAFFIC NETWORK MANAGEMENT SYSTEM: Advanced Transportation and Congestion Management Technologies Deployment Initiative (ATCMTD) Grant Application Miami-Dade County, Florida - Volume 1 Technical Application
A. Project Description
1. Introduction
Miami-Dade Department of Transportation and Public Works (DTPW is seeking Advanced Transportation and Congestion Management Technologies Deployment Initiative (ATCMTD) program funds to implement innovative transportation technology solution to address the overwhelming traffic congestion that impacts the residents of Miami-Dade County with focus on the Downtown Miami area.
Problem Description
The USDOT dynamic mobility applications (DMA) of connected vehicles, Active Transportation Management (ATM), and Integrated Corridor Management (ICM) initiatives have demonstrated the effectiveness of utilizing advanced traffic management strategies integrated with traveler information systems to improve system performance and the potential of using connected vehicles to increase this effectiveness. Southeast Florida has a significant deployment of ATM strategies and applications, particularly on freeways. However, there is a limited deployment of ATM strategies on many critical urban streets in the region, particularly in Downtown Miami. In addition of the significant impacts of incidents and construction activities facing metropolitan areas around the nation, Downtown Miami faces other major issues including: 1) operations of drawbridges over the Miami River that cause significant mobility and reliability impacts, 2) the increased number of railroad activity with temporarily disruption to traffic and pedestrian movements, 3) special events at the Miami American Airlines Arena and other venues in downtown, and 4) growth of businesses, commercial developments, entertainment venues, tourism, and high rise dense residential areas that adversely impacts the network operations.
Deployment Site
Florida is the third most populous state in the United States. Miami is Florida's largest metro area with Greater Downtown Miami as its hub and is ranked in the top 15 large metropolitan areas with the worst traffic congestion. Commuters spend an average of 29.9 minutes1 traveling to work, with an average speed of 17.25 mph for the typical commute distance of 8.6 miles2. Miami commuters spend 15% more time than the average commuter in the United States. This congestion delays commuters making work trips and slows vehicles engaged in commerce.
Downtown Miami is an economic engine in Miami-Dade County and the cultural, financial, and commercial center of South Florida. More than 88,540 people live in Downtown Miami (33% increase from 2010), and is expected to exceed 100,000 by the year 20203. With a density of 23,300 persons per square-mile and over 235,000 people coming into Downtown daily, proximity to the PortMiami and access to main waterway, the Downtown area attracts high volumes of vehicular, pedestrian, and boat traffic. Approximately 66% of Downtown traffic is generated as a result of the nearly 148,000 people working in the area, in addition to increasingly dense high-rise residential zones occupied mainly by young professionals. Due to the diversity of land uses and the density of the area the peak traffic periods frequently exceed the typical two (2) hour peak period. Traffic congestion is exuberated by drawbridge operations during peak traffic hours. Three (3) major drawbridges (Brickell Ave., South Miami Ave. and SW 2nd Ave.), located over the Miami River, connect Downtown Miami to the Brickell areas, which is the main financial district in South Florida and also a dense high-rise residential neighborhood. Brickell Avenue is congested in a large part due to scheduled and on demand bridge openings. During the PM peak period, every bridge opening on Brickell Avenue takes on average 7 minutes, impacting 400 vehicles and taking 15 minutes for the entire queue to be dissipated4. It is estimated that every bridge opening during peak congestion causes $40,000 of lost economic activity to Downtown Miami businesses. In 2014, an estimated total of 17,327 business trips were affected by these bridge openings during lockdown periods, resulting in $12,237,145 in lost productivity for Downtown Miami's economy, and translated into 141,388 gallons of gasoline, and 246 metric tons of CO2 emissions.5
This project is proposed to deploy Connected Vehicle (CV) infrastructure combined with conventional ITS devices and active traffic management strategies to expedite the deployment of proposed technology designed to decrease congestion and wait time exacerbated by the raising of drawbridges. The proposed project consists of installing On-Board Units (OBUs) on a sample of vehicles which will receive traveler information and transmit Basic Safety Messages (BSM) to Roadside Units (RSUs) located in the area surrounding the bridges, and this information will feed the County's central system, which will analyze and predict traffic patterns, and send special signal timing plans to key intersections that could can serve the detour and information to connected vehicles and dynamic message signs (DMS) regarding these detours. The system will be supported by data analytic, performance measurement, and advanced modeling analysis. The components of the proposed system are listed below and detailed in the following sections.
- Connected Vehicle Technology Deployment. Connected vehicle Dedicated Short Range Communications (DSRC) DSRC Roadside Units (RSUs) at critical intersections in the vicinity of the bridges and Onboard Units (OBUs) to provide information to travelers approaching bottleneck locations, worn of the back of queue, and collect information from the vehicles using SAE J2735 message sets.
- Traffic Performance Monitoring (readers funded by DTPW). Traffic performance monitoring subsystem including microwave detectors (for volume measurement) and Bluetooth/Wi-Fi readers (for travel time and origin-destination measurement) at critical segments on routes in the vicinity of the bridges.
- Closed Circuit Television (CCTV) cameras (funded by DTPW). CCTV cameras will be used by system operators to monitor the performance of the system at the drawbridge crossing and critical intersections in the downtown network.
- Incident Detection. Incident detection component that utilizes traffic performance monitoring system data and data from the WAZE's Connected Citizens Program.
- Arterial Dynamic Message Signs. Arterial DMS at critical locations to supplement the RSUs in providing information to non-connected vehicles about various events including the bridge opening and providing alternative routes, in some cases.
- Central Components. 1) Central components that collect data from multiple sources and communicate messages to travelers using OBUs and DMS. 2) Central component that implement special signal timing plans at the signal controllers on the approaches to the bridges and alternative routes based on the prediction of the impacts of the bridge opening and the estimated diversion to alternative routes.
- Data Analytic-Based Decision Support System. Data analytic-based decision support system that include performance dashboard and analysis component that will collect data from multiple sources, estimate system performance (in terms of mobility, reliability, safety, and emission) and intersection measures based on high resolution controller data that suggest revision to the management strategies based on the performance measures including the revision of bridge opening schedule, diversion estimation, and special signal plan implementation.
- Fiber Optic Communication Subsystem (funded by DTPW). Fiber optic communications including equipment, installation, and cabinet.
- Intersection Controller and Detection Replacement and High Resolution Controller Data (funded by DTPW). Replacement of existing 170 controllers for critical intersections around the drawbridges in Downtown Miami with 2070LX controllers that have adaptive signal control capabilities and processors to interface with the RSU and replacement of intersection loop detectors with video image detectors
- Modeling System. Modeling component that involves the utilization of a mesoscopic simulation-based dynamic simulation traffic assignment model to determine the diversion to alternative routes given the origin-destination of drivers and signal optimization models combined with microscopic simulation to derive the signal timing plans and their impacts.
Project Scalability and Replicability
What sets DTPW's proposal apart from others is the scalability and replicability possibilities of the project. If successful, the project offers a spectrum of use-case applications (e.g., drawbridge operations, at-grade railroad crossings, special events, incidents among others) and deployment possibilities resulting from the combination of the project partnership managing the program; the integration of different facility types and operations which provides opportunities to deploy a wider range of AV and CV applications; the integration of existing and planned investments from different facilities to further advance AV and CV technology deployments; the project scalability resulting from the centric location within the South Florida Region, linking the deployment site with major regional commuter, transit and freight corridors, international airport, intermodal centers, educational institutions and major seaport, facilitating future extensions.
The deployment of the advanced technology, paired with traffic management center operations, and central software will maximize the use of our resources by increasing traffic capacity through enhanced real-time traffic management and planning for operations, therefore reducing delays, traffic congestion and greenhouse gas emissions. It should be emphasized that an important aspect of the connected vehicle deployment of this project is to familiarize the County with this technology to allow more advanced CV applications in the future and as the market penetration of CV increases with the USDOT mandate. As such, the CV component of this system will provide the foundation for additional applications in Downtown Miami including connected vehicle-based SPaT messages, pedestrian and bicycle safety, bus priority and other transit CV applications, and railroad crossing operations. These applications are not covered by this project but will be done in a future phase.
In addition to the significant benefits from the funded applications and future applications that are built on the funded applications to the County, region, and the State of Florida; it is expected to generate information that will support the USDOT CV effort. The DSRC-based CV deployment, as Miami, will serve to demonstrate this capability in an area with high building density but not as dense as New York City (NYC) from elevated skyline standpoint. Tall buildings have produced the "canyon effect," which may be a problem in NYC. It will be of interest to capture the data for Miami-Dade County and compare it to the data from NYC. In addition, the proposed project will demonstrate the use of data analytic and modeling components as part of a decision support system to support management activities, of which drawbridge management is just an example. Such management activities will include applications ranging from incident management, to work zones, to railroad crossing management. The following sections discuss in more details the components of the management system proposed to be implemented as part of this request.
2. Entity Description
Miami-Dade Department of Transportation and Public Works (DTPW) is proposing to enter into an agreement with the Federal Highway and Administration (FHWA) and is the leading entity for the deployment of the "Active Traffic Management for Drawbridges in Miami-Dade County" project. DTPW has reviewed Title 2 CFR §170 dated September 14, 2010, and Appendix A thereto, and understands the requirement, has the necessary processes and systems in place, and is prepared to fully comply with the reporting described in the term if it receives funding resulting from this Notice.
The proposed project team is a partnership between DTPW, Miami Downtown Development Authority (DDA), Florida International University (FIU) and Siemens, which will provide technical expertise and guidance for the implementation of the proposed project. In February 2016, Miami-Dade County consolidated all departments and divisions that managed aspects of mobility improvements and services, such as transit, traffic engineering, traffic signals and signs, highway design, and the regulatory arm for for-hire transportation services (i.e. taxis, limos, and transportation network companies) to form the new Department of Transportation and Public Works. DTPW is responsible for an extensive roadway and transit network serving all cities within the County and includes:
| Network Components |
Description |
|---|---|
| Roadway | 7,680 paved lane miles, 20 percent of which are major arterial roadways |
| Sidewalks | over 18 million linear feet |
| Fixed and drawbridges |
209 |
| Drainage canals | 171 miles |
| Traffic signals | 3,000 −connected through the ATMS |
| Street lights | 26,400 to be converted to smart LED grid with communication capabilities |
| Traffic signs | over 1 million |
| Bus service | 29 million revenue miles (98 routes/846 buses) |
| Heavy rail | 25-mile dual track |
| Metromover | 4.4 miles |
| Parking spaces | 9,773 at garages and over 3,253 surface spaces |
Transit services are provided via four modes: Metrobus (bus system), Metrorail (elevated rapid train), Metromover (electrically-powered, fully automated people mover system and fare-free service), and demand-response paratransit service (known as Special Transportation Service or STS).
The department's main objective is to improve the mobility, reliability, and sustainability of the transportation networks as part of a wider goal of providing more vibrant, livable, sustainable cities, improving the quality of life, and creating ladders of opportunity for the Miami-Dade County residents, businesses, visitors and commercial deliveries. DTPW is moving away from the traditional role as a fixed-route service operator, and towards collaboration with other transportation providers, both public and private, to create a full range of well synchronized mobility services within the community.
The proposed project will be managed via a partnership established under a Memorandum of Understanding (MOU) and governed by a Steering Committee composed of six representatives of Miami-Dade County, DDA, Florida Department of Transportation (FDOT), City of Miami, and FIU, and chaired by the Miami-Dade County Mayor as the seventh voting member. A Management Team will regularly report to the Steering Committee and will coordinate and oversee the project activities through its own staff as well as consultants, industry collaborators, and subject matter experts.
3. Geographic Area
Miami-Dade County. Miami-Dade County is the most populous county in Florida, and the 8th most populous in the nation. The County has a total urbanized population of approximately 2.7 million and is projected to exceed 3.3 million residents by 2040. Miami-Dade County includes 34 municipalities and with over half of the population living in unincorporated areas.
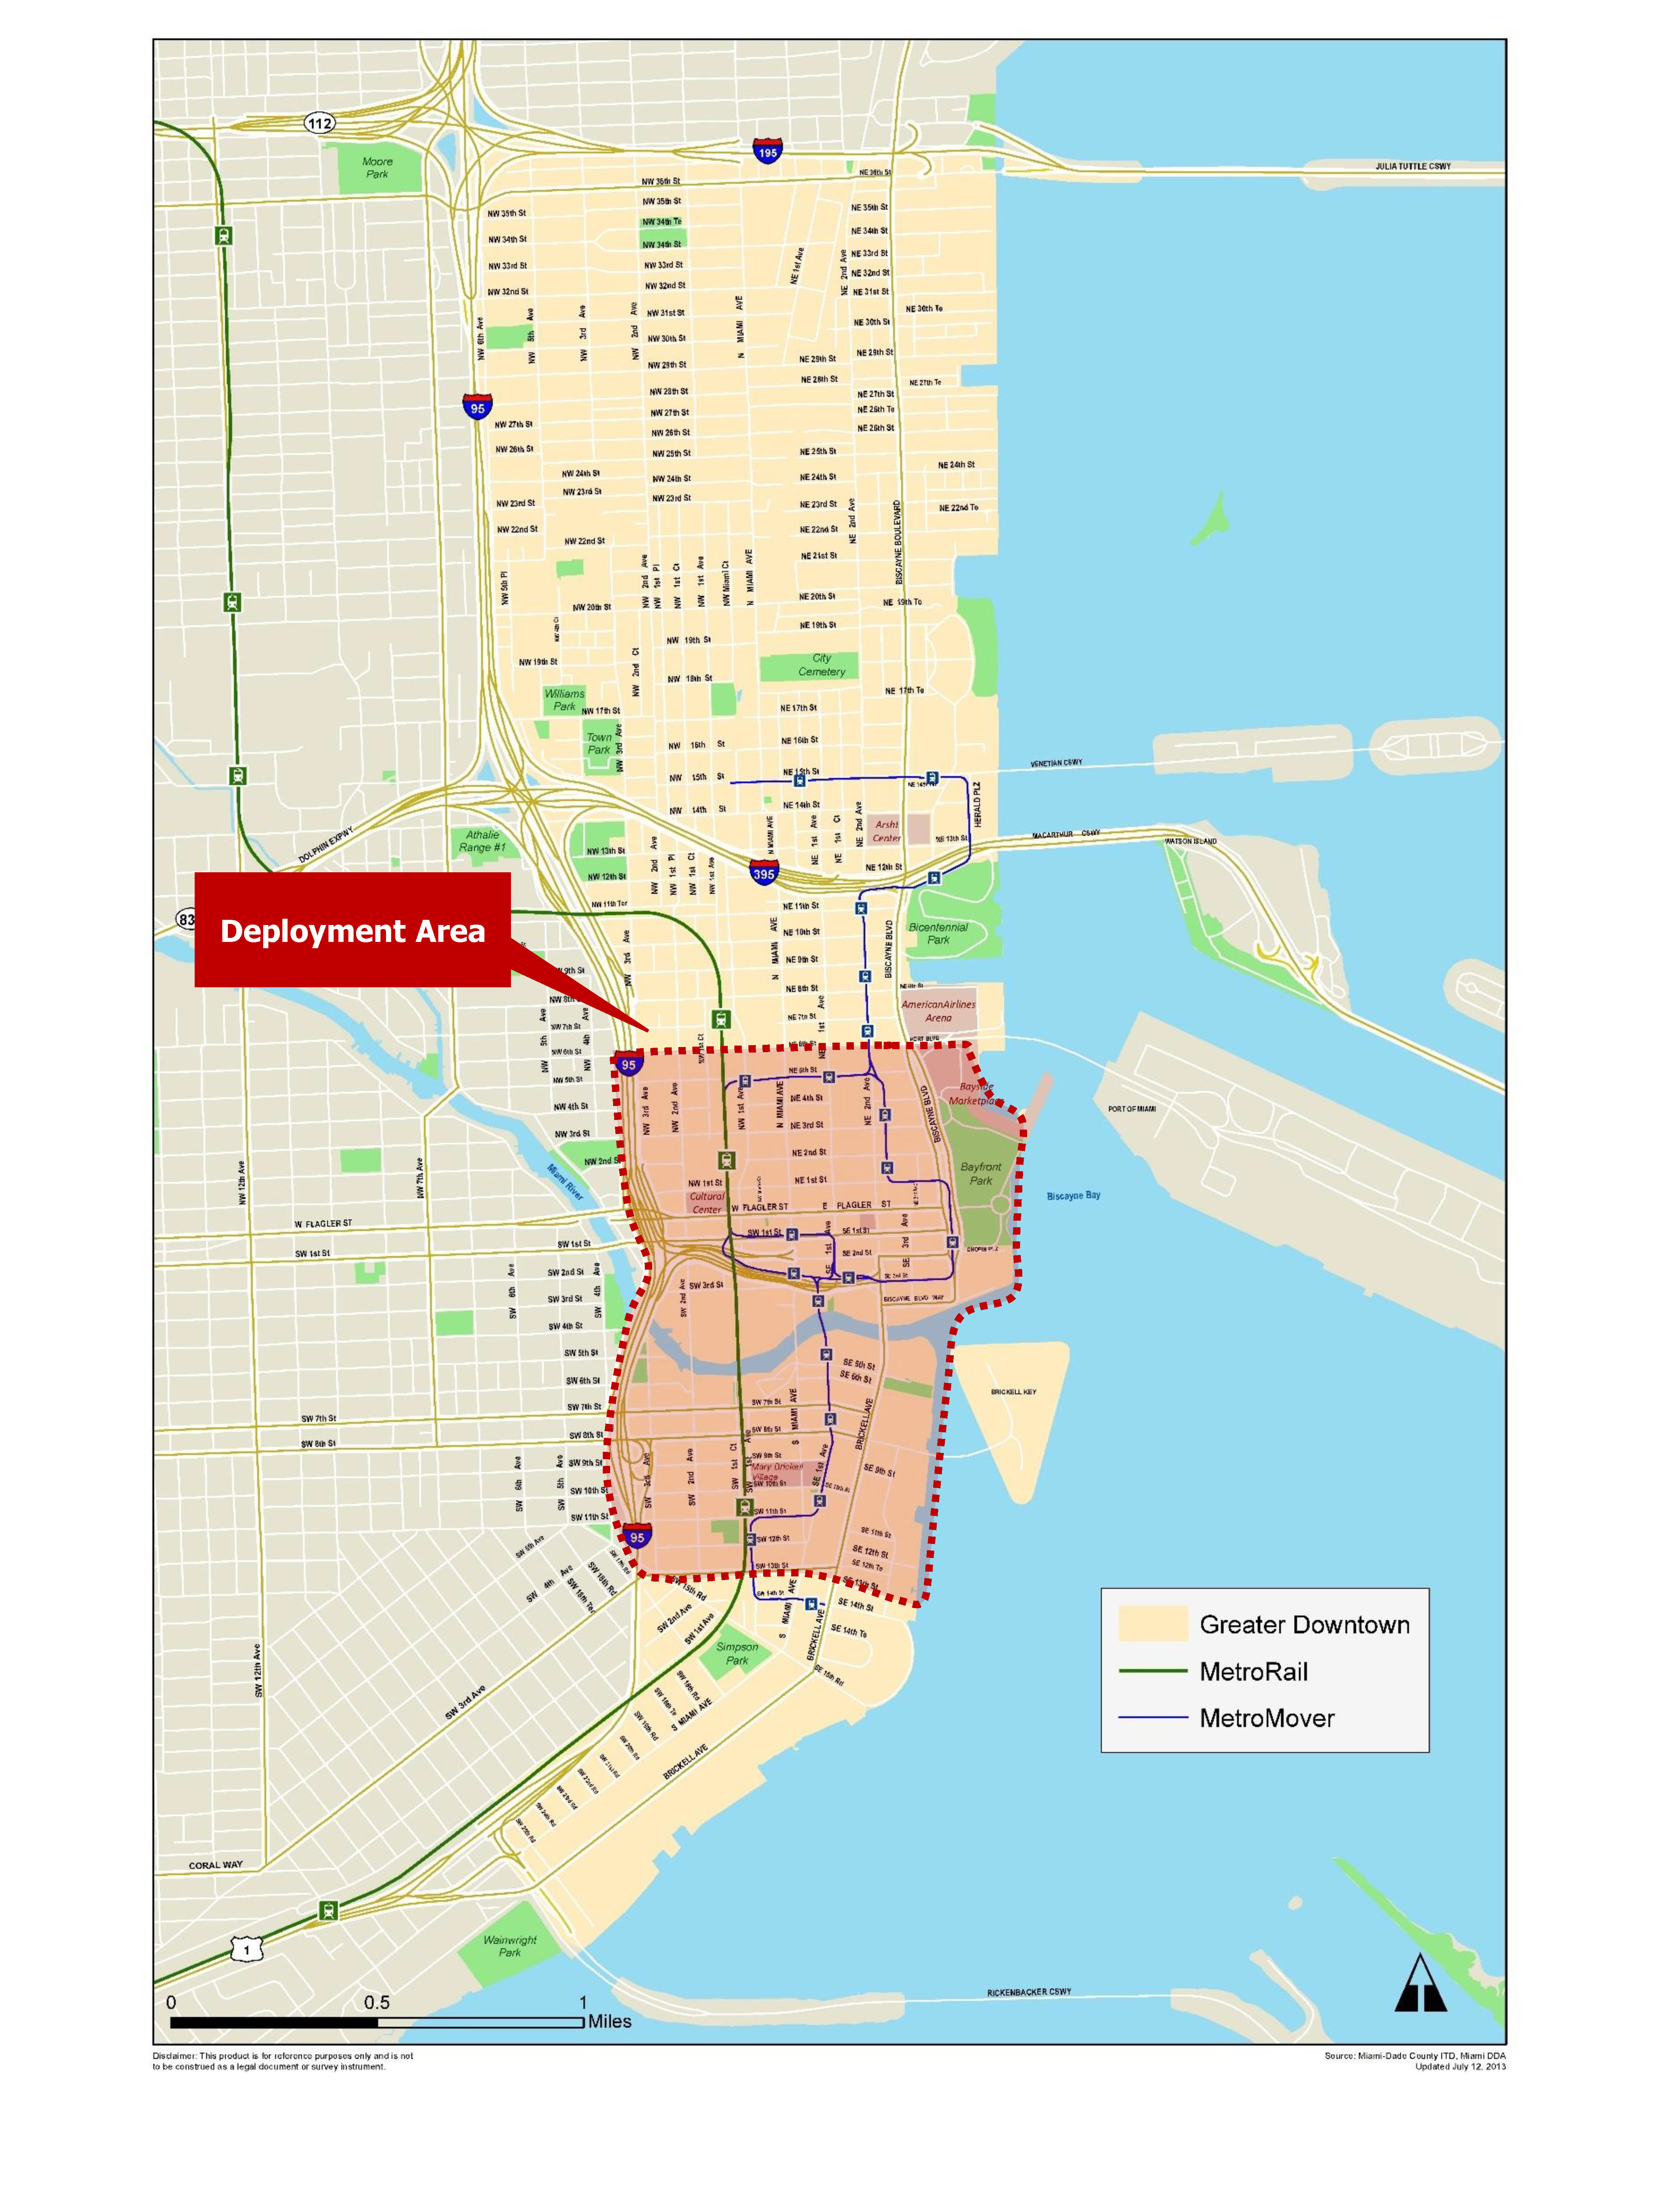
Greater Downtown Miami. The proposed technology deployments will be conducted in Downtown Miami where they will build on assets that either exist or are already planned for implementation and operation. Downtown Miami is an emerging major world city and the business, social and cultural epicenter of the Americas. Located in the City of Miami, the most populous city in the County, Greater Downtown is a 3.8 square-mile area of prime waterfront real estate in tropical Miami with a population of 88,540 residents, 23,300 persons per square mile and over 235,000 daily visitors. It is situated between Interstate 95 (I-95) on the west and Biscayne Bay on the east, the Julia Tuttle Causeway on the north, and the Rickenbacker Causeway on the south. Miami Downtown consists of three neighborhoods, the Brickell Financial District, the Central Business District (CBD), and the Arts & Entertainment District and provides access to PortMiami. Greater Downtown also includes Wynwood, Edgewater, Midtown, and Historic Overtown. The Miami River crosses the area providing access to main waterway. There are three (3) drawbridges crossing the Miami River, connecting the Downtown and Brickell areas.
Model Technology Deployment Site
The technology deployment site is bounded by NE/NE 6th St. to the north, SW/SE 13th St. to the south, Brickell Ave. and Biscayne Blvd. to the east, and I-95 to the west. There are three (3) drawbridges within the project area located less than 500 ft. apart along the Miami River, Brickell Ave. Bridge, South Miami Ave. Bridge, SW 2nd Ave. Bridge, which are owned by FDOT. A map of the Greater Downtown Miami area and the technology deployment site is shown in Figure 1.
4. Transportation System
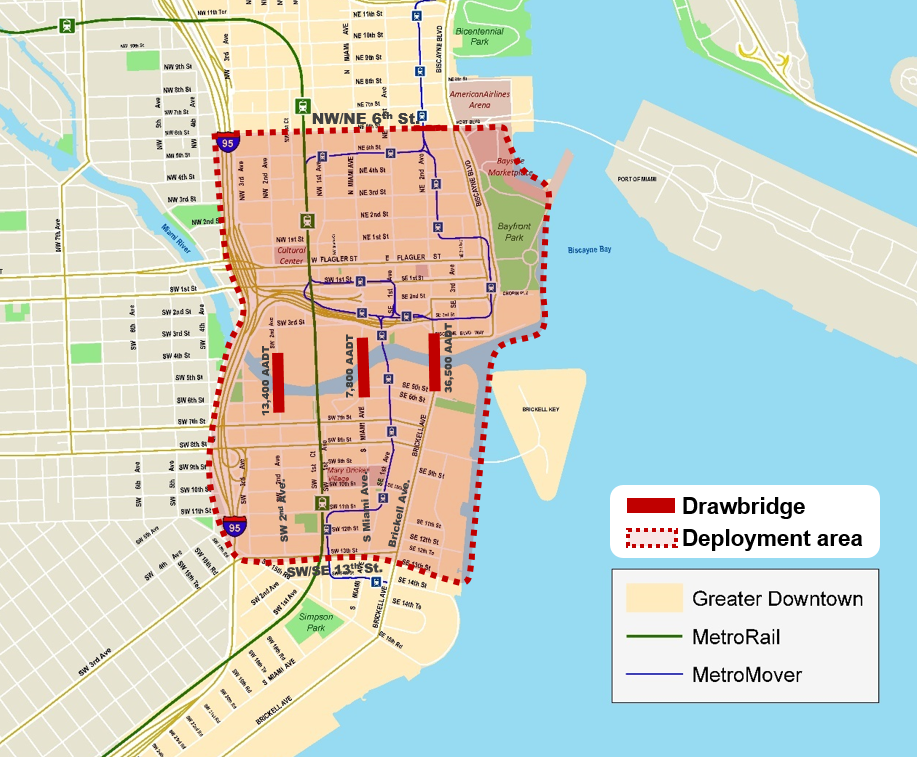
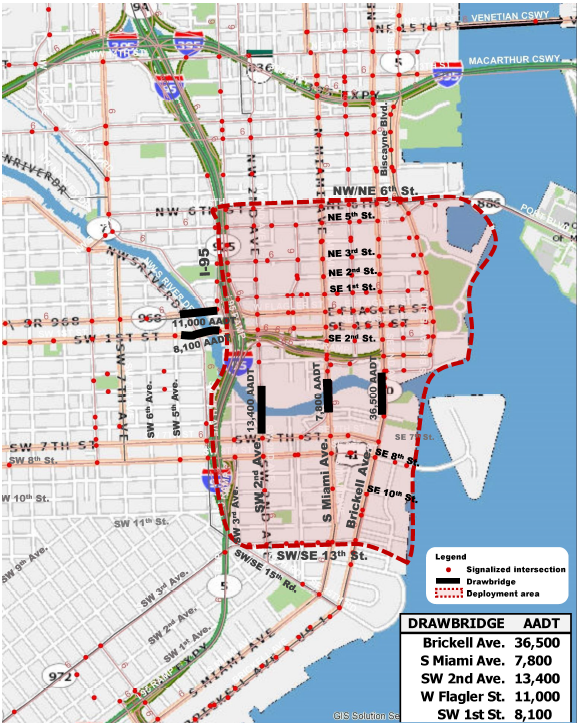
The proposed technology deployment will have an impact on major roadways on the north-south corridor (Brickell Ave. and Biscayne Blvd.) and east-west arterials (Flagler St., SW/SE 7th St. and SW/SE 8th St.) connecting Downtown Miami and the western part of the County. The street network within project site counts with over 100 signalized intersections and three (3) drawbridges (Brickell Ave. Bridge, South Miami Ave. Bridge and SW 2nd Ave. Bridge) that operate on schedule and on demand. Under Federal Law, these bridges are not permitted to open to vessel traffic during peak traffic periods: 7:35 AM to 8:59 AM, 12:05 PM to 12:59 PM, and 4:35 PM to 5:59 PM Monday thru Friday with the exception of federal holidays. Vessels that are exempt from the curfew regulations include tugs, vessels under tow, government vessels, and vessels in distress. In addition, the project site is served by the Metromover system, an elevated automated people mover system carrying an average of 32,000 passengers per day. Figure 2 and Figure 3 illustrate the roadway network, traffic signal system, Metromover system and drawbridges within the deployment site.
The Brickell Ave. Bridge is easternmost bridge over the Miami River and is the most congested roadway with an average annual daily traffic (AADT) of 36,500 vehicles and multiple bus routes serving the corridor. On average, the bridge has a boat traffic of 560 vessels per month and 386 openings per month, processing 2 vessels per opening. Additionally, the bridge opens between 2 and 3 times in peak hours, including openings during buffer times (prior and after curfew hours).
The proposed intelligent traffic signalization technologies including smart traffic detection and tracking technologies, smart ITS infrastructure, and signal operating strategies will be deployed within the defined area.
Proposed Technology Deployment
The proposed project will utilize dedicated short range communication (DSRC)-based connected vehicles and conventional intelligent transportation system technology to support decision support systems and traveler information system strategies to manage traffic operations in the vicinity of three (3) critical drawbridges in Downtown Miami during bridge openings, railroad crossings, special events, and incident conditions. The following sections discuss in more details the components of the management system proposed to be implemented as part of this request.
Connected Vehicle Deployment
The proposed connected vehicle deployment will include DSRC Roadside Units (RSUs) at critical intersections in the vicinity of the bridges and Onboard Units (OBUs). A total of 35 units will be installed. It is assumed that each RSU will be able to communicate with equipped vehicles within a 300-meter radius line of site for CV data collection and for disseminating information to motorists. The RSUs will be connected to the central software (Siemens Concert).
A total of 175 OBUs will be installed on Miami-Dade County vehicles, transit vehicles, public agency vehicles, taxis, and ridesharing vehicles (e.g., Uber and Lyft); in addition to drivers recruited from office buildings, businesses, and high-rise residential buildings located in Downtown Miami and Brickell Avenue area. A main criteria in the recruitment will be the number of times and times of day that the selected vehicles cross the three drawbridges, as well as to maximize the benefits of installing the RSU on a vehicle. Lessons learned from the USDOT connected vehicle projects will be utilized in the recruitment process.
Prior to the activation of drawbridge opening to allow a ship to pass, information about the time of the expected bridge opening and closing will be sent from the bridge location to a central software (Siemens Concert), resulting in invoking a strategy management module. The module may also be invoked manually by an operator at a central location. The Siemens Concert system will transmit messages to specific RSUs in the area surrounding the bridge. The RSUs receiving these messages will send the messages to OBUs within their geo-fence zone informing them of the bridge operations and warning them of the back of queues to reduce rear-end crashes in the vicinity of the drawbridge.
Similar processes will be activated during incident conditions and special events. In these cases, the existing traffic management software at the traffic management center will initiate center-to-center messages to the Concert system with information about the various events and traffic conditions. The existing traffic management software (SunGuide) will communicate with the point traffic detectors and Bluetooth readers, installed as part of this project, to collect travel time information and data for use in incident detection and share this information with the Concert software. In addition, FDOT and Miami-Dade County currently has an agreement with WAZE to supply incident information. This information will also be sent by the SunGuide software to Concert and will be utilized as part of this project in conjunction with data collected using the traffic performance monitoring system.
Data will be collected by the RSUs using the SAE J2735 standards. Data items such as speed and acceleration, and other data items will be collected from the vehicles and used in traffic management and for archive to be used as part of the data analytics and diversion modeling utilized in this project, as described later in this application.
Traffic Performance Monitoring System
In addition to collecting data based on messages received by the RSUs, the proposed system will include an additional traffic monitoring components in the vicinity of the three drawbridges. This system will include 20 point detectors and 20 Bluetooth readers. The point detectors will be microwave detectors (from Wavetronix) that collect traffic, speed, and volume data at 20-second intervals. The Bluetooth readers will be able to collect Mac address identifications for use in travel time estimations and also for origin-destination estimation, which is important to identify the diversion route plans.
The traffic detectors and readers will be connected to the regional SunGuide software allowing the estimation of system performance measures, incident detection, and data archiving for use in the data analytic tool, as described earlier. The SunGuide modules that support real-time traffic performance monitoring and estimation in the SunGuide software are the Traffic Detection (also known as the Transportation Sensor Subsystem (TSS)) module and the Travel Time module that accept data from point detectors and AVI data such as those from Bluetooth readers. In addition, SunGuide has a data sharing with third party vendors module that receives travel time from HERE and incident information from the WAZE's Connected Citizens Program. The SunGuide system will share the derived information in real-time using center-to-center communications with the Concert software. In addition, 12 CCTV cameras will be installed at the drawbridge locations and critical intersections to allow the verification of incident conditions.
Controller, Intersection Detector, and Communication System Upgrade and High Resolution Controller Data Utilization
The proposed project will upgrade the existing model 170 controllers to CV application-ready 2070LX traffic controllers at 30 key signalized intersections that will be connected to an advanced traffic management software at the County Traffic Management Center (TMC) operated by DTPW. DTPW is already deploying and testing the functionality of the new controllers and supporting ITS infrastructure, which will lead to the upgrade of the entire signal system throughout the County. The next generation of controllers will have processors that can be interfaced with the RSUs and allow existing traffic signal infrastructure to be integrated with connected vehicles, allowing future implementation of applications such as Signal Phase and Timing (SPaT) and Multi-Modal Intelligent Traffic Signal System (MMITS). High resolution controller provided by the new 2070LX controllers will be obtained and used in assessing system operations. FDOT has adopted the intersection performance measurement tool based on high resolution controller data that was produced by Utah DOT. The project team will work with the FDOT Central Office to install this software on servers to produce signalized intersection system performance.
In addition, the intersection approach inductive loop detectors at the 30 intersections will be replaced by inductive loop detectors. The communication infrastructure serving these intersections will be upgraded to fiber optics communication. The signal controller, intersection detection, and communication system upgrade will be funded by DTPW.
Arterial Dynamic Message Signs
In addition to providing information utilizing the CV OBUs and associated driver interface, the project will install eight (8) arterial dynamic message signs (DMS) to provide drawbridge opening and other event information to travelers and to recommend alternative routes, if appropriate. The DMS will be a front access DMS installed on cantilever structures 21-30 ft. and will have a 51-100 sq. ft. color display.
Diversion Analysis
The USDOT Integrated Corridor Management (ICM), dynamic mobility applications (DMA), and Active Traffic and Demand Management (ATDM) testbed efforts proved the effectiveness of analysis, modeling, simulation (AMS) in supporting and evaluating advanced strategy implementation. This project will utilize a mesoscopic simulation-based dynamic traffic assignment (DTA) tool to identify alternative routes that can be utilized by motorists during drawbridge openings and other events. The subnetwork in the vicinity of the drawbridges will be extracted from the regional activity-based regional demand model and refined for input to the DTA model. The DTA model will utilize origin-destination information from the regional demand model as input to an origin-destination matrix estimation (ODME) process that will also use data from Bluetooth readers and measures from point detectors as inputs to determine the origin-destination of travelers and to calibrate the model. The DTA modeling results combined with real-world data will produce time-dependent estimates of the diversion with and without bridge opening for use by the traveler information module and special signal timing plan module of this project.
Special Signal Timing Plan Setting
Special signal timing plans will be designed using real-world data and the diversion model described above. The signal timing setting will utilize a signal timing optimization tool and a microscopic simulation modeling tool to optimize and fine-tune the signal timing. The plans will involve preempting the signals approaching the opened bridge and signal timing plans that accommodate diverted traffic on alternative routes. The plans will be set with the participation of the DTPW's signal control engineers and will be tested using the microscopic simulation model. A library of plans will be generated and stored in the Concert software for each combination of bridge opening parameters and traffic conditions.
The Concert system will send center-to-center messages to the County central traffic control system to invoke special plans at the controllers for the opened bridge approaches and alternative routes. The Siemens Concert system will send the proposed special plan numbers through the center-to-center interface. It will be the responsibility of the existing County system to perform the plan change at the controller level. All center-to-center interfaces will be implemented according to the Traffic Management Data Dictionary (TMDD) standards. According to the TMDD standards, two different mechanisms may be used to return the controllers to their standard operational state. The plan command request has an optional parameter for end time which may be specified. Additionally, a separate cancel command may control the request. One of these methods will be used from the Siemens Concert system to return the controller to their standard operational state.
Data Analytics to Support Planning for Operations
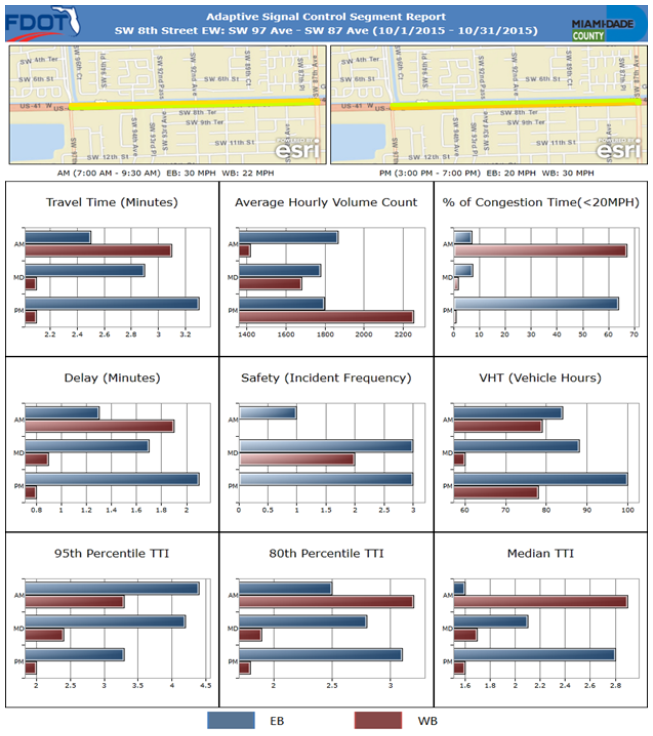
A critical component of this project is a data analytic component that support the planning for operations of the proposed management system. The utilized tool for this purpose is the ITS Data Capture and Performance Management (ITSDCAP) tool, which is a web-based data analytic tool that has been developed with support from the FDOT. The tool is currently used in Miami-Dade County to produce performance dashboards, as shown in Figure 4.
ITSDCAP will utilize data from multiple sources including the detector data from connected vehicle data, the Bluetooth and point detector installations, HERE (third party vendor) data, crash data, and weather data to produce performance measurement dashboards. The dashboard will include mobility, reliability, safety, and emission measures and will be used to support the revision of signal timing plans, bridge opening schedule, and other operations and management decisions. In addition, high resolution controller data collected from the newly installed 2070LX controllers will be used in producing measures that support the assessment of system performance.
5. Real World Issues and Challenges
Miami-Dade's growth will continue to intensify the already existing problems of congestion, safety pollution, and limited resources. Southeast Florida has significant deployments of ATM strategies and applications, particularly on freeways. However, there is a limited deployment of ATM strategies on many critical urban streets in the region, particularly in the Downtown Miami area. In addition of the significant impacts of incidents and construction activities facing metropolitan areas around the nation, the Downtown area faces other major issues that includes the operations of drawbridges over the Miami River that cause significant mobility and reliability impacts; special events at the Miami American Airlines Arena and other venues in Downtown; and the significant growth of businesses, commercial developments, tourism, and high-rise dense residential areas that adversely impacts the network operations. During the PM peak period, every bridge opening on Brickell Ave. takes an average of 7 minutes, impacting 400 vehicles and taking 15 minutes for the entire queue to be dissipated. It is estimated that every bridge opening during peak congestion causes $40,000 of lost economic activity to Downtown Miami businesses. In 2014, approximately 17,327 business trips were affected by Brickell Ave. Bridge openings during curfew hours, resulting in $12,237,145 in lost productivity for the Downtown Miami's economy, 141,388 gallons of gasoline, and 246 metric tons of CO2 emissions.
Industry, cities, and authorities need new and innovative technology solutions to meet these threats and challenges. DTPW and its transportation partners have recognized the potential of smart strategies and technologies to address these challenges. The Miami-Dade County region has a very strong transportation system management and operations (TSM&O) program, in which DTPW is a strong partner. The information from this project will be shared and coordinated with this program. DTPW also formed a Miami-Dade County Connected and Autonomous Vehicle (C&AV) task force that includes representatives from public agencies in the region in addition to private sector partners. This task force will also be kept informed about the project activities.
The products of this project will support transformative changes in transportation system and management by providing new management tools and methods for its transportation planners and operators to increase infrastructure efficiency, travel demand predictability and economic prosperity, enhance the quality of life, improve road user safety and experience, and move toward a sustainable future.
County's Challenges and Opportunities
Miami-Dade County is not alone in some of the transportation-related challenges it faces over the coming decade, including an aging population, travel demand that stresses and exceeds peak period capacity, and projections for continued significant growth in both population and employment. Miami-Dade must also address other challenges that are especially emphasized by its particular combination of geographic, cultural, demographic, and environmental characteristics, as well as its transportation context within Florida and the United States, more specifically:
- Heavy Traffic Congestion and Transit Coverage Challenges. Congestion is the most pressing challenge faced by MDC. The current mobility landscape presents challenges that impact our diverse community's quality of life. Network users are experiencing longer commute times, more traffic congestion, and higher transportation expenses. Miami Metropolitan area (Miami/Fort Lauderdale/Pompano) ranks 6th in the nation in traffic congestion. In 2014, each Miami commuter spent 52 hours in traffic, 30% more time than the average American (38 hours), costing each commuter about $1,169 per year6. Furthermore, while 92 percent of the Miami-Dade's population has access to transit, only 15% can arrive to work within 90 minutes via transit. Short freeway trips that should take 20 minutes may take between 50-60 minutes.
- Land Use Area Challenges. Miami is limited by its geographic surroundings, including the ocean and Miami River; these constraints prevent further outward expansion and require vertical growth that will inevitably increase urban density and the demand for
expanded transportation options. Miami Downtown is experiencing significant growth of residential buildings, business, commercial, tourism, and entertainment venues resulting in congestion in most days and times of the week. - Climate Change and Sea Level Rise Challenges. The near and mid-term effects of climate change such as storm surges, flooding and sea level rise, have profound implications for future growth and development. Porous land and limited elevation represent just two challenges to adaptation that Miami-Dade will have to address in order to ensure its long-term sustainability.
- At Grade Railroad Crossing. Two ongoing efforts to reintroduce intercity rail service with termini in Downtown Miami, including an intercity rail line to Orlando and a second commuter rail to Palm Beach County, together with a need to establish between east-west rapid transit linkages. It is expected that the proposed drawbridge management project concepts will be extended to railroad crossing in future efforts when these rail services become operational.
Project Approach to Address County's Challenges
This project will incorporate new advanced technologies to facilitate the real-time monitoring and assessment of traffic patterns and drawbridge operations; dissemination of travel time information to motorists, pedestrians and bicyclists using the bridges; increasing economic productivity of local business by minimizing delays due to bridge openings and ensuring better utilization of traffic capacity. The project will emphasize efficient, cost effective development and implementation of corridor management strategies.
6. Deployment Plan
The key to success on advanced technology programs, such as this, is having a detailed deployment plan and approach and skilled program leadership. The project team will collaborate and join efforts with other project members and technology companies to ensure the program stays on tracks and follows a systematic approach.
USDOT System Engineering Process Approach
The proposed technology deployment project will be carried out following the USDOT system engineering process, according to USDOT guidance and FHWA Rule 940. As part of this process, the needs that the technology is supposed to address, the various issues associated with the implementation, and the expected impacts of the implementation will be identified. This will ensure that all testing, deployment, and evaluation efforts are designed and implemented to produce results that are directly applicable to national and regional needs. The team will perform
the following phases:
- Definition Phase
- Situation analysis
- Regional architecture, feasibility study, and Concept of Operations (ConOP) development
- System requirements and high level design
- Development of evaluation plan
- Implementation Phase
- System design
- System installation
- Driver education and training
- Unit, subsystem, and system testing
- Operation and Evaluation Phase
- Operation and maintenance
- Driver survey and focus group
- Evaluation
- Outreach and technology transfer
Definition Phase
The Definition Phase is expected to be conducted in a shorter period since DTPW and its partner agencies (FDOT, DDA and United States Coast Guard) have already collected significant data and conducted detailed analysis of the bridge operations. The project definition process has already started as part of the development of this application and this initial work will provide important inputs to the Definition Phase.
This phase will include situation analysis based on collection and analysis of information related to existing conditions, needs, and technologies. FDOT is finishing an extensive study of the impacts of drawbridge opening and alternative opening schedule. Detailed analysis utilizing Synchro and SimTraffic models has been conducted by that project consultant. The final report, data, and models will be obtained and used in the situation analysis and feasibility study. Additional data will be collected as needed for a complete assessment of the situation and determining the benefits of the deployment including for example origin-destination of the trips crossing the bridge and identification of the vehicles that frequently cross the bridge.
The project deployment components will be mapped to the Southeast Florida regional architecture and the CVRIA and any needed modifications to the regional architecture will be identified. The situation analysis, feasibility analysis, and a stakeholder involvement effort (that include a workshop and face-to-face meetings) will lead to the development of a detailed ConOP in accordance with the USDOT system engineering process guidelines. The ConOp will include the identification and refinement of the goals, objectives, performance measures, associated policies, stakeholders and users, use cases, support environment, and operational scenarios. Some of these items are included in this application and they will be refined as part of the ConOp development.
Evaluation Plan Development
This phase will also include the development of an evaluation plan in accordance with the USDOT Guidelines, the upcoming FHWA project post-deployment evaluation based on empirical data report − , will be leading the evaluation effort, as well as the evaluation of the three (3) pilot CV sites, and all other related guidelines and reports on the subject. The evaluation plan will outline an experimental design and statistical analysis that addresses various threats to the validity of the evaluation including the impacts of exogenous factors. The evaluation plan will include the formulation of hypotheses regarding the expected outcomes of the project and the development of a test plan to assess each of the formulated hypotheses. The definition phase will also produce system requirements and high level design based on the concept for operations. Working closely with the stakeholders, the deployment requirements are elicited, analyzed, validated, and documented. The high-level design includes identifying subsystems and key interfaces and allocation of requirements to subsystems.
Implementation Phase
The next step is the selection of the technologies and products and the design of the system based on the previously developed ConOp and system requirements. The CV RSUs and OBUs and conventional ITS equipment will be installed and tested. The hardware and software installations will be verified to ensure that the delivered components match the documented detailed design. The components will be integrated and verifies at the subsystem and system levels.
7. Regulatory, Legislative and Institutional Challenges
At this stage, no regulatory, legislative, and institutional challenge are identified. Such challenges (if any) will be further examined in the definition phase.
8. Quantifiable Performance Indicators
Performance assessment and system monitoring will be a critical aspect of the management system of this project. The project team will integrate all collected data into the ITSDCAP data analytic tool. A dashboard of system performance will be produced that will allow the County to continuously monitor system operations for any segment in time and space. The performance measures will be related to the goals and objectives of the study. These measures will be produced by ITSDCAP and will also be used when setting the hypothesis to be tested during the evaluation. The measures could include:
- Installed Subsystem Performance. These are output measures that capture the performance of the deployment in terms of equipment reliability, failure rates, times between failures, and so on.
- Behavior Measures. These measures can be also considered as output measures and include the utilization of traveler information systems and the diversion rates of travelers receiving the information.
- Outcome measures. These measures relate to how well the project will meet its goal and stated objectives. The identified output performance metrics are readily measurable and quantifiable, to assure that progress and success can be tracked across the following six performance categories:
- Safety
- Mobility and Reliability
- Efficiency and economic competitiveness
- Sustainability and Climate change
- Quality of life and social equity
The performance measures identified in each category will be used to conduct continuous and
automatic evaluation of system performance improvements. Examples are shown in Table 1.
These measures will confirmed and expanded in the Definition phase of the project.
| QUANTIFIABLE PERFORMANCE CATEGORY AND INDICATORS | |
|---|---|
| SAFETY | SUSTAINABILITY AND CLIMATE CHANGE |
| Number and Rate of Crashes by mode and type
Number and Rate of Injuries and fatalities by mode and type Traveler surveys with safety ratings of the in vehicle information system |
Emission by pollutant |
| MOBILITY AND RELIABILITY | EFFICIENCY AND PRODUCTIVITY |
|
Travel time indices
Travel times and vehicle delays per vehicle Urban mobility report congestion index Vehicle-miles traveled Vehicle-hours traveled On-time performance of County transit vehicles |
Emergency vehicle response times
Reduction in the number of the needed buses due to increase efficiency of public transportation vehicles Access between major activity centers Throughput of the transportation system Number of productivity hours lost |
| QUALITY OF LIFE | |
|
Percentage Accessibility to real-time mobility information
User satisfaction with the drawbridge information |
|
9. Project Benefits
The project goal is reducing the impacts of drawbridge operations and other events. In addition, the project is intended to establish a strong foundation for implementing active traffic management, dynamic mobility applications, and utilization data analytics on urban arterials in the region. The expected benefits of the project are:
- Reduction in delays and queues during drawbridge openings.
- Increasing reliability of passenger car and transit vehicles.
- Reducing the interruption to emergency vehicle operations.
- Increasing traveler comfort and satisfaction due to providing information about the expected delays in the network and the availability of alternative route.
- Reduction in crashes due to informing drivers about queues ahead and diverting them from congested locations.
- Improved management and operation of transportation systems using a performance data-driven approach focused on proactive processes for operational efficiency.
- Reduction in environmental impacts due to reducing pollutant emission.
- Reduction in productivity hours lost due to congestion.
- Establishing the foundation for transformative changes in transportation system operations and management by introducing the use of CV-based dynamic mobility applications (DMA) and utilizing data analytic and system modeling to support operations and planning for operations.
10. Vision, Goals, and Objectives
Vision, Goals, and Objectives of the applicant are consistent with the USDOT's vision for the ATCMTD Program and ITS Program of addressing challenges in safety, mobility, sustainability, economic vitality, and air quality through the deployment and integration of intelligent technologies and related strategies, and advancing ITS through research initiatives and deployment of support programs:
Vision
Deliver an advanced multimodal transportation system that significantly expands and improves mobility options, is respectful of the environment, targeted to reduce greenhouse gas emissions from the transportation sector, and improves the quality of life of everyone in Miami-Dade County; adopt a path toward a transportation network of shared and connected automated systems within a sustainable mobility ecosystem; and create a universal mobility marketplace where everyone can enjoy smart mobility freedom.
Goals
Provide innovative transportation solutions to reduce congestion and reduce fossil fuel emissions significantly over the next 20 years, providing: i) enhanced and affordable surface transportation opportunities; ii) reduced dependency on personal car use for every trip by expanding and integrating mobility options countywide through the deployment of smart traffic signalization and ITS technologies; iii) new management and traveler guidance tools for our varied customer community to increase reliable transportation choices and predictability; iv) economic prosperity, safety, enhanced transportation experience as part of the community quality of life, and a sustainable mobility future.
Objectives
Implement a smart transportation management systems that utilize advanced technologies and active management strategies to support improving the transportation network performance and provide additional basis for the deployment of advanced transportation technologies such as AV and CV technologies to support transportation system management and operations. The specific objectives are improving mobility and reliability, safety, efficiency and economic competitiveness, sustainability and climate change, and quality of life.
11. Innovative Partnership
The DTPW recognizes the critical importance of developing and sustaining strategic partnering opportunities between public agencies and the private sector to build on the individual efforts, assets, and capabilities of its partner agencies as well as the local universities. DTPW, the agency leading this effort, has assembled a team that comprises a combination of partner agencies, institutions and companies with the resources, experience, expertise and leadership required to implement and manage the proposed project successfully, and to share the learnings and results. The proposed project will be managed via a partnership between DTPW, DDA, FIU and Siemens.
DTPW will provide financial contribution to support the ATCMTD project, implementation, and technology transfer efforts to support extending the project activities across the County, region and across United States. Faculty from the FIU College of Engineering and Computing and experts from Siemens will provide additional expertise such as sensors, V2I communications, data analytics, modeling, system evaluation, and other software and hardware. The team's experience with the associated guidance, processes, tools, plans, and pilot deployment of CV and AV, combined with DTPW's experience in applying active traffic and demand management, transit management and operations, and DDA's experience managing public outreach programs will be leveraged to support the program success. Letters of Support are provided in Attachment A of the Volume 2 - Budget Application.
Partners
- Florida International University (FIU) will provide technical expertise for the implementation of the proposed project elements including the development of ConOp, technology selection, evaluation plan, data collection and analysis, diversion analysis, and modeling support. The FIU research team has extensive experience in assisting agencies in these areas, and has worked on multiple national, state, and regional related efforts that researched and evaluated advanced technologies. The team has developed a web-based data analytic tool (ITSDCAP) that captures and aggregates data from multiple sources and can be used for TSM&O. ITSDCAP will be used to support the analysis of the project.
- Downtown Miami Development (DDA) will assists in the planning and execution of public outreach activities, including information dissemination. Authority As an autonomous agency of the City, the Miami DDA advocates, facilitates, plans, and executes business development, planning and capital improvements, and marketing and communication strategies.
- Siemens, Mobility Division Intelligent Traffic Systems will perform the system engineering and technology provision for Connected Vehicle technology in the project. Depending on the project needs, other CV technology providers will be included.
Commitment to Data and Information Sharing
Recognizing the importance of national, statewide, and regional public-private partnerships in successfully navigating the sea of changes that are already well underway, DTPW project team is fully committed to employing and promoting open source data protocols wherever possible, and share the project data, outcomes, products and applications from the proposed project in accordance with USDOT guidance and methods. This project will document the data, processes employed, benefits, costs and constrains as well as the lessons learned. A data sharing plan will be documented as part of a performance measurement plan. The generated data (performance and evaluation data) and new applications developed will be shared with the Community of Practice, USDOT and posted at the specified frequency of reporting as needed by the USDOT on resources such as the Research Data Exchange (RDE) (https://www.its-rde.net/), which is the USDOT transportation data sharing system (if so directed by the USDOT), and will be shared for possible inclusion in the USDOT Knowledge Resources databases(http://www.itskrs.its.dot.gov/). The project team will meet all policy and governance requirements of the RDE. The research team will deliver webinars for progress updates.
Commitment to Work with USDOT's Research Programs
As mentioned above, a data-sharing plan will be documented and the performance and evaluation data will be shared with the USDOT and posted at the specified frequency of reporting as needed by the USDOT on resources such as the RDE. In addition, the project team is committed to participate in national and international conferences, meetings, workshops, collaborative, webinars among other research activities and transfer of knowledge related activities.
12. Plan to Leverage and Optimize Existing Investments
This project will leverage and optimize existing ATMS technology investments. DTPW and its partners have agreed to coordinate their efforts to design, develop and deploy advanced transportation and congestion management technologies through multiple integrated components to disperse traveler in time, place and mode and to alternative destinations so as to improve each trip and trip segment that more cost efficiently utilizes the full capacity of the County's multimodal transportation system by:
- Upgrading exiting traffic signal infrastructure and advanced operating strategies (including real-time arterials and signal system monitoring).
- Connecting traffic detectors and readers at critical intersections in the vicinity of the bridges to the central software (Siemens Concert) utilizing the existing County communication infrastructure. Similarly, the field devices will be connected to the existing regional traffic management software (SunGuide), allowing the estimation of system performance measures, incident detection, and data archiving for use in the data analytic tool. In addition, the SunGuide system, which receives travel time estimates from third party vendors and incident information from WAZE's Connected Citizens Program, will share the derived information in real-time using center-to-center communications with the Siemens Concert software.
- Using ITS Data Capture and Performance Management (ITSDCAP) tool, a web-based data analytic tool that has been developed with support from the FDOT, and currently used by DTPW's Traffic Management Center.
13. Schedule
A detailed preliminary project schedule has been developed for the proposed project. The preliminary project calls for the project activities to be completed in three (3) years(approximately 36 months). It includes a planning and design phase, contractor and vendor procurement, implementation and operation of the project. The project schedule for conducting the proposed advanced technology deployments and for the completion of all proposed activities is depicted in Table 2.
| Project Activity | Timeline |
|---|---|
| Definition phase and situation analysis. | February 1, 2018 |
| Development of concept of operations, test design, and evaluation plan. | April 15, 2018 |
| County's traffic signal system upgrade: deployment of 2070LX controllers (30 intersections), ATMS deployment and ITS equipment. | July 15, 2018 |
| Acquisition, deployment and testing of CV equipment, software, applications. Training. | July 15, 2018 |
| System integration, training, data collection and evaluation of CV technologies. | September 15, 2018 |
| Marketing, outreach and information dissemination activities for OBUs distribution. Driver education and training. | September 15, 2018 |
| Deployment evaluation: Data analysis, performance assessment and technical memorandums, production of final report and documentation. | December 15, 2018 |
| Driver survey, focus group for technologies and technical memorandum. | December 1, 2018 |
| Production of final report and documentation. | January 15, 2019 |
14. ITS Initiatives
The USDOT dynamic mobility application (DMA) of connected vehicles, Active Transportation Management (ATM), and Integrated Corridor Management (ICM) initiatives have demonstrated the effectiveness of utilizing advanced traffic management strategies integrated with traveler information systems to improve system performance and the potential of using connected vehicles to increase this effectiveness. In addition, these programs demonstrated the use of analysis, modeling, and simulation (AMS) to support ATM and DMA. This project activities will benefit from information obtained based on the activities of these initiatives and from what is learned up to this point from the three USDOT CV pilots.
In addition to the significant benefits from the funded applications and future applications that are built on the funded applications to the County, region, and the State of Florida; it is expected to generate information that will support the USDOT CV effort. The DSRC-based CV deployment, as Miami will serve to demonstrate this capability in an area with high building density but not as dense as New York City (NYC) from elevated skyline standpoint. Tall buildings have produced the "canyon effect," which may be a problem in NYC. It will be of interest to capture the data for Miami-Dade and compare it to the data from NYC. The proposed project will also demonstrate the use of data analytic and modeling components as part of a decision support system to support management activities, of which drawbridge management is just an example. Such management activities will include applications ranging from incident management, to work zones, to railroad crossing management.
1 U.S. Census Bureau, 2015 American Community Survey, Commuting Characteristics by Sex, available: https://factfinder.census.gov/faces/tableservices/jsf/pages/productview.xhtml?src=CF [Return to Note 1].
2 Brookings Institute, The Growing Distance between People and Jobs in Metropolitan America, 2015 [Return to Note 2].
3 Miami Downtown Development Authority, Annual Report 2015-2016, January 2017 [Return to Note 3].
4 Florida Department of Transportation, D6, Draft Technical Memorandum, SR5/US-1/Brickell Ave. Drawbridge Operating Schedule Evaluation and Assessment of Restricted Time Periods, December 2016 [Return to Note 4].
5 Miami Downtown Development Authority, The Economic Impact of Brickell Bridge Openings, 2015 [Return to Note 5].
6 Texas Transportation Institute, 2015 Urban Mobility Scoreboard [Return to Note 6].