Advanced Transportation & Congestion Management Technologies Deployment (ACTMTD) Proposal: Next Generation Management of the I80 Corridor for Bridge Performance, Damage, and Load Capacity
A. Project Description
A1. Introduction
As a part of growing efforts to use quantitative information to improve bridge management, the Iowa DOT and others have begun to rely more and more upon performance and behavior information gathered during testing and monitoring. For example, the Iowa Department of Transportation has relied upon a coordinated testing and monitoring program to collect performance data to compare with design- based structural parameters to determine if structural response is adequate. In some cases these data were used to calibrate analytical models that are used to provide a more detailed structural assessment (e.g., a load rating to determine safe bridge capacity). Even more, targeted diagnostic testing has also been used to help identify deterioration or damage or to assess the integrity of an implemented repair or strengthening method. In other cases, the performance of innovative materials (ultra-high performance concrete, fiber- reinforced polymers, etc) have been verified using on-site testing.
With recognition of the value of measured performance and behavior information, the Iowa DOT embarked upon an ambitious effort to develop a bridge monitoring system that could continuously and in real-time monitor and report on the condition of bridges. The development of this system began around 2003. Most recently, the Iowa DOT initiated a pooled-fund study to evolve the system into a turnkey system that could identify important structural changes (e.g., damage and deterioration), estimate the safe load carrying capacity (as well as anticipate future load carrying capacity), and to provide information that could be used to estimate remaining service life. Together with Iowa, the other pooled fund study partners (The Federal Highway Administration, Illinois, Wisconsin, California, and the United States Department of Agriculture) have worked to help mold the development of a usable and practical system.
Bridge condition monitoring, which involves specialized hardware and software algorithms, has been widely investigated over the past 20-30 years. Unfortunately, there have been undelivered promises and, as a result, bridge monitoring has had a somewhat negative connotation associated with it. In 2015, through the previously mentioned pooled fund project, a bridge monitoring system, known as BECAS, was made completely functional and demonstrated to have the previously mentioned characteristics as the directed by the project oversight committee. The BECAS system utilizes high level bridge engineering concepts coupled with statistical means and methods to complete the needed functions. Some key attributes of BECAS are:
- Primary measurement metrics: Strain, temperature, GPS timestamp.
- In particular, strain due to the passage of live loads - specifically, five-axle semi-trucks because of their heavy weights and large numbers
- Possible to integrate other sensor types.
- Captures and notifies of "overloading" due to short-term events 1,200,000 times per minute (wind, earthquake, over-height vehicle impact, collapse, sudden settlement, etc.)
- Identifies, quantifies, locates, and reports on changes in structural condition and performance (3,508,480 checks per 1,000 trucks).
- Calculates load rating once per minute based upon ambient traffic and actual bridge condition.
The major components of BECAS are described in the following paragraphs. The BECAS hardware platform is built using commercially available, off-the-shelf hardware components coupled with a sensor network custom designed for the specific monitoring need. The basic data acquisition system consists of the Campbell Scientific CR9000x data logger using the high capability CR9052 module which has the on- board filtering needed when running high-speed data acquisition. Other hardware component include a typical computer, a network switch, cellular communications, and a IP-based power switch. As mentioned before, the BECAS platform can accommodate most any sensing system. However, regardless of the application every BECAS deployment utilizes electrical resistance strain sensors. These strain sensors form an important part of the BECAS algorithms (truck detection, damage detection, load rating, etc.).
The BECAS data processing suite consists of a number of custom developed software applications. For brevity, the following software applications will be briefly described here with a more detailed description later: BECAS Merge, BECAS Processing Engine, BECAS Damage Detection, and BECAS Load Rating.
The large number of sensors required to monitor a structure such as a highway bridge may entail installation of several data loggers. Data files from different loggers and sensors, therefore, must be synchronized and merged to create a single file. Synchronization is accomplished by the use of GPS-based timestamps on each of the sampled data points. In BECAS Merge, with data loggers sampling at a frequency of 250Hz, data points within 0.004 seconds of each are merged into one timestamp. This creates time sequenced output data files with concatenated columns from multiple input files produced from multiple data loggers. Following synchronization, the raw strain time histories obtained at all sensor locations are packaged for further processing and passed to BECAS Processing Engine.
BECAS Processing Engine compiles the time sequenced strain data files checking for proper concatenation of the records. Data with anomalies are then removed from the record. Then, the bridge response is immediately evaluated to determine if a potentially catastrophic event (earthquake, overload, impact, etc.) has occurred. In the event that such an event has been detected, BECAS Processing Engine sends a text and/or email alert. For the damage detection and load-rating computations the strain data are further processed to only retain user specified truck traffic events. At the beginning of each truck event, the raw data are zeroed to eliminate drift and long-term temperature effects. The resulting signal is then filtered to remove vibration effects and noise resulting in a quasi-static time history response. The quasi-static strain time histories are fed to the truck detection algorithm. Typically, the BECAS truck detection algorithm is configured to identify five-axle-single-truck events. The truck detection algorithm verifies that events do not contain concurrent, side-by-side, or staggered lane truck events (i.e., only one truck on the bridge at a time) and determines the lane of travel as well as determines several important truck characteristics including number of axles and the spacing between each axle. The events are then further classified by temperature and separated into appropriate temperature groups (typically 5 degrees Fahrenheit) for further processing.
BECAS Load Rating is used to determine the safe load carrying capacity of the bridge being monitored. BECAS Load Rating uses the time-dependent strain histories for a select subset of the trucks detected by BECAS Processing Engine (specifically, those trucks with total weights in the top 10% of all trucks AND trucks that meet very tight axle spacing criteria). Using a specially developed database of trucks, 1,000 trucks that most closely match the detected truck are used to calibrate an analytical model of the bridge. Once calibrated, this analytical model is then used to determine the safe load carrying capacity. If the calculated load carrying capacity falls below a user specified value, an email/text alert is sent.
BECAS Damage Detection uses two specially developed algorithms to determine if changes in structural behavior have occurred. To accomplish this, a user specified number of truck events (e.g., 1,000) are compared to the initial bridge response to determine if a structurally significant change has occurred. In the event that an important change has occurred, BECAS Damage Detection determines the likely location of the change and estimates the severity of the change. All information is stored in an easy to read and interpret report.
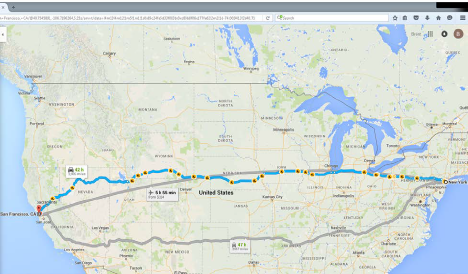
The BECAS system offer a unique solution to bridge monitoring and condition assessment that has not before been possible. The proposed technology deployments will be to strategically install the BECAS system on bridges throughout the Interstate 80 (I80) corridor. I80 is a major East-West route that is not only important for the movement of the public but also vital for the shipping industry and for the movement of military assets. At over 2900 miles long, I80 is a critical national corridor with some of the highest travel volumes in the country in some sections. The project will deploy these emerging bridge evaluation technologies at geographically diverse model sites throughout the I80 corridor. This project brings together a consortium of state DOTs from coast-to-coast to demonstrate how next generation bridge evaluation will be accomplished.
Not only with this unique deployment demonstrate this novel technology, this project will illustrate how quantitative, corridor-based bridge information can result in even better asset management. There are roughly 21 bridge management systems in the world. In general these management systems are used for quantitation of deterioration and other performance indicators, formulation of corrective intervention strategies, and tracking of changes following an intervention program. Unfortunately, none of the bridge management systems have a means to integrate advanced bridge monitoring into the decision making process. In the past 6 months a new bridge management adaptation has been developed through a USDOT funded grant. This approach is known as an SHM-Facilitated Condition-Based Management (SHM-CBM) Prioritization System. The most fundamental part of the SHM-CBM is a specially created SHM Modifier which is calculated using quantitative bridge performance information. The SHM Modifier is then used to update a State's numerical condition assessment by "tuning" it either up or down depending upon the measured behavior. The SHM Modifier has been shown during demonstrations to reveal that bridges are performing much better than an inspection-based assessment would indicate. In fact, the improved assessment has been shown to result in bridge maintenance/repair cost savings that exceed the cost of the monitoring system installation and operation.
A2. Project Team
A rather unique team has been assembled for this project. At the very core is a consortium of states from across the county which have come together to advance the state of bridge evaluation. The consortium of states is joined by an industry partner working collaboratively with the states after having worked with nearly all of the state partners on previous projects.
A2.1. The I80 Consortium
A2.1.1. Lead
The Iowa DOT manages over 9,400 miles of public roads and over 4,100 bridges at the cross-roads of the United States where Interstate 80 and Interstate 35 meet. First established in 1904 as the Iowa State Highway Commission, the Iowa DOT has a long and storied history. First established as a part of Iowa State College of Agriculture and Mechanic Arts (now Iowa State University of Science and Technology), the Iowa State Highway Commission was initially to provide information and act as an administrative agent to locals. For the next 70 years the Commission continued to operate until 1974 when the Iowa Department of Transportation was established. This new organization brought together other transportation modes (rail, etc.) under one, holistic entity. At the same time, the Iowa Transportation Commission was established to be responsible for reviewing all Iowa DOT programs. Iowa's first section of I80 opened in 1958 on the Southwest edge of Des Moines.
The Iowa DOT is nationally known as being a leader in the advancement of transportation innovations and technology. Although there are numerous achievements across the many DOT disciplines, there are several noteworthy contributions to the bridge engineering community that are worth mentioning. For example, the Iowa DOT has been an early adopter of Accelerated Bridge Construction (ABC) as a way of reducing mobility impacts associated with bridge replacement. Additionally, the Iowa DOT has invested in research leading to the a better understanding of integral abutment bridge design as well as research related to the use of technology based bridge evaluation methods. The Iowa DOT has also been a strong believer in the idea of continuous bridge monitoring. As
Redacted
Redacted
Redacted
Redacted
Redacted
Redacted
Redacted
Redacted
Redacted
Redacted
Redacted
Redacted
Redacted
Redacted
Redacted
Redacted
Redacted
Redacted
Redacted
Redacted
Redacted
Redacted
Redacted
Redacted
Redacted
Redacted
Redacted
Redacted
Redacted
Redacted
Redacted
Redacted
Redacted
Redacted
Redacted
Redacted
Redacted
Redacted
Redacted
Redacted
Redacted
Redacted
Redacted
Redacted
a safe, sustainable, integrated and efficient transportation system to enhance California's economy and
Redacted
Redacted
Redacted
Redacted
Redacted
Redacted
Redacted
Redacted
Redacted
Redacted
Redacted
Redacted
Redacted
Redacted
Redacted
Redacted
Redacted
Redacted
Redacted
Redacted
Redacted
Redacted
Redacted
Redacted
Redacted
Redacted
Redacted
Redacted
Redacted
Redacted
Redacted
Redacted
Redacted
Redacted
Redacted
Redacted
Redacted
Redacted
Redacted
Redacted
A3. Project Location
As mentioned above, the objective of this project is to deploy the proposed advanced bridge evaluation technologies along the I80 corridor which crosses through 11 states. As of the preparation of this grant proposal, the specific locations of the model sites has not yet been finalized. In fact, Task 4 described subsequently will focus almost exclusively on the selection of the model sites. Although the Technical Advisory Committee will have the final say in the location of the sites, it is envisioned that the selected bridges will be diverse in location, weather, traffic volume, traffic direction, location relative to municipalities, material type, and others.
Additionally, as the various state participants have committed varying levels of funding to the project, consideration will be given to the financial stake each has.
A4. Issues, Challenges, and Solutions
The condition and state of the nation's bridges is a common topic of mainstream media with statistics like over 600,000 bridges in the US and the fact that 25% are classified as structurally deficient or functionally obsolete. Even more important, the average US bridge has been in service longer than its original design life. In 2012 dollars, it is estimated that it would cost $15.3B to rehabilitate and $22.5 to replace just the Structurally Deficient structures on the National Highway System ($35.2B and $48.5B, respectively, for all Structurally Deficient Bridges). These are funds that bridge owners simply do not have. Making matters even more concerning, the Federal Highway Administration (FHWA) has published a report indicating that the current state-of-the-practice for bridge evaluation – Visual Inspection – is extremely subjective and, at best, unreliable. The situation, quite simply, is that bridge owners/managers are managing an aged system, with fewer available resources than are estimated to be needed, using information that is qualitative at best and unreliable at worst.
Over the years, there have been several points that have notably changed the way that bridge condition and safety is ensured. In the late 1960's following the collapse of the Silver Bridge, the National Bridge Inspection Program was initiated and, with it, the National Bridge Inspection Standards were developed. This was the first time in history that a concerted and nationwide effort was made to ensure bridge safety through required and documented inspection. In the 1990's the use of Nondestructive Evaluation (NDE) technologies become more prevalent – but generally only in "on-call" situations. It is interesting to note that nearly every NDE technology in use today is because a technology developed for medical applications was adapted for civil engineering usage (i.e., no system has been specifically developed for bridge applications).
Over the past 20 to 30 years, there has been notable research targeted at developing a so-called Structural Health Monitoring (SHM) system specifically for bridges. Most of this research has either been unsuccessful, confined to the laboratory, or is too unwieldy to use (e.g., requires too much human interaction, requires the creation of highly discretized finite element models, etc.). In some cases, repeated failures to deliver useful systems have created a negative connotation associated with SHM.
Beginning in 2003, researchers at the Iowa State University (ISU) Bridge Engineering Center (BEC) started working on the development of an SHM system that would have several desirable features such as: nearly fully automated, provides real-time warning of catastrophic or near-catastrophic events, identifies/locates/quantifies damage or deterioration, provides an estimate of the safe load carrying capacity, allows for forecasting changes in condition/capacity, and reports, in a useful and intuitive form, condition information on-demand. The result of that developmental work is the bridge evaluation technology known as BECAS (Bridge Engineering Condition Assessment System). BECAS uses commercially available hardware coupled with state-of-the-art sensors integrated with a suite of software that works in concert to produce the above mentioned capabilities. The BECAS system is easily configured to nearly any bridge type and material. The BECAS system is currently being brought to market by the firm Advanced Structural (AS), LLC. The founders of AS are also the original inventors of BECAS.
BECAS
BECAS eliminates the subjectivity of current inspection approaches; increases evaluation frequency from once every two years to continuously, virtually removes human error, bias, and limitations; and provides feedback that can be used to perform proactive, rather than reactive, preventative maintenance. The following will briefly describe the major components of BECAS including hardware and the software suite (BECAS Merge, BECAS Processing Engine, BECAS Damage Detection, BECAS Load Rating, and BECAS Distributor). Additionally, a partial example of one of the tangible outputs (annual condition report) is then given.
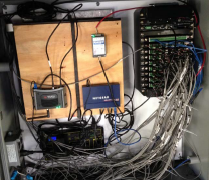
The BECAS hardware, as mentioned previously, is comprised of off-the-shelf components integrated together to form a network of state-of-the-art sensors, data collection equipment, data storage, and an N-tier data processing hub. There are three sensor types that make-up every BECAS installation: resistance strain sensors, temperature sensors, and GPS signal collectors. In addition, sensors of multiple types can be integrated into the system (tilt, deflection, corrosion, acceleration, etc.) depending upon any unique monitoring needs. The sensors are connected to an on-site data logger that has integrated filtering capabilities. With read speed capabilities that approach 1,000 Hz, the data logger has the ability to collect the data needed (high speed data collection is needed for vehicle identification and classification). On-board filtering capabilities added to each system helps to ensure that measurement noise is minimized. To temporarily store, initially process, and then transfer the data to the main data processing hub, a mid-level desktop PC is connected to the data logger via wired Ethernet. An IP-based video camera is also installed at each BECAS site. This camera is setup to record (and temporarily store) a live video feed of the bridge (including traffic crossing the bridge). One final key piece of the on-site hardware is an IP-based power switch. This power switch has multiple features that make it a useful part of the system. For example the power switch allows remote uses to power up or down individual system components from anywhere in the world. Second, in the event that the on-site system loses connection with the internet, the power switch will automatically reboot the on-site cellular modem until the system comes back online fully. Once transferred from the bridge to the A-S office, the data are stored on a networked location. Then, an N-tier system of computers automatically detect the presence of new data and process them. To create redundancy in the system and to provide a lower-cost method of analyzing the data in real-time, a typical BECAS processing architecture consists of a workstation class PC (the parent) plus one or more lower cost desktop PC(s) (the children). Even more, since currently available computers have multiple cores (i.e., processing threads) the BECAS software described subsequently will parallel process multiple files at once. Photographs of a typical field installation and a typical data processing cluster are given below.


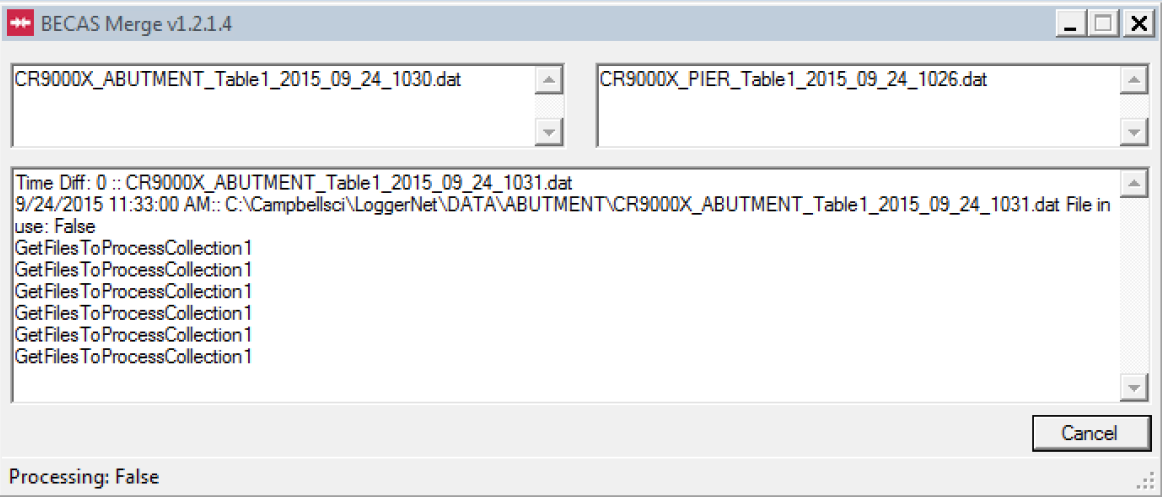
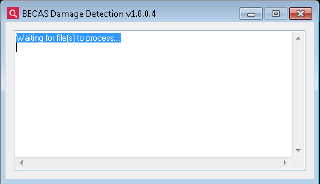
Most BECAS installations require multiple data loggers to collect the amount and fidelity of data needed for the various downstream applications (described later). BECAS Merge creates time sequenced data files with concatenated columns from multiple input files produced from multiple data sources. BECAS Merge performs initial data quality checking and repair associated with timestamping anomalies. Entries from multiple data sources are aligned to within 0.004 seconds or less. A screen shot of BECAS Merge during the merge process is shown below.

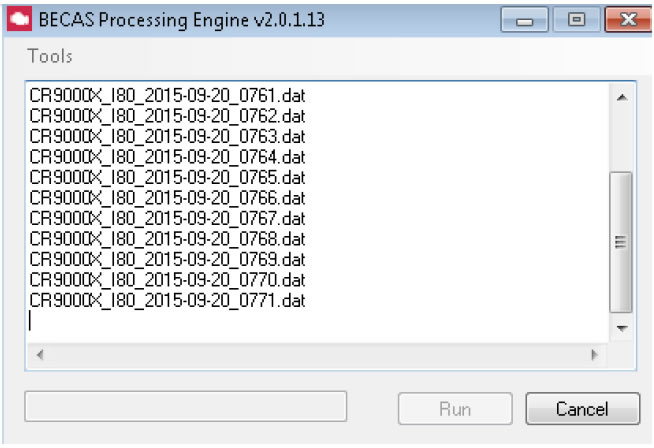
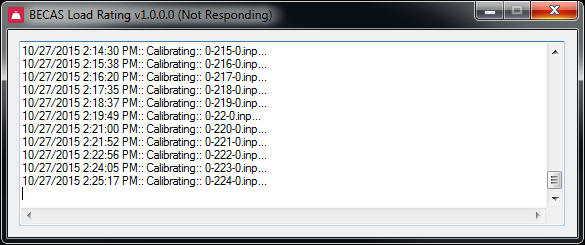
The damage detection (BECAS Damage Detection) and load rating algorithms (BECAS Load Rating) require that the continuously collected data be manipulated prior to being further processed. First and foremost, it is essential that all data be of high quality. Second, the system utilizes only a subset of live load events during the damage detection and load rating processes. Although the specific loadings are user configurable, it is most common to use 5-axle semi-trucks. Also, to eliminate the impact of differences in vehicle suspension systems, it is desired to use the predicted pseudo-static response of the bridge. BECAS Processing Engine checks the continuous data stream for anomalies and then analyzes the time sequenced data and evaluates those data to determine if a catastrophic event has occurred and then assesses the presence of user specified truck traffic on the bridge. The potential events are evaluated for data consistency and for concurrency of multiple trucks on the bridge. Events that have passed integrity evaluations may then have macro-temperature effects removed with resulting damage detection files produced. After a user specified number of trucks have been detected, BECAS Processing Engine passes the damage detection files to BECAS Damage Detection. Detected trucks then undergo further discrimination and discretization and strain time histories for trucks with specific, user specified, characteristics are then passed to BECAS Load Rating. A BECAS Processing Engine screenshot is shown below.

The key to the BECAS Damage detection approach is in the custom developed and validated (both experimentally and analytically) data analytic approaches. Although length limitations prohibit an extremely detailed description of the approaches, the two damage detection approaches combine important aspects of structural engineering plus statistics. Loosely rooted in control theory, the damage detection approach uses comparisons between current behaviors with those established during training (using BECAS Training described later) to determine whether or not damage has occurred. If damage has been detected, the system then employs multiple approaches to determine the location and severity of the damage. BECAS Damage Detection applies user specified settings established with BECAS Training to data passed from BECAS Processing Engine to detect changes in structural behavior and performance using a combination of statistical and/or structural tests following pre-defined rules. Outputs including damage location and estimated damage levels are output to individual files for each test and rule. End results are then packaged and notification sent to authorities.

BECAS Load Rating uses the measured response from partially known vehicles to calibrate a bridge specific math model with geometrically/weight similar trucks selected from a specially created database. The calibrated math model is then used to calculate bridge safe load carrying capacity based upon user input parameters. If the estimated safe load carrying capacity is below a user-specified amount, notification is sent to authorities.

BECAS Distributor Continuously monitors a specified data repository containing flat files (e.g. comma delimited text data stored in rows). Distributor moves a specific number of files from the repository to a defined number of subdirectories (clients). The BECAS Distributor continuously monitors these client folders to maintain the specific number of files. Once moved, the BECAS Processing Engines operating on each of the clients (parent and children computers) process the data and prepare the results for BECAS Damage Detection and BECAS Load Rating. Each installation of BECAS Processing Engine has a series of checks-and-balances integrated such that the same files are not processed by multiple clients nor are results being simultaneously written to the same output files.

BECAS training is used to initially setup parts of the system (BECAS Damage Detection). This training can be at least partially completed after less than one day of system operation in some instances. BECAS Training establishes control thresholds for BECAS Damage Detection utilizing baseline datasets. Control construction approaches can, based upon user specifications, create thresholds for two custom damage detection methods. Users may set various training parameters including training size, group size, step size as well as elects other options.
One important item to mention is that each of the applications described above has integrated communication outlets. For the most part, the system requires no routine user interaction or intervention. However, when BECAS determines that user interaction is needed, the system is configured to send out emails and/or texts to one or multiple people. When received, these communications are then quickly evaluated to determine if any immediate response is needed. For example, the previously mentioned live video camera feed might be evaluated to determine if a serious condition exists or the recorded video feed can be replayed to determine what vehicle may have caused an overload to occur.
In addition to the previously mentioned on-demand communications created by the various BECAS applications, a concise report is generated to summarize a period of monitoring. The form of these reports have been crafted to be similar to other bridge evaluation reports currently in use (i.e., National Bridge Inspection reports). A portion of a report is presented below.
SHM-Condition Based Management System
There are roughly 21 bridge management systems in the world. In general these management systems are used for quantitation of deterioration and other performance indicators, formulation of corrective intervention strategies, and tracking of changes following an intervention program. Unfortunately, none of the bridge management systems have a means to integrate advanced bridge monitoring into the decision making process. In the past 6 months a new system has been developed through a USDOT funded grant. This approach is known as an SHM-Facilitated Condition-Based Management (SHM-CBM) Prioritization System. The most fundamental component of the SHM-CBM is a specially created SHM Modifier (SHMM) which is calculated using quantitative bridge performance information. The SHMM is then used to update a State's numerical condition assessment by "tuning" it either up or down depending upon the measured behavior. The SHMM has been shown during demonstrations to reveal that bridges are performing much better than an inspection-based assessment would indicate.
Due to the relatively small number of SHM systems installed thus far, it has been determined that using the SHM data as a "tuning" factor is the most practical way to implement SHM in the short term and may well be more practical over the long-term as well. The SHMM is computed using the continuous, real-time data and assessments resulting from the BECAS system. The SHMM is then applied to any numerical assessment system to "tune" the qualitative assessment based upon the quantitative measures. The equation for the SHMM is given below. The equation contains 7 factors coupled with 7 weighting factors. The combination of quantitative data plus user configurability allows an owner agency to customize the approach to meet agency goals.
SHMM = (F1γ1) (F2γ2) (F3γ3) (F4γ4) (F5γ5) (F6γ6) (F7γ7)
In which:
- F1 = Load Rating Ratio Factor;
- F2 = Load Rating Rate of Change Factor;
- F3 = Behavior Change Factor;
- F4 = Service Level Stress Rate of Change Factor;
- F5 = Service Level Stress Margin Factor;
- F6 = Expert Opinion Factor;
- F7 = Reduced Uncertainty Factor;
And γ1 to γ7 are weighting factors associated with F1 to F7.
Five (F1 to F5) of the seven factors are directly calculated from BECAS (i.e. Load Rating Ratio, Average Load Rating Rate of Change, Behavior Change, Service Level Stress Rate of Change, and Service Level Stress Margin). They are updated in a real-time or near-real time fashion to reflect the latest bridge condition and behavior. The other two factors (F6 and F7) designed to represent a bridge owner's opinion as to how the SHM data should affect the maintenance decision making process. Each of the factors are briefly described below.
- F1: Load Rating Ratio
Load Rating Ratio = Final Average Montiored Load Rating
Codified Load Rating(Eq. 1) F1 is the ratio of the load rating determined using the SHM system divided by the load rating based upon codified provisions. In most cases, this ratio is greater than 1.0 and, as such, demonstrates how valuable SHM data can be at accurately reflecting actual bridge behavior and performance.
- F2: Load Rating Rate of Change Factor = 1+ Average Load Rating Rate of Change
Average Load Rating Rate of Change is an output of the SHM system. It reflects the general trend in bridge capacity change including both magnitude and rate of change over time. Due to the natural structural deterioration process, the value of Average Load Rating Rate of Change is, in general, expected to be negative with a small absolute value.
- F3: Behavior Change
This parameter reflects how much the system performance is deviating from its baseline performance. Using the BECAS system described previously, behavior change is defined as one minus the smaller value of the violation rates calculated from the F-test or Strain Range Method determined by BECAS. A higher violation rate indicates a more significant deviation from its baseline level, and as a result a higher maintenance priority should result
- F4: Service Level Stress Rate of Change Factor = 1 - Service Level Stress Rate of Change
Service Level Stress Rate of Change is an output of the SHM system and it indicates the trend in measured maximum strain (i.e. maximum strain in each minute) indicating that stresses are increasing or decreasing over time. It could be either positive or negative and, in general, its absolute value is small. A positive value means that the service stress level is going up, therefore a higher maintenance priority is more appropriate and vice versa.
- F5: Service Level Stress Margin
Service Level Stress Margin = Codified Strain of HS20 with impact
Max Monitored Strain(Eq. 2) F5 is a measure of how the predicted service level strain compares with the measured strains. A value greater than 1.0 indicates the design live load strain is higher than the monitored service level live load strain. A larger value indicates the structural system has a higher live load capacity reserve; and therefore a lower maintenance priority would be appropriate.
- F6: Expert Opinion Factor
The F6 factor is used to allow a trained SHM engineer to provide an expert, holistic analysis of all of the collected data which can then be used to increase or decrease the maintenance priority. In an operational sense, the expert opinion factor would be determined by the organization preparing an annual summary report based upon the collected data and results from a "30,000 ft" review of the quantitatively measured performance.
- F7: Reduced uncertainty factor (default value 1/0.85)
By using the real time or near real time bridge condition/performance data collected by a SHM system in maintenance decision making, any uncertainty about bridge performance is reduced. This factor is applied to offset the uncertainties introduced during codified calculation and the 0.85 factor typically applied during design.
A weighting factor can be applied to each of the F1 to F7 values to reflect the priorities of an individual agency. In some ways, this can be considered as representing the values of the agency. For example, if capacity is the most important, then the weight factors can be adjusted as such. A weight factor higher than 1.0 indicates a higher maintenance decision making impact; while 0 means the user does not want a specific factor to play any role in the decision making.

Office of Bridges and Structures
Bridge Maintenance and Inspection Unit

Structural Monitoring Report
| Bridge ID: | 2518.0R080 | NBI Number: | 22309 |
| District: | 4 | Monitoring Team: | Advanced Structural |
| Report Date: | 2/22/2016 | NBI Number: |
22309 |
STRUCTURAL MONITORING SUMMARY DATA
General Information
Date: 2/23/2016
Monitoring period: 7/9/2015 to 2/23/2016
Maximum bridge temperature: 98.8 degrees Fahrenheit
Minimum bridge temperature: 1.7 degrees Fahrenheit
Number of single truck events: 68,158 (driving lane), 5,066 (passing lane)
General Behavior Information
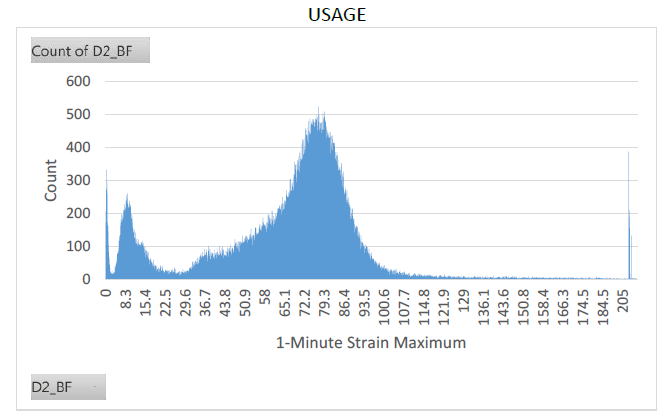
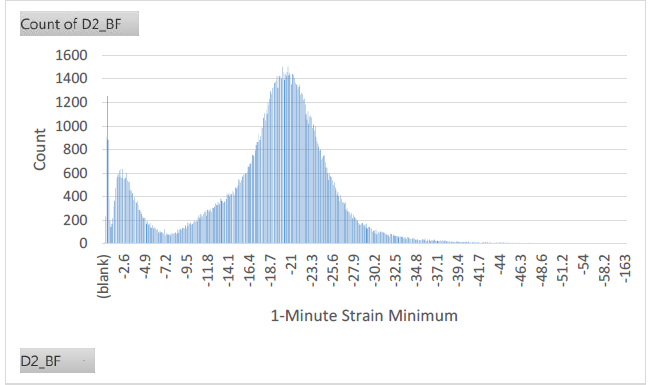
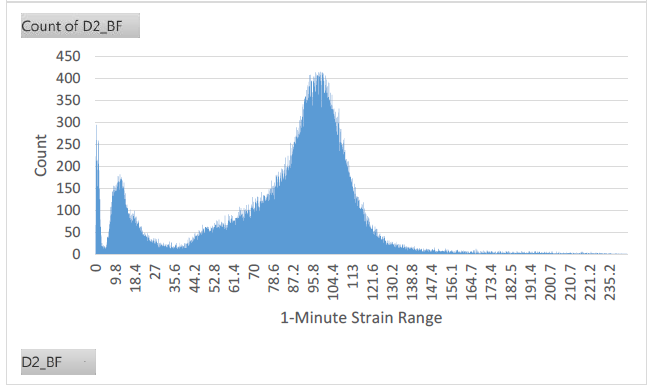
Maximum strain: 268.4 Location: D2_BF Usage: 33,667,224 ue/yr Minimum strain: -229.0 Location: D2_BF Usage: -9,524,644 ue/yr Maximum strain range: 329.9 Location: D2_BF Usage: 43,200,576 ue/yr
Threshold Exceedance Summary
Total number of threshold exceedances Maximum: 557
- Minimum: 190
- Range: 158
Location of highest number of exceedances
- Maximum: D4_BF
- Minimum: M2_BF
- Range: M1_BF
Load Rating Summary
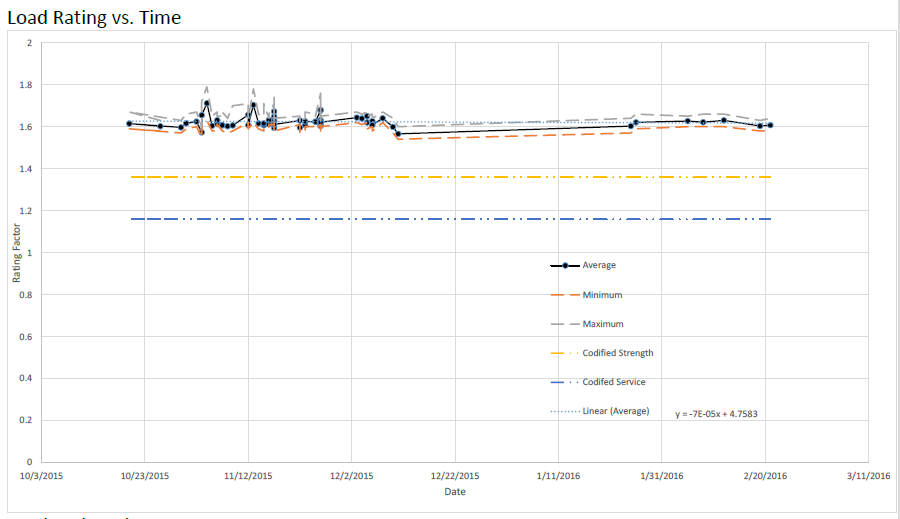
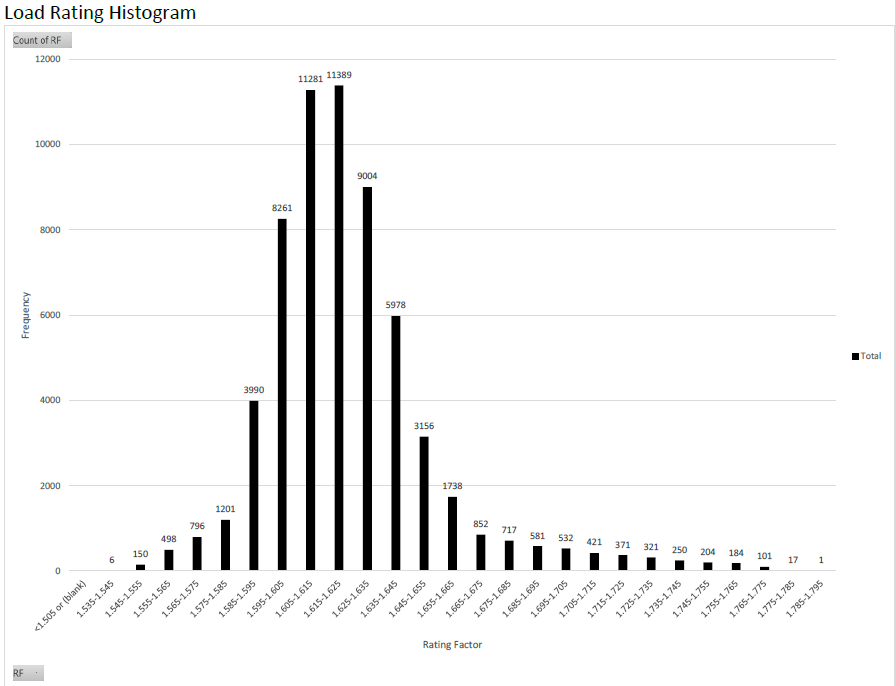
Initial Average Load Rating: 1.602 Critical Section: Exterior Girder, positive M region Final Average Load Rating: 1.608 Critical Section: Exterior Girder, positive M region Average Load Rating Rate of Change: -0.003 per year Maximum Load Rating: 1.79 Critical Section: Exterior Girder, positive M region Minimum Load Rating: 1.60 Critical Section: Exterior Girder, positive M region See additional details
Behavior Change Summary
F-Test Results
Maximum Violations: 164 Location: A2_BF Strain Range Results:
Maximum Violations: 2 Location: E3_BF Behavior at Select Locations:
Location Observed Behavior A2_BF High strains when temperatures are below freezing E3_BF Higher ranges of behaviors when temperature exceed freezing A4_BF Abutment bearing appears to lock-up at lower temperatures A5_BF Abutment bearing appears to lock-up at lower temperatures See additional details
SUMMARY OF MONITORING OBSERVATIONS
During the monitoring period over 70,000 single lane events were identified with approximately 93% of the events occurring in the driving lane. It appears that the highest stressed location is girder number 2 (mostly under the driving lanes) and that the maximum stresses occur in the positive moment region. Maximum measured stresses in the highest stress region were measured to be just under 8 ksi.
Maximum stress range at the maximum stress range location were measured to be just greater than 9.5 ksi. Maximum negative stress at this location (note that this a commonly positive bending location) were measured to be approximately -6.6ksi.
As a general measure of bridge usage, the 1-minute maximum, minimum, and strain range were collected throughout the monitoring period. These have been summed and then normalized to a yearly value. At the maximum strain locations, the normalized usage was Maximum=33,667,224 ue/yr, Minimum=9,524,644 ue/year, and Range=43,200,576 ue/year. As this is the first monitoring period no basis for comparison can be made. During subsequent monitoring periods these values will be reported to track changes in bridge usage.
During the monitoring period there were almost 900 threshold exceedances observed. The majority of these were due to the initial settings being too low. However video corroboration indicates that at times large strain events do occur with three or more trucks are on the bridge at a time. At various times during the monitoring period atypically configured trucks were observed to have crossed the bridge.
These atypical trucks were common sources of threshold exceedances. For a period of time during the monitoring period there was construction activity just "downstream" of the bridge. These activities sometimes resulted in the closing of one of the normal traffic lanes.
The initial and final load ratings are essentially the same (approximately 1.61). Over the monitoring period the load rating was estimated to be between 1.60 and 1.79. In all cases, the load rating was controlled by the exterior girder positive moment capacity. The exterior girder is likely carrying a higher than anticipated load due to the presence of the relatively large barrier rail which increases the total stiffness at the bridge edges. This behavior is not one commonly assumed during design. The fact that the highest stress region (mentioned above) is not an exterior girder, indicates that the location of the normal travel lane is not inducing large loads in the exterior girders. Should the traffic pattern change, this behavior will certainly change. Over the monitoring period, the load rating tended to decrease slightly – reducing at a rate of 0.008 per year. However, during the monitoring period no reduction in capacity (due to loss of section, etc.) was taken into account.
The behavior of the bridge was generally consistent throughout the monitoring period with one exception – the west abutment. It has been consistently observed that the west bearings transitions from a "free" condition to a more "fixed" condition as the temperature drops. Even more, once the temperature drops below freezing the bearings tend to display a marked increase in lock-up. While this is not likely causing any significant problems, this behavior is not as intended and if allowed to continue or worsen, may result in excessive stresses at the abutment.
LOG RATING DETAILS
Model Sites
The proposed model sites for this project will include installations of the BECAS system at all selected bridges. As mentioned previously, it is the hope that the selected sites will have notable diversity across many different aspects. Each BECAS installation will be custom-designed and configured for the site conditions. However, each system will be based upon the baseline sensing system previously described (e.g., dataloggers, strain sensors, etc.). However, consideration will be given to the unique characteristics at each location as well as any unique concerns/desires for monitoring expressed by the respective bridge owner.
Throughout the project each participating agency will receive annual reports like the one presented before. Additionally, a suggested SHMM will be provided which can be used, as mentioned above, to "tune" a numerically assigned valued from inspection and other qualitative data.
A5. Project Systems and Services
The systems that are the focus of the proposed project are bridges on one of the nation's busiest interstate corridors – Interstate 80. Interstate 80 is a vital transportation link for the traveling public, freight movements, and the military. With over 2,900 miles, Interstate 80 passes through 11 states with weather conditions that vary from greater than 110 degrees Fahrenheit to less than negative 40 degrees Fahrenheit. The combination of high traffic volumes coupled with high weight truck traffic and variable environmental conditions means the management of this corridor is quite complex.
A6. Deployment and Long-term Operation
The design, deployment, and long-term operation of the deployed system will be contracted to the industry partners participating in this work. These industry partners have worked to bring these emerging technologies to market following university-based research. Working together, the state and industry partners will first identify the bridges that will be monitored as part of this grant. The selection of these bridges will take into a number of factors including both needs within each state as well as trying to reach the goal of a diverse sample of bridges across all states. For example, it will be desirable to have a group of bridges representing multiple bridge materials (steel and concrete), type (girder, slab, etc.), age (newer, older), as well as with varying traffic volumes. Second, the industry partners will review bridge specific information and then develop the complete instrumentation/monitoring/testing plan. These plans will be presented to the state partners for comment and/or approval. Following approval, the industry partners will work with the state partners to deploy the approved systems on the selected bridges. It is anticipated that the State partners will provide access to each of the bridges to help facilitate system installation. For the duration of the grant, the industry partners will operate and maintain the systems. During this period the data will be monitored and each DOT will only be alerted when the system detects an anomalous situation. Further, during the monitoring period the industry partners will provide annual reports for each bridge to the respective owners. These reports will be formatted to be similar in flow and use to typical NBIS reports. It is anticipated that the participating states will have found that the installed systems are providing value for bridge management and will continue operating each of the deployed systems through further arrangements with the industry partners.
A7. Obstacles to Deployment
The primary obstacles to widespread deployment of the systems come from two primary sources. First, as was mentioned previously there have been a number of bridge monitoring systems that have been promoted as providing results. In some cases, these promises have not been fulfilled and bridge owners have grown very skeptical of bridge monitoring systems. Although the BECAS platform has been demonstrated on multiple bridges within the states participating in the developmental pooled-fund study, the additional deployments proposed through the US DOT Advanced Transportation and Congestion Management Technologies Deployment Initiative will give further confidence in the operation and value of the system. Even more, the widespread deployments proposed here will demonstrate how information learned from multiple deployments can be leveraged to learn about differences in performance and behavior in multiple temperature/geographic locations as well as following design/maintenance philosophies from different managing organizations.
The second obstacle to deployment is related to understanding how the benefit derived from such installations outweigh the costs associated with the deployments. There is little doubt that assessing bridge condition, safety, and performance is important to our nation's infrastructure. The implementation of the National Bridge Inspection Standards (NBIS) speaks to the importance. However, there are also recognized limitations to the current state-of-the-practice including the subjectivity of the inspector, inspections occurring only every other year, and others. When the National Bridge Inspection Program was first enacted, many bridge owners questioned the benefit derived given the cost of implementation. However, almost 50 years later there is little doubt that the program has helped to ensure an even safer bridge network. It will be through innovative model sites such as those proposed here that owners will begin to understand the value added through structural monitoring and our bridge evaluation methods will again evolve just as they did 50 years ago.
A8. System Performance Improvement
There are a number of ways in which the bridge network system performance will improve through the implementation of monitoring technologies. First, bridge owners will have information that will allow them to prioritize how, when, and where they spend their repair and rehabilitation funds. These improved allocations will come as a result of the fact that the bridge monitoring system will pinpoint where deterioration and/or damage is accumulating. Even more, bridge owners will have never before available information on which bridges are being used the most by actually measuring and counting stress cycles which are more directly related to usage than Average Annual Daily Truck Traffic. Second, although bridge failures are fairly uncommon (approximately 50 per year in the United States), the bridge monitoring system will provide timely notification of dangerous or impending dangerous conditions. Such information will allow owners to quickly react to situations that may quickly turn catastrophic. Third, through quantitative measurement of behavior, it will be possible for bridge owners to ensure that bridges are operating as they were designed. While some unintended bridge behaviors can be beneficial to the long-term performance, unintended behavior (e.g., bearing lock-up, etc.) can also create stresses levels in areas of the bridge that weren't designed to handle them. As will be noted in the schedule/tasks portion of this proposal, the project team will, to the extent possible, quantify system improvement realized from the deployment of these emerging technologies.
A9. Safety, Mobility, and Environmental Benefits
Bridge management is a complex melding of science/engineering, timing, and finance. Although completely impractical, bridge management philosophies can range from two extremes: (1) continuous maintenance and repair to maintain a constant condition regardless of the cost and (2) no maintenance regardless of the resulting condition. At one end (1) safety is maximized at a very high cost to the owner to (2) cost being minimized at the expense of a lack of safety assurance. Clearly, the best solution lies somewhere in between these two extremes – balance expenditures while maintaining a minimum level of safety.
It has been estimated by the South Carolina DOT that implementing bridge monitoring saves $7 for each $1 spent. Although the specific source of the savings isn't reported, it is most likely a result of being able to implement proactive rather than reactive bridge maintenance strategies (e.g., less expensive at strategic times). Even more, they estimate that through the use of bridge monitoring it is possible to extend the service life of a bridge by at least 5 years.
One further, but often overlooked, benefit of bridge monitoring relates to reduced exposure to work zones. Construction activities related to bridge replacement and rehabilitation are important contributors to traffic jams, reduced mobility, and, most importantly, to safety hazards. The safety hazards attributed to work zones is somewhat staggering. For example, there were over 87,000 crashes in work zones in 2010 with over 37,000 injuries. In 2010 there were 576 fatalities associated with work zones. A single fatality can cost society more than $3M. This is not the value of that life, mind you. Rather, this is what society must spend on litigation costs alone. The use of advanced bridge condition monitoring technologies offers bridge owners the opportunity to shorten and/or eliminate work zones associated with bridge repairs and rehabilitation by providing high fidelity, quantitative information.
From an environmental perspective, any reduction in work zones and or construction detours offers an opportunity for reduced carbon emissions associated with vehicle idling and out-of-distance travel. Even more, by implementing smaller, less invasive bridge repair strategies, owners may be able to minimize the direct environmental impact on the areas surrounding individual bridges.
A10. Vision, Goals, and Objectives for Technology Deployment
Strategic deployment of emerging technology for improving condition assessment has a long track record of improving the performance of many different types of assets. For example, following several catastrophic airplane failures in the 1970s and 1980s, the airline industry began several technology deployments: (1) scheduled inspection using nondestructive evaluation technologies and (2) integration of sensors within aircraft systems. Together, these deployments of advanced sensing technologies have markedly improved the state of aircraft management and maintenance. The long-term vision associated with this initiative would be to grow momentum and interest that would lead to the integration of sensing systems into new bridges (as part of the initial design) as well as installing systems on existing bridges. Adoption of new technologies is not usually a fast process. Slow, calculated adoption is very much the prudent path to follow as all technology needs to be vetted, evaluated, and the value determined. Such opportunities like the one offered through this grant represent an important step in the process. That said, a successful technology deployment through this initiative will provide the momentum towards nationwide adoption.
A11. Partnership Plan
Significant communication between all of the organization agreeing to participate in the I80 Group occurred during the proposal preparation process. For example, many face-to-face and virtual meetings were conducted between the various entities to discuss the project goals and objectives as well as to thoroughly review technical aspects of the proposed bridge monitoring system. This extensive pre-award communication and vetting resulted in a team committed to the deployment of the proposed emerging technology as a critical step towards revolutionizing the manner in which bridges are managed and that safety is ensured. Once the award is made, it is proposed that a Memorandum of Understanding (MOU) between all parties be created such that the obligations of each are outlined and understood. Once the MOU is in place, each of the participating entities will establish contractually relationships with the Iowa DOT (the project lead). These contractual relationships coupled with the group MOU will establish the form and function of the overall partnership plan. Throughout the execution of this grant, the project team will take advantage of opportunities to share the project (including scope, deliverables, products, quantifiable improvements, etc) with the bridge engineering community. For example, the project team will seek opportunities to make presentations at meeting such as the Annual Meeting of the Transportation Research Board, at annual meetings of the AASHTO Sub-committee on Bridges and Structures (SCOBS), as well as at the many technical conferences throughout the year. Further, at the end of the project, the project team will offer to conduct webinar training(s) on the deployments, lessons learned, and the benefits of implementation. Through these webinar(s), the project team hopes to create further opportunities to partner with other public and private entitities.
A12. Leveraging and Optimizing the use of Existing Technology Investments
There are several opportunities to leverage existing technology investments: (1) integration of other research-based installations, (2) shared infrastructure, (3) use of other collected information, and (4) sharing of information with other programs. First, as has been mentioned previously, the BECAS system was developed through a pooled-fund project led by the Iowa DOT. As part of that project several installations were completed and are still operating as of the preparation of this proposal – one of which is on Interstate 80. Even more, two additional installations (one on Interstate 80) are planned as part of other on-going projects. As has been mentioned, there is great power in the information produced by the BECAS system. However, there is even more knowledge generated when multiple installations offer opportunities to learn from information extracted from the larger data set (e.g., deterioration rates, load cycles, etc.). Second, recent advances in communication mediums (e.g., dynamic message signs) have resulted in the installation of both power and communication nodes at or near bridges. Where possible, the work proposed here will seek to leverage those nodes if and when it makes sense. Such sharing of power and communication lowers the overall cost of the installation such that, overall, more information can be collected at a greater number of sites. Third, by expanding the BECAS sites across a greater number of Interstate 80 sections, there will be an opportunity to evolve and expand some of the historical databases that are used, specifically, as part of the load carrying capacity algorithm. By integrating additional weigh-in-motion sites into the database, a greater understanding of the diversity/similarity of loads that travel on a nationwide, major corridor. Fourth, the Federal Highway Administration (FHWA) has an on-going project known as the Long Term Bridge Performance Program (LTBPP) for which, they plan to collect behavior information on a number of bridges throughout the country. Given the similarity in raw data that the LTBPP and BECAS use, it seems like a natural opportunity to share information. To accomplish this, the team proposing here will work to have the collected data made available via the so-called bridge portal.
A13. Project Schedule
It is proposed that the work described herein be performed over a 48 month period. In this section the proposed work has been divided into nine Tasks each of which are described below. Additionally, a Gantt-style chart is provided below to show the approximate timing of each task. For convenience in preparing this chart, it has been assumed that the work will start January 1, 2017. However, the project team is extremely flexible on the actual start date. It is important to note that a total of four specific project deliverables are proposed as further outlined below: Task 1 – Kick-off Meeting, Task 2 –Monthly Progress Reports, Task 8 – Annual Report, and Task 9 – Final Report.
Task 1 – Kick-off Meeting
Within 4 weeks of award, the project team will conduct a kick-off meeting. Given the geographic diversity of the participants, it is likely that this meeting will be conducted using online meeting software. Although the agenda for the kick-off meeting has not been yet finalized, it is anticipated that the goals and the general scope of the project will be discussed in great detail. Also of importance during this kick-off meeting will be discussing the desired attributes of the model sites which will be selected and finalized in Task 4. Although the individual State DOT partners will make the final decision regarding the characteristics of the group of model sites, it is anticipated that the complete set of sites will contain notable diversity in bridge location, bridge size, bridge material, local weather conditions, and local traffic volumes. The result of the kick-off meeting will be summarized in a brief report, submitted to the stakeholders for approval, and then submitted to the U.S. DOT as the first deliverable.
Task 2 – Monthly Progress Reports
At the end of each month during the project period, the project team shall prepare and submit a two part progress report consisting of a (1) a status update letter that provides a description of work completed on each task during that month, an estimate of work to be completed in the following month, and a summary of any problems encountered (or anticipated) that may have implications on the project plus (2) a project progress schedule which will document the percentage completion for each task as well as an estimate of the total project completion. Additionally, a summary of estimated project expenditures will be provided.
Task 3 – Quarterly Stakeholders Meetings
Every three months following the kick-off meeting, a meeting of the stakeholders will be held to update each of the participants of the project status and to offer a forum to obtain input. These meetings will generally be conducted using online meeting rooms. However, it may be advantageous, from time-to-time, to conduct these meetings in person. When deemed advantageous, the project team will meet with the stakeholders at a mutually convenient time and location.
Task 4 – Model Site Selection
One of the important items that will be discussed during the Task 1 Kick-off Meeting will be the criteria used to select the model sites. The technical project team will work individually with each of the participating states to identify candidate bridges for inclusion in the project. Once the group of candidate bridges have been identified in all states, the project team will apply the criteria established during the kick-off meeting to develop a list of proposed model site locations plus a list of alternate sites. In addition to the criteria established during the kick-off meeting, it is anticipated that the technical team will do an initial cost assessment for the candidate sites. This initial cost assessment will be used to ensure that the maximum number of high quality sites can be included in the project while working within the constraints of the project budget. Following selection of the proposed model sites, the technical team will convene a special meeting with the stakeholders to discuss and finalize the model site locations.
Task 5 – System Design and Initial Configuration
Following finalization of the list of model sites, each of the bridge monitoring systems will be designed, initially configured, and fully bench-tested. Following the design, the home state for each installation will be given the chance to review and comment on the system design and layout. Working collaboratively, the team will finalize the configuration and acquire the needed components. Once obtained, the components will be individually tested and then integrated together and fully bench tested. The technical team has found that these benchtop tests are essential at eliminating bugs in the system that can prove to be cumbersome to fix during the installation process.
Task 6 – System Installation and Final Configuration
Once each system has been fully bench tested and initially configured in Task 5, each system will be installed on the intended bridge. During the installation process, the industry participants will be responsible for the actual installation operations and each DOT will be responsible for providing needed access and any maintenance of traffic (MOT). During installation, each system component will be individually tested for operational performance and then each complete system tested for system performance.
Task 7 – System Operation
Immediately after installation, each system will be activated immediately with needed settings established shortly after activation. Working with each DOT, the project team will determine who should receive system notifications and establish a formal set of communication protocols. Following system activation, each system will be operated for the duration of the project. Every 12 months following system activation, the project team will prepare a Structural Monitoring Report similar to that presented previously for each bridge. Training will be provided to each DOT on how to interpret and use the provided information to enhance their bridge management approaches and philosophies. All bridge reports will be included in the overall project report prepared in Task 9.
Task 8 – Annual Reporting
Every 12 months following the award, the project team will prepare and submit an annual report to the U.S. DOT. This annual report will document activities completed including describing each deployment, a summary of all costs associated with each deployment (both installation and operation), along with a summary of how the project has met the original project goals, objectives, and expectations. Additionally, each of the annual Monitoring Reports mentioned in Task 7 will be included as appendix material for each annual report.
Task 9 – Final Reporting
At the conclusion of the project a comprehensive project report will be developed that describes all aspects of the project. In many ways it is anticipated that the final report will be a Task-by-Task summary of what has been accomplished including all of the information contained in each of the annual reports (including each of the annual bridge reports). In addition to providing a summary of the entire project, a portion of the report will be devoted to guidelines and needs for further implementation of the emerging technology.

A14. ITS Program or Innovative Technology Initiatives
Although there is not a direct connection between the proposed emerging technology and most of the DOT ITS initiatives, a common theme does exist: increasing safety. Even more, the proposed bridge monitoring systems can easily be expanded to include weather base stations which will enhance the fidelity of information available for the US DOT road weather connected vehicle applications research. Additionally, the bridge usage information collected and report by the BECAS system adds an additional piece of information regarding traffic volumes and usage.