Grant Proposal for U.S. Department of Transportation Advance Transportation and Congestion Management Technologies Deployment (NOFO 693JJ317NF0001): Volume 1 – Technical Application
5.0 EXISTING CONDITIONS & PROBLEMS
5.1 Environmental Challenges
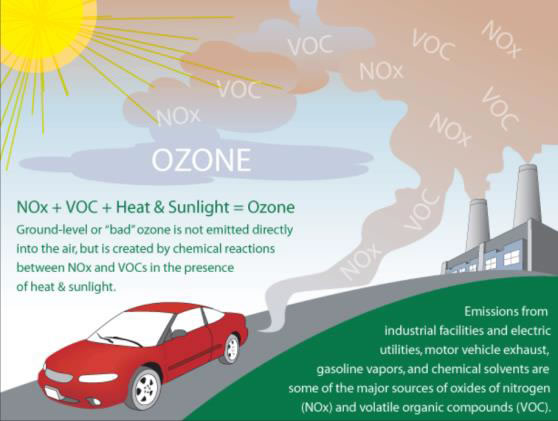
The San Diego metropolitan area (which includes Chula Vista) is ranked number seven for the highest level of ozone pollution in the nation.1 Chula Vista has been hit especially hard by the negative impacts of ozone and other greenhouse gases. For example, the City has the highest number of emergency room visits (per 100,000 population) in the region due to asthma-related disease.2 In addition, the City also has the highest number of deaths in the county due to chronic disease (cancer, heart disease & stroke, type II diabetes, and lung disease).3 Stroke and lung disease are directly caused and/or exacerbated by ozone and greenhouse gases.
Cars and trucks are some of the main culprits and emitters of gasses such as nitrogen oxides, volatile organic compounds, and carbon monoxide that lead to high levels of pollutions in our region. These gases, when they come in contact with sunlight, create ozone which leads to respiratory diseases and stroke. As part of this grant, Chula Vista proposes a number of solutions (Section 6.1) to strategically reduce fuel consumption, ozone levels, and other vehicle emissions, to provide cleaner air for our citizens. As a secondary, but very important benefit, our proposed solutions will also create a smarter, safer, and more efficient transportation system for all our users.
5.2 Socioeconomic Challenges
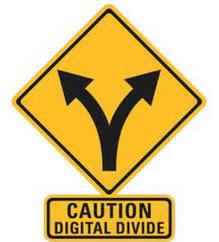
The City, as many other cities in the country, faces a number of social and economic challenges. However, one unique challenge and reality, is that the City faces a digital, education, social, and economic divide. In 1986, the City essentially became divided at the I-805 freeway with an "older" and lower income community on the west side and a new more affluent and modern community on the east side. With more, and newer, development on the east side, the eastern portion of the City benefits from newer infrastructure, newer and better equipped schools, as well as higher household income levels. On the west side, the higher density, lower income, and infrastructure-challenged community feels disconnected and, in many cases, "second-fiddle" to their counterparts in the east.
Although, the City has a number of programs, and funding, such as Measure P (special
sales tax to fund aging/obsolete infrastructure over the next 10 years), these efforts have
not been sufficient.
Recent history shows that large numbers of school-age students on the west side have applied for (and received) transfers from their district-assigned home schools to attend the higher-rated schools in the east. This creates a transportation challenge for the students and their families. In addition, as the 2nd largest city in the county, approximately 20% of Chula Vista's 268,000 residents will be disabled or aged 65+ years by 2030. To be successful, the City must improve access to all modes of transportation for this increasingly vulnerable community. Through this grant, we are proposing a number of solutions (Section 6.2 & 6.4) with enhancements to public transportation, digital/internet/education accessibility, and more, primarily on the west side, to try to bridge that gap and help bring the two communities closer together so we can become ONE again.
5.3 Mass Transit Challenges
Buses have long been recognized as a mass transit solution that provides efficiency in transportation mobility and relieving traffic congestion. It has become the City's focus to continue promoting mobility and accessibility in the development of transportation facilities and land use. This commitment spawns from the City's Strategic Plan Goal to "Ensure a sustainable and well-maintained infrastructure to provide a safe and appealing communities to live, work, and play". The City believes continued investments in mass transit provide sustainable benefits that are integral to a healthy and connected community. With buses as the primary mode of mass transit options available to Chula Vista residents, Chula Vista has an above average usage of public transportation when compared regionally within the San Diego County.4 The potential to increase public ridership is apparent with the growing need. The City has four high frequency bus routes and a future bus rapid transit route under construction:
High Frequency Routes/Corridors:
- Route 932: Broadway between Northern City Limits to Southern City Limits
- Route 929: Third Avenue between Northern City Limits to Southern City Limits
- Route 709: H Street/East H Street between Interstate 5 to Southwestern College
- Route 932, 701, 704: Main Street between Hollister Street to Brandywine Avenue
Future Bus Rapid Transit Corridor:
- Southbay Bus Rapid Transit: I-805/East Palomar to Otay Mesa Transit Center/USMexico Border
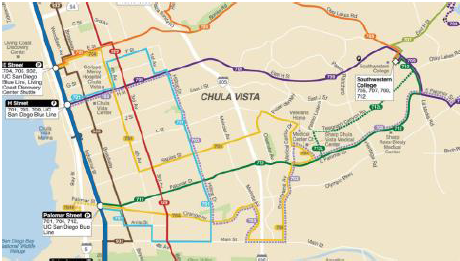
Each of the high frequency routes have been designated by SANDAG as future regional bus rapid transit corridors. Two in particular have been identified as the top-ten most congested affected routes in the region which includes Route 929 and Route 709. The two bus routes represent a heavily used transit network due to its connectivity to the US-Mexico Border and a community college located along the eastside of Chula Vista. Bus Route 709 is interconnected with the San Diego Blue Line Trolley which is located near Interstate 5 and is considered the regions highest ridership trolley service.
Recently, SANDAG conducted a planning study called "Improving Bus Operations and Traffic (IBOT)" which identified in the region where transit signal priority (TSP) technology would boost the efficiency of the transit system. The study consisted of a multi-dimensional analysis framework for all transit runs across the San Diego County to identify where reliability of transit service is being affected by congestion. Using automated passenger count to assess ridership, automated vehicle location (AVL) data to measure bus delay, signal timing and block length, and driver & passenger feedback surveys; the IBOT study identified H Street, Route 709 and Third Avenue, Route 929 as the two of the top-ten corridors that would most benefit from TSP implementation. The study conducted a cost-benefit analysis and found that implementing TSP on these corridors will improve transit operations, reduce transit trip times, and improve overall mobility.5 The results of this study have made evident the need to expand and implement TSP operations in Chula Vista. This need can be accomplished through the application of this grant.
5.4 Traffic Congestion Management Challenges
Historically, the City's planning model spurred the development of suburbs outside the urban core that are characterized by separated land uses, especially between residential and non-residential uses. Zoning ordinances were used to create barriers to protect residential communities from mixed land-uses. This "conventional" planning model of separation was enabled by the automobile and the building of automobile-centric transportation infrastructure. This has included freeways that bifurcated the west and east side of City, large arterials, and wide local roads. This impact is felt today with average daily traffic volumes of major arterials reaching 30,000-50,000 vehicles. This has spurred a growing problem with managing traffic with infrastructure as the first line of defense.
In 1988, the City of Chula Vista formed the Growth Management Oversight Commission (GMOC). The GMOC was to monitor growth by establishing a set of standards of city services that protect the "quality of life" of residents. One of the established standards includes maintaining the Level of Service (LOS) of city streets by measuring average speeds. Through the years, the City has actively monitored traffic conditions and identified problem areas as the City grew. Increasingly, however, mitigating traffic congestion required a two-fold approach in infrastructure and non-infrastructure improvements. It is therefore the City's focus to implement technologies that can mitigate the traffic capacity issues faced today.
The continuing problem areas in Chula Vista include the trolley grade crossings, community college traffic, and traffic near interstate freeways. These roadways represent roadways which have exceeded capacity. Chula Vista is ready to implement strategies that mobilize traffic more effectively through route alternative solutions to improved
signal operations.
5.5 Traffic & Public Safety-Related Challenges
5.5.1 Intersection Safety
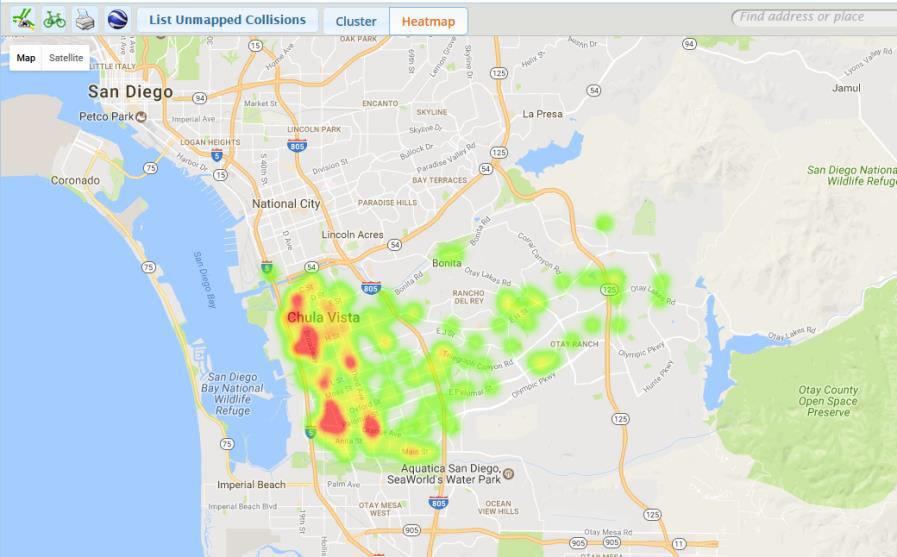
An analysis of the Statewide Integrated Traffic Records System (SWITRS) over the last five years reports that a total of 6,088 persons were involved in 4,231 collisions on Chula Vista roads. The most prevalent type of collisions was classified as "C – Rear End" (34%) closely followed by "D – Broadside" (26.2%), with the primary collision factor identified as "Traffic Signals and Signs" (at intersections) in 368 of the total collisions. The figure to the right provides a visual representation of the locations in the network where these crashes have occurred in the same time period. Note that the highest number of crashes took place along Broadway which is a main corridor that runs north-south in the western side of the city. This roadway has a very high pedestrian activity with commercial and retail opportunities. A number of improvements have been implemented on this corridor over the years; from traffic signal modifications and improved signage and striping to periodic police enforcement on the lookout for speeding and red light-running offenders with limited success. Our safety-focused proposal to address this ongoing issue would establish a Smart Corridor equipped with cutting-edge technology to enhance safety and efficiency in this area (Section 6.3).
5.5.2 Emergency Fire Response
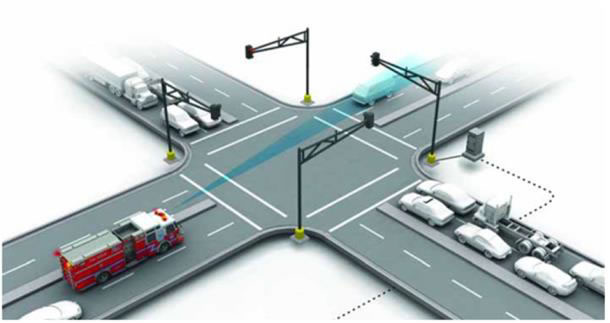
The time it takes an ambulance/fire truck to respond to an emergency call is critical. Seconds are precious and can be the difference between life and death and/or loss of property. A measure of every Fire Department's effectiveness is their fire response time.
The City Fire Department fire response goal is 7 minutes 80 percent of the time, but, according to the City's Growth Management Oversight Commission (GMOC), our Fire Department has not met that goal for the past six years. As a point of reference, the National Fire Protection Association's "gold standard" for fire response time is under 6 minutes 90 percent of the time. In May 2017, Chula Vista's firefighter union president stated that our Fire Department has the worst fire response time in the state of California. To put this in a more real life/death perspective, with every minute it takes for Fire/ambulance to arrive to a cardiac event, a patient's chance of surviving drops 7 to 10 percent, according to the Sudden Cardiac Arrest Foundation. Therefore, it is absolutely critical that we address the fire response time in our city. Through the use of new technologies and transportation system improvements, we are able to provide solutions to significantly improve fire response times in our city (Section 6.3.3).
5.5.3 Street Lighting Systems
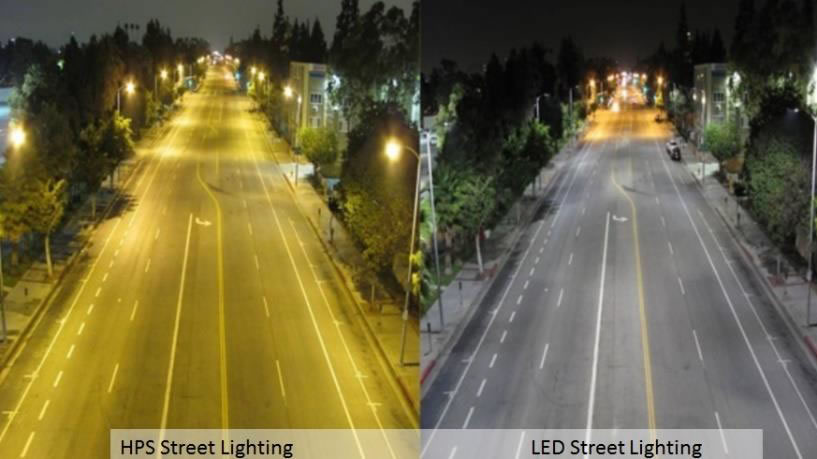
The City has a Chief Sustainability Officer who leads the City's Smart Cities program and manages the conservation and environmental services divisions who develop and implement the cities climate adaptation plan. In addition, Chula Vista has been a regional leader in energy savings and conservation for over a decade with the deployment of one of the first citywide LED street light implementations in the county. The installation of citywide LED street lights presented the City with a great opportunity to be more environmentally friendly in its approach to the use of energy conservation and significant savings versus the traditional High Pressure Sodium (HPS) lighting. However, at this time, adaptive/intelligent street lighting systems have become available and represent a terrific option to reduce energy consumption, enhance asset management, and provide a receptacle for many advanced technology systems with various benefits to the community and various City departments. Through this grant, the City proposes a strategic deployment of intelligent and Eco-friendly solutions with a suite of sensors to assist in the monitoring of various traffic and environmental issues (Section 6.3.1).
5.6 Infrastructure and Maintenance Challenges
Chula Vista size and population will continue to grow as large undeveloped areas along the southeastern boundary and Bayfront are poised for development. This will mean more roads, more traffic, and increase in transportation demand management. It is therefore imperative that systems are in place to manage the various existing assets as well as those
deployed under this grant. Monitoring these assets will be essential in preventative
maintenance and prolonging the life of the systems deployed.
While it is important to integrate new technologies with existing assets and save on costs,
it is also important to identify technologies that have become obsolete. Chula Vista's
biggest challenge is to replace existing obsolete traffic controllers, communication
equipment, and/or antiquated pole equipment. The asset management system and
proposed improvements under the ATCMTD grant will help bridge the gap, allowing
system operators to effectively maintain system health.
1 American Lung Association, 2017, http://www.lung.org/assets/documents/healthy-air/state-of-theair/state-of-the-air-2017.pdf [Return to Note 1]
2 County of San Diego Health and Human Service Agency, June 2012, http://www.sandiegocounty.gov/content/dam/sdc/hhsa/programs/phs/documents/CHSChronicDiseaseAtlas_Asthma_2012.pdf [Return to Note 2]
3 County of San Diego Health and Human Service Agency, 2014, http://www.sandiegocounty.gov/content/dam/sdc/hhsa/programs/phs/CHS/3-4-50/3-4-50_South_Brief_2015.pdf [Return to Note 3]
4 County of San Diego, 2017, http://www.sandiegocounty.gov/content/dam/sdc/hhsa/programs/phs/CHS/demographics/2015_Demographic_Profiles.pdf [Return to Note 4]
5 SANDAG, IBOT, Nov 2016, http://sandag.org/uploads/publicationid/publicationid_2014_20482.pdf [Return to Note 5]