
Houston Managed Lanes Case Study: The Evolution of the Houston HOV System
NOTICE
This document is disseminated under the sponsorship of the Department of Transportation in the interest of information exchange. The United States Government assumes no liability for its contents or use thereof.
Technical Report Documentation Page
| 1. Report No. FHWA-OP-04-002 |
2. Government Accession No. | 3. Recipient's Catalog No. | |
| 4. Title and Subtitle Houston Managed Lanes Case Study: The Evolution of the Houston HOV System |
5. Report Date September 2003 |
||
| 6. Performing Organization Code | |||
| 7. Author(s) Katherine F. Turnbull |
8. Performing Organization Report No. Report |
||
| 9. Performing Organization Name and Address Texas Transportation Institute The Texas A&M University System College Station, Texas 77843-3135 |
10. Work Unit No. | ||
| 11. Contract or Grant No. DTFH61-01-C-00182 |
|||
| 12. Sponsoring Agency Name and Address Operations Office of Transportation Management Federal Highway Administration Room 3404, HOTM, 400 Seventh Street, S.W. Washington, D.C. 20590 |
13. Type of Report and Period Covered Research: |
||
| 14. Sponsoring Agency Code | |||
| 15. Supplementary Notes Jon Obenberger, FHWA Operations Office of Transportation Management, Contracting Officers Technical Representative (COTR) |
|||
| 16. Abstract A nine-mile contraflow HOV lane on the I-45 North Freeway in Houston, Texas was implemented as a demonstration project in 1979. This demonstration borrowed an off-peak direction traffic lane for use by buses and vanpools in the peak direction. Although in use only during the morning and the afternoon peak periods, the contraflow lane carried some 15,000 persons in buses and vanpools on a daily basis. The success of this facility resulted in the development and operation of the extensive system of HOV lanes, park-and-ride lots, improved transit services, and other elements. The operation of the Houston HOV system has evolved over the years to include a value pricing demonstration program in two corridors. Further, managed lanes are being developed as part of a major improvement program in one freeway corridor. This report highlights the development, operation, and use of the HOV system in Houston and the evolution toward managed lanes. The institutional arrangements supporting the development and the ongoing operation of the system are presented. As of 2003, some 100 miles of HOV lanes are in operation in six freeway corridors. The lanes are supported by 28 park-and-ride and four park-and-pool lots, transit centers, and express bus services. In 2003, the lanes carried some 121,079 passengers in buses, vanpools, and carpools on a daily basis. This report also summarizes the issues that may be associated with the development and operation of managed lanes. The Houston case study and the summary of issues should be of benefit to transportation professionals and policy makers interested in developing and operating HOV facilities and managed lanes. |
|||
| 17. Key Words High-Occupancy Vehicle Lanes, HOV Lanes, HOV Facilities, Managed Lanes, Contraflow Lanes |
18. Distribution Statement No restrictions. This document is available to the public through NTIS: National Technical Information Service 5285 Port Royal Road Springfield, Virginia 22161 |
||
| 19. Security Classif. (of this report) Unclassified |
20. Security Classif. (of this page) Unclassified |
21. No. of Pages 48 |
22. Price |
Form DOT F 1700.7 (8-72) Reproduction of completed page authorized
Houston Managed Lanes Case Study:
The Evolution of the Houston HOV System
Katherine F. Turnbull
Texas Transportation Institute
The Texas A&M University System
College Station, Texas
September 2003
ACKNOWLEDGMENTS
This study was conducted in cooperation with staff from the Federal Highway Administration (FHWA). Jon Obenberger, FHWA Operations Office of Transportation Management, served as the Contracting Officers Technical Representative (COTR). Mr. Mark Olson, FHWA – Austin; Mr. Gary Trietsch, and Mr. Carlos Lopez, Texas Department of Transportation (TxDOT); and Mr. John Sedlak, Mr. Jeff Arndt, and Mr. Loyd Smith, Metropolitan Transit Authority of Harris County (Houston METRO) provided information and reviewed sections of the draft report. In addition, the following Texas Transportation Institute (TTI) staff assisted with the study. Bonnie Duke, was responsible for word processing on the report, Gary Lobaugh, provided editorial review, John Hobbs assisted with the graphics, and Tina Collier helped with the QuickRide summary. The assistance of these individuals is both recognized and appreciated.
TABLE OF CONTENTS
CHAPTER ONE—INTRODUCTION
Objectives of Study
Defining HOV and Managed Lanes
Overview of Houston Area
Activities Conducted
Organization of this Report
CHAPTER TWO—EVOLUTION AND USE OF THE HOUSTON HOV LANE SYSTEM
Development and Operation of the HOV Lane System
Use of the HOV Lane System
QuickRide Value Pricing Demonstration
Development of Katy Freeway Managed Lanes
Future Directions
CHAPTER THREE—INSTITUTIONAL ARRANGEMENTS
Formal Agreements
Informal Arrangements
Factors Influencing the HOV and Managed Lane System
CHAPTER FOUR—DEVELOPING AND OPERATING MANAGED LANES
Issues to be Considered
Federal Interest in HOV Operational Changes
Current and Future Activities
LIST OF FIGURES
- Location of I-45 North Contraflow Lane.
- I-45 North Contraflow Lane
- 1985 Houston HOV Lane System
- 1995 Houston HOV Lane System
- 2003 Houston HOV Lane System
- Katy (I-10 West) HOV Lane
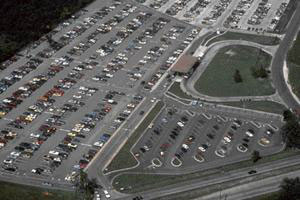
- Fuqua Park-and-Ride Lot
- Direct Access Ramp to Kuykendahl Park-and-Ride Lot
- Direct Access Ramp
LIST OF TABLES
- Changes in Vehicle Occupancy Requirements and Corresponding Vehicle Volumes on the Katy HOV Lane
- 2003 Houston HOV Lane Parameters and Weekday Utilization Data
- Change to 3+ Occupancy Requirement on the Katy HOV Lane
- Houston HOV Lane Park-and-Ride Lot Capacity and Utilization
- Houston HOV Lane Park-and-Ride Lot Capacity and Utilization by Corridor