Congestion Pricing - Links to Congestion Pricing Home

2.0 TELECOMMUTER SURVEYS

2.1 Purpose and Approach

The Minnesota UPA telecommuting project is being conducted by the Hubert H. Humphrey Institute of Public Affairs at the University of Minnesota, with funding from the state of Minnesota. As noted in the telecommuting test plan, the Minnesota UPA telecommuting program encompasses the Minneapolis-St. Paul metropolitan area, whereas the national evaluation is interested only in the impact of the telecommuting program on traffic congestion on I-35W.

The Institute has contracted with a consulting team that includes expertise in market research, branding and promotion, outreach, and survey research to assist with developing and implementing the project. The project includes an evaluation component. Surveys of telecommuters and employers participating in the telecommuting program represent important elements of the evaluation.

The Minnesota UPA national evaluation team will utilize the survey results in the telecommuting analysis and other analyses. Members of the Battelle team are working with researchers from the Humphrey Institute to coordinate the use of the survey results in the national UPA evaluation.

The UPA Telecommuting Program for the Twin Cities and the Telework Initiative Implementation Plan reports prepared by the Humphrey Institute, present the telecommuting program elements, including a discussion of the surveys of participating employers and employees. The outlines of the surveys include a variety of questions addressing employer and employee satisfaction and comfort with the different telecommuting options. The surveys also contain questions on commute travel behavior of benefit to the national evaluation in assessing the impact of the telecommuting program on traffic congestion on I-35W. An on-line evaluation webpage, known as the eWorkPlace Commute Tool, is being implemented to track data on the program participants. Another on-line tool, SurveyMonkey, is being used on an interim basis with participating employers and employees until the eWorkPlace Commute Tool is available.

As outlined in the Telework Initiative Implementation Plan, participating employees will complete on-line surveys at three intervals over a nine-month period. The following schedule is outlined in the implementation plan for these surveys.

  • Participants will complete the first survey when they enroll. The initial survey focuses on current commute patterns and perceptions of telecommuting.
  • Participants will complete the second survey after three months of telecommuting. Travel patterns during the telecommuting period will be documented, along with the experience to-date and any potential issues.
  • Participants will complete the third survey after nine months of telecommuting. This survey will focus on longer-term travel behavior changes and satisfaction with telecommuting.

It is also anticipated that surveys and interviews will be conducted with employers participating in the program. These surveys and interviews will obtain information on the employer's perspective of the telecommuting program, including potential transportation impacts.

2.2 Survey Questionnaires

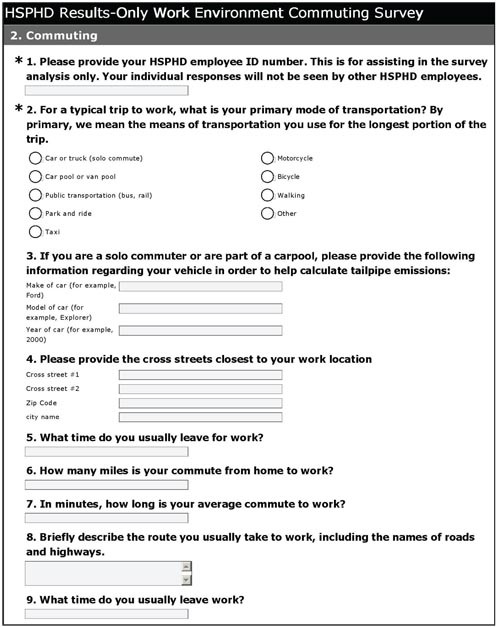
Researchers from the Humphrey Institute have provided the national evaluation team with a copy of the initial SurveyMonkey questionnaire being used with the Human Services and Public Health Department (HSPHD) ROWE participants. The survey, which takes approximately 30 minutes to complete, is being used to help identify possible ROWE participants. The survey includes questions on current commuting patterns, attitudes about ROWE, demographic information, and a one-day travel diary. The commute-related questions are presented Figure 2-1.

2.3 Analysis Methods

The Humphrey Institute will be evaluating the entire telecommuting program for the metropolitan area, including assessing employer productivity, employer costs, and other factors. The national evaluation team will focus on the transportation impacts on I-35W from employees participating in the telecommuting, ROWE, and flexible work arrangements program. The national evaluation is interested in trips removed from I-35W. Questions 8 and 11 in the survey in Table 4-1 addresses the routes, including the names of roads and highways, the individual usually takes to and from work. This information will be used to identify telecommuters normally traveling on I-35W to include in the Minnesota UPA national evaluation. Examples of the analysis that will be conducted by the national evaluation team using the survey results are highlighted below.
  • Reduction in VMT due to eliminating trips. The reduction in VMT from eliminating trips by workers telecommuting, including participating in ROWE, will be analyzed. Data needed for this analysis includes the number of participants, the frequency of telecommuting/ROWE, and the normal commute trip lengths of participants. The portion of the trip on I-35W will be estimated to identify VMT reduction on the freeway.
  • Change in commute travel times due to flexible work arrangements. The survey results will be used to identify participants changing their commute time of travel to outside the peak periods and to less congestion periods due to flexible work arrangements. The potential impact of these changes on I-35W will be estimated.
  • Mode shift due to participating in the telecommuting program. The potential exists that some participants may change their travel mode on days they are not telecommuting or as part of changing to a flexible work arrangement. The national evaluation team will analyze the survey results to identify any changes in commute mode and will assess the potential impacts of these changes on congestion on I-35W.
A view of the electronic forms shows commute-related questions that require specific information regarding the vehicle, streets closest to work location, and distance and timing of the commute.

Figure 2-1. HSPD ROWE Commuting Survey
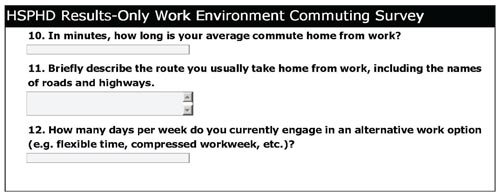

A view of the electronic forms shows commute-related questions that require specific information regarding the length of the commute, the roads and highways used, and the number of days per week that provide alternative work options.

Figure 2-1. HSPD ROWE Commuting Survey (Continued)

As previously discussed, the Humphrey Institute is conducting this survey as a panel survey, with the same respondents providing responses to survey questions at enrollment, three months post enrollment, and nine months post-enrollment. As with any panel survey, it is important that the statistical analysis account for the nature of the survey, particularly recognizing that each respondent (“subject”), serves as their own control. The national evaluation team will utilize longitudinal models that explicitly account for the “within person” variability through the use of mixed models. These general linear models (GLMs) will follow the general form indicated in Equation 1.

Equation 1. Responseij = μ + ß1 * Timei + ... + Respondentj + ∈ij

where:

ß1 is the estimated linear trend in the response across the three survey time periods;

Respondentj is a random effect estimating the “within person” variability and accounts for the fact that multiple responses are measured from the same survey participant; and,

ij is the explained variation in the model (or in the case where the response is being modeled as a mixed-model logistic regression model, this term does not exist).

Within the context of this modeling framework, we will use model-based estimates to conduct hypothesis testing and to estimate average values for different combinations of explanatory factors. In particular, statistical tests performed on the ß1 will provide a convenient method for testing to determine if there is a statistically significant linear trend over time in the response. Interaction terms with this effect will be used to examine if this linear trend differs for different response groups.

Table 2-1 summarizes the anticipated statistical power and/or precision of sample estimates for each of the data elements and measures of effectiveness presented in Table 2-1. In developing these estimates, we have assumed that 500 of the anticipated 1,700 survey participants will complete the survey for all three waves and that the modeling framework described above will be used as the statistical methodology. Other necessary assumptions are presented in the table.

Based upon historical levels of key performance measures2, there should be sufficient statistical power to detect meaningful levels of differences (provided they exist) in the key national evaluation measures. In particular, we anticipate the following:

  • The ability to achieve a statistical power of 77 percent for detecting an increasing trend larger than 7.5 percent in the percentage of carpoolers over the three survey waves who have switched to carpooling as a result of the UPA.
  • The ability to identify a 10 percent decrease (or greater) over time in the percentage of commuters departing during peak am rush hour times (6:30-9:00 am) from pre-UPA percentages of 58 percent.
  • The ability to detect a relative change of 6 percent in both the distance (miles) and time (minutes) over time as a result of the UPA from baseline levels with over 90 percent statistical power.
  • The ability to conduct statistical tests among different groups of users with 90 percent power, provided that each group is comprised of approximately 250 respondents.
Table 2-1. Anticipated Statistical Power for Data Elements, and National Evaluation Measures of Effectiveness from the Humphrey Institute's Surveys
Data Element Measures of Effectiveness Analysis Method/Assumptions Expected Effective Sample Size Anticipated Statistical Power
1.1 Mode for typical work trip
  • Percent by mode
  • Repeated Measures Logistic Regression Model
  • Percentage of telecommuters carpooling prior to UPA is 20% based upon 2000 census
  • Same respondents in all three survey waves
  • 500 respondents across 3 survey waves
Statistical Power for Detecting an Increase in the percentage of carpoolers over the three survey waves

Increase of 5% - 45% Power
Increase of 7.5% - 77% Power
Increase of 10% - 91% Power
1.2 Vehicle used for work trip: make/year/model
  • Used in emissions calculation
  • Cost to employee per trip saved by telecommuting
Cost savings are direct functions of travel distance, travel time, and vehicle type See VMT Reduction Cost savings are direct functions of travel distance, travel time, and vehicle type See VMT Reduction Cost savings are direct functions of travel distance, travel time, and vehicle type See VMT Reduction
1.3 Departure times for trips to and from work
  • Commuters who shift their travel times to off-peak hours
  • Repeated Measures logistic regression model
  • Percentage of commuters departing in core morning rush hours (6:30 – 9:00) is 58%
  • 500 respondents across 3 survey waves
Statistical Power for detecting a significant decreasing trend in the percentage of commuters departing between 6:30 and 9:00

Decrease of 5% - 20% Power
Decrease of 7.5% - 54% Power
Decrease of >10% - 83% Power
1.4 Length of work trip in miles and minutes
  • VT and VMT reduction in the I-35W corridor in the peak hours
  • Cost to employee per trip saved by telecommuting
  • Repeated Measures Mixed Model (GLM)
  • Average commute distance prior to UPA assumed to be 9.9 miles with relative standard error of 25%
  • Average trip commute time is 20 minutes with a relative standard error of 25%
  • 500 respondents across 3 survey waves
Statistical Power for detecting a significant declining trend in average length of work trip in miles across the three survey waves

Relative Decrease of 4% - 60% Power
Relative Decrease of 6% - 91% Power
Relative Decrease of >10% - ~100% Power

Statistical Power for detecting a significant decline in average trip time in minutes across the three survey waves

Relative Decrease of 4% (50 seconds) - 68% Power
Relative Decrease of 6% (1.2 minutes) - 97% Power
Relative Decrease of >10% (>2 minutes) - ~100% Power
1.5 Days per week in alternative work option
  • VT and VMT reduction in the I-35W corridor in the peak hours
  • Cost to employee per trip saved by telecommuting
  • Repeated Measures logistic regression model
  • Percentage of commuters that have telecommuted prior to UPA expected to be 10%
  • 500 respondents across 3 survey waves
Statistical Power for detecting a significant increasing trend in the percentage of commuters telecommuting

Increase of 5% - 36% Power
Increase of 7.5% - 73% Power
Increase of >10% - 98% Power
1.6 Socio-demographic descriptors
  • Change in travel time and distance by user groups
  • Change in total transportation cost by user group
  • Repeated Measures Mixed Model (GLM)
  • Average commute distance prior to UPA assumed to be 9.9 miles with relative standard error of 25%
  • Average trip commute time is 20 minutes with a relative standard error of 25%
  • Assume comparison performed at 12 months (maximum difference)
  • Assume equal sample sizes and variances between groups
  • 250 respondents in each group
Statistical Power for detecting a difference between average travel distance (miles) of two groups at 12 months

Diff. of 0.5 Miles - 61% Power
Diff. of 1 Mile - 99% Power
Diff. of 2 Miles - ~100% Power

Statistical Power for detecting a difference between average travel duration (minutes) of two groups at 12 months

Diff. of 1 Minutes - 59% Power
Diff of 1.5 minutes - 91% Power
Diff of >2 minutes - ~100% Power

2.4 Schedule and Responsibilities

The schedule for the telecommuting surveys is dependent on employers and employees agreeing to participate in the telecommuting program. The recruitment of employers has been initiated and surveys of employees at one company have been undertaken. The recruitment of participating employers and employees will continue until March, 2010. The national evaluation team will monitor the status of participation in the telecommuting program and will work with researchers from the Humphrey Institute on various aspects of the evaluation.

The responsibilities for the surveys of employers and employees participating in the Minnesota UPA telecommuting program include:

  • The Humphrey Institute and its contractors will develop, conduct, and summarize the surveys of telecommuting employees and employers participating in the program. The Humphrey Institute will provide the Battelle team with the draft survey instruments for review and will provide the survey results in electronic format for participating employees using I-35W, as well as the survey results from employers in the I-35W corridor.
  • Members of the Battelle team will review the various survey instruments and provide comments back to Humphrey Institute personnel. Battelle team members will review and analyze the survey results, and incorporate the results into the various analyses in the interim and final evaluation reports.

2 State Demographics Profiles, U.S. Census, April 2003 OSD-03-104 "Reasons for Recent Large Increases in Commute Durations," University of Minnesota, Hubert H. Humphrey Institute of Public Affairs 301 19th Ave. S. Minneapolis, MN 55455 http://www.lrrb.org/PDF/200702.pdf

You may need the Adobe Acrobat Reader to view the PDFs on this page.