Ramp Metering Presentation
Printable Version [PDF 322KB]
You may need the Adobe® Reader® to view the PDFs on this page.
Contact Information: Neil Spiller at Neil.Spiller@dot.gov
Slide 1

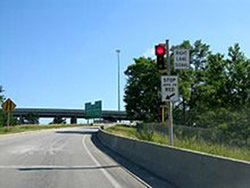
Ramp Metering
The application of control devices to regulate the number of vehicles entering or leaving the freeway, in order to achieve operational objectives.
Slide 2
Brief History
- 1963: First use — Chicago; Eisenhower Expressway — traffic officers would stand on ramp and release vehicles
- 1964 — 1967: Detroit and Los Angeles – (although no permanent meters were installed for a number of years thereafter)
- 1970: Minneapolis area – "fixed time, permanent" (including a bus bypass on some ramps to encourage transit use)
- 1972: Minneapolis area – the first "coordinated" meters were installed on multiple ramps on facilities
- 1980's and 90's: advancements towards "traffic responsive, dynamic" meters that would "self-regulate"
- 2000: Minnesota's public "push-back" against meters
- Circa 2006: CALTRANS District 7 advanced "System Wide Adaptive Ramp Metering (SWARM)" to control whole freeway corridors automatically
Slide 3
Types of Ramp Metering
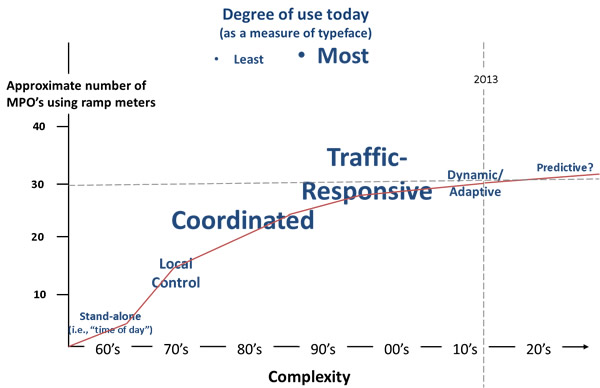
- Stand-alone (i.e., "time of day") 1960-70
- Often manually operated (switch on, switch off) or simple "traffic cop" management
- An isolated, pre-timed location. Not much capability to adjust to traffic demand.
- Problems: no way to clear congested queues; not responsive to upstream demand
- Local Control 1970-80
- Fixed segments of 'upstream+ramp+downstream' sections of highway using detectors to verify success
- Problems: not responsive to downstream bottlenecks that would back up

- Coordinated 1980-1990
- Improvements on local control; use of TMC's; greater sophistication
- First use of algorithms (beyond just "timing patterns")
- Responsive (i.e., "adaptive") 2000's
- At the most-congested MPO's; can understand multiple and dynamic bottlenecks.
- Uses real-time data in 30-sec or 5-min intervals to readjust the algorithms
- Predictive Future?
- In theory, would use upstream changes in traffic density to predict conditions and "forewarn" the meters how to operate
Slide 4
Where are R-Meters used today?
Representative (not all-inclusive) as of 2012
- Most Robust: (i.e., have the most installations, largest deployment)
- So. Cal; NY-NJ; Chicago; San Fran; Minn; GA; San Diego; Seattle
- Others: (i.e., mid-sized cities and/or moderate # of ramps)
- Miami; Phil-NJ; Houston; Phoenix; Portland;
- Small metro areas: (i.e., smaller regions or small # of ramps)
- Cincinnati; Kansas City; Las Vegas; Columbus, OH; Salt Lake City; Denver
- Entire U.S.:
- 28 of 101 Metropolitan Regions
- 12 of 15 "very large" . . generally 3M population or greater
- 11 of 32 "large". . generally 1M to 3M in size
- 3 of 33 "medium" sized . . generally 500K to 1M population (Baton Rouge, Allentown, Fresno)
- 2 of 21 "small" sized . . generally 150K to 500K population (Madison WI, Provo UT)
Slide 5
Evolution of Ramp Metering
Slide 6
Push Backs and Challenges
- Ramp meters were removed or deactivated after being installed in Dallas, San Antonio, and Austin, TX
- Other cities (e.g., St. Louis and Phil, et al) have removed some, kept others
- In 2000, MN legislature mandated a "recall" of use of RM's, resulting in a $650K study.
Slide 7
Push Backs and Challenges
- RM's do a poor job in inclement weather and during special events
- Queue back-ups force "clears" or overrides that effectively restart the algorithms
- Challenges exist in properly staffing, training, and implementing RM's
- Public acceptance is still an issue
- Agencies and peers have done a poor job of marketing the benefits and relatively high return on low investment
Slide 8
Minnesota Ramp Meter Study — 2001
Results of 2001 study of Ramp Metering Effectiveness
In September 2000, all 430 ramp meters were turned off in the Twin Cities region in response to a mandate from the MN State Legislature, following citizen complaints and questions raised by State Senator Dick Day; namely, do ramp meters work?
Objectives
- To fully explore effectiveness of ramp meters; meter "ait time" was also a key concern
- To respond to citizen's questions and identify public perception of ramp metering
- To involve a citizens advisory board to ensure credibility of the study
Process and Findings
Cambridge Systematics was hired by MnDOT to perform the 3-month study, inclusive of getting pre-study data and incorporating any/all citizen input and ensuring a transparent process. Five weeks of "before" speed and crash data, et al, was recorded. The ramps were shut off for a pre-determined "transition" period and then turned back on for five weeks of "after" data gathering.
- Without meters
- A 9% reduction in freeway volume; a 22 % increase in travel times; a 26% increase in crashes
(even after adjusting for prior seasonal rates)
- Most survey respondents believed traffic had worsened with meters off
- After the study: 20% wanted meters left off; 10% want them "returned"; 70% want modifications
Lessons Learned / Changes Implemented
- Neither "all" nor "nothing" was deemed best, but a new, modified approach was adopted:
- Fewer meters than before the study were turned back on (location candidacy was tightened and superfluous meters were removed)
- Hereafter, meters would wait no more than 4 minutes on local ramps or 2 minutes on freeway-to-freeway ramps
- Vehicles queued back to city streets will be "released" (meters temporarily shut off) and meter operation will better-respond to congestion-only times via improved use of detectors
Slide 9
Ramp Metering Benefits
| Location |
Safety |
Congestion Mitigation |
| Portland, Oregon |
43% Reduction in peak period collisions |
17% in average travel speed |
| Minneapolis, Minnesota |
24% reduction in peak period collisions |
16% in avg. travel speed; 25% increase in peak period volume |
| Seattle, Washington |
39% reduction in collision rate |
52% increase in avg. travel time; 74% increase in volume |
| Denver, Colorado |
50% reduction in rear-end and side swipe collisions |
A 57% increase in average peak period travel speed and a 37% decrease in average travel time. |
| Detroit, Michigan |
50% reduction in total collisions; 71% reductions in injuries |
An 8% increase in average travel speed and a 14% increase in traffic volume. |
| Long Island, New York |
15% reduction in collision rate |
A 9% increase in average travel speed |
Source: FHWA Ramp Management and Control Handbook, 2006
Slide 10
Recommendations for start-ups
- Agencies should start small (one or a few ramps)
- Conduct pre-analysis to
- ensure candidate locations and deployment exists
- gather "before" data to compare to "after"
- Instill public acceptance
- Become "ramp meter smart" via training and experience before expanding the system
- Make sure a strong deployment of detectors exists or will evolve