Minnesota DOT (Mn/DOT)
2007 Bottleneck Reduction Process
Printable Version [PDF 246KB]
You may need the Adobe® Reader® to view the PDF on this page.
Contact Information: Neil Spiller at Neil.Spiller@dot.gov
Background: How did the bottleneck identification and implementation process come about?
Minnesota DOT (Mn/DOT) was originally driven to explore low-cost congestion relief projects because of budgetary restrictions but soon realized that these projects could be implemented very quickly, and as a bonus, were highly visible and popular with the public. They also found that because of lower costs, they could identify multiple locations all over the region; the projects could be "spread around" in a fair and equitable manner.
The resulting process: The 2007 Congestion Management Planning Study
The cornerstone of this process is the Congestion Management Planning Study (CMPS). This process was initially developed as quick turnaround study so that projects could be recommended to the 2007 state legislature before it adjourned for the session. (The process was started in February and results achieved in May.) It was envisioned as a "tuning study"; i.e., how can the roadway system be "tuned" in specific areas to get congestion relief rather than rebuilt. Although cast as a single study, it is hoped that it can be integrated as an ongoing process within the Department. One unexpected benefit of the severely condensed process was that while there were briefings to various officials, there was not time to have officials delve into the minutia of each project. This saved the process from suffering "too many cooks" and actually streamlined the work effort.
The process works as follows:
- Step 1: Project Identification. Initially, over 180 projects were identified from a number of different sources including Mn/DOT project lists, Mn/DOT Area Managers, SRF Consulting Group, Inc., Mn/DOT Metro District's Safety Capacity, Mn/DOT's freeway congestion maps and the Governor's 2007 bonding list. By combining the information gathered from the sources, 184 projects were identified and included in this study as congestion management projects.
- Step 2: Screening #1. Using a consultant's help, a series of pass/fail binary tests were applied to the projects, resulting in downsizing the list to about 100 projects. The screening tests included:
- The project cost should be < $15 M
- The project should not already be in the 3-year TIP
- The project (scope) could require a Project Memo or lesser environmental documentation
- The annual hours of delay should exceed 25,000 hours of congestion
- If a Freeway or Arterial, a minimum of 2 hours of congestion should exist
- Ideally, if an arterial, it should relieve a parallel congested freeway or could be directly responsible for relieving freeway congestion
- Step 3: Screening #2. Qualitative criteria were applied, reducing to 60 projects still under consideration. The second set of screens were targeted at cost/benefit comparisons.
- Project implementation/design readiness
- Cost range
- Congestion benefit (weighted delay)
- Traffic management for construction
- Future demand changes
- Relieves congestion without adverse downstream affects
- Step 4: Expert Workshop. Short range congestion projects were prioritized by expert group during half-day workshop, resulting in 19 projects totaling $60.8M. The projects fell into 3 broad categories:
- Low-cost capacity improvements (e.g., auxiliary lanes)
- Restriping to change lane configuration (which the maintenance Department could handle)
- Traffic control device improvements (add ramp meters and "tune" signal timing)
- Step 5: Project Planning. For each of the 19 projects, the following project estimates were prepared:
- Geometric sketches
- Type and scope of project
- Congestion impacts
- Safety impacts
- Estimated benefit-to-cost ratio
A summary of the 19 projects, including the type of improvement is given in Table 1. (Note to reader: the table is intended to show the variety of solutions that can be employed.)
TABLE 1. Recommended CMPS Phase I Demonstration Projects
| Project ID |
Begin/End |
Project Description |
Estimated Cost |
| I-35E |
TH 77 to CR 11 |
Add southbound auxiliary lane. |
$4,000,000 |
| TH 77 |
138th to Diffley |
Add northbound auxiliary lane. |
$13,000,000 |
| I-35 |
I-35W/E merge area |
Extend northbound fourth lane to exit to TH 97. |
$5,000,000 |
| I-35W - A |
106th to TH 13 |
Add southbound auxiliary lane. |
$6,000,000 |
| I-35W - C |
I-694 |
Add northbound buffer lanes. |
$1,500,000 |
| I-494 - A |
TH 55 |
Lengthen northbound exit ramp turn lanes and triple left-turn lanes, add third lane eastbound to Fernbrook or Plymouth Boulevard. |
$2,500,000 |
| I-494 - B |
B1: France to I-35W |
Add eastbound auxiliary lane between southbound France loop and southbound I-35W. |
$4,000,000 |
| B2: I-35W to France |
Add westbound auxiliary lane between northbound I-35W loop and exit to France, option to extend lane through France. |
$4,000,000 |
| I-94 - A |
TH 101 |
Add half-mile westbound auxiliary lane and two-lane exit with ramp becoming three-lane mainline over South Diamond Lake intersection; complete signal revisions and realignment of northbound through from Rogers at north ramp. |
$4,000,000 |
| I-94 - D |
TH 61 to White Bear |
Add eastbound auxiliary lane. |
$3,000,000 |
| TH 10 - A |
A1: Egret to Hanson |
Add eastbound third lane. |
$6,000,000 |
| A2: Egret to Hanson |
Add westbound third lane. |
$6,000,000 |
| TH 100 |
I-694 |
Add a two-lane northbound on-ramp from TH 100 to eastbound I-694 and restripe. |
$500,000 |
| I-35W - B |
Washington |
Restripe southbound on Mississippi River bridge to have right lane end at Washington exit and second lane exit to collector-distributor road, through traffic on southbound I-35W to TH 55 stays in left two lanes. |
$500,000 |
| I-94 - B |
I-394 |
Convert westbound I-94 exit to I-394 from tunnel to 2-2 fork. |
$300,000 |
| I-94 - Ops 1 |
TH 101 to I-494 |
Install ramp meters at northbound TH 101 and 95th Avenue. |
$20,000 |
| I-94 - Ops 2 |
TH 61 to Radio Drive |
Install ramp meters at TH 61, White Bear Avenue, McKnight Avenue, and Radio Drive. |
$40,000 |
| TH 100 - Ops |
I-694 to I-394 |
Install ramp meters at TH 55, Duluth Street, 36th Avenue CR 81, and France Avenue. |
$120,000 |
| TH 13 - Ops |
Yankee Doodle to Prior Lake |
Corridor tuning for 25 signals in five zones. |
$97,500 |
| TH 7 - Ops |
East Ramp MN 100 MN 41 |
Corridor tuning for 24 signals in four zones. |
$94,000 |
| TH 65 - Ops |
I-694 to CSAH 24 (East Bethel) |
Corridor tuning for 25 signals in three zones plus wireless interconnect. |
$107,500 |
| Total |
 |
|
$60,779,000 |
Bottleneck Performance Measures
The State of Minnesota (not just the DOT) has been a leader in developing and using performance measures to assess how it is meeting customer expectations. In accordance with these principles, evaluation of completed projects is being done to track the effectiveness of current and future investments:
- Measurement of "before" and "after" project conditions to assess the project's effectiveness and build experience for the type of benefits those different projects can deliver.
- Annual system measures that can capture overall congestion trends for different systems over time (e.g., Texas Transportation Institute (TTI) congestion index, percentage of Metro Urban Freeway System (MUFS) congested).
- Measurement of strategies to shifts peak demands to off-peak periods (e.g., number of persons moved at the per lane capacity with speeds greater than 45 mph).
A preliminary list of performance measures being considered are as follows. Additional ones may be developed in the future and not all may apply to the bottleneck relief projects:
- Percentage of miles congested (i.e., number of directional miles with speeds < 45 MPH during peak periods)
- Total daily delay (volume x time difference between actual and posted speed)
- Reliability (TTI - Congestion Index/ Travel Time Buffer Index)
- Miles of FIRST/incident response coverage
- Number of hours where volume > capacity
- Frequency of signal retiming
- Percent of arterials with coordinated signals
- "Before"/"After" benefit-cost ratio of corridor improvements
- "Before"/"After" benefit-cost ratio of signal retiming
- Customer satisfaction survey of peak hour travel (omnibus transportation survey)
- Percent of MUFS instrumented
- Planned lane closures System
- Unplanned lane closures System
- Average clearance time for snow and ice removal
- Average clearance time for freeway incidents
- Throughput (i.e., number of vehicles through a specific corridor or across a screenline over a specified time period)
Overall, the CMSP process follows a mostly qualitative (but formalized) procedure to develop candidate projects. (Data are used in the screening but in a very high level way) This streamlining was necessary in order to keep to the aggressive schedule. At the end of the process (Step 5) more quantification comes into play.
Process Evaluation for Success
This process worked extremely well in the eyes of Mn/DOT - they feel that a more technically rigorous and drawn-out procedure would have essentially yielded the same project list. While many bottleneck problems are easily identified through visual inspection and via the freeway surveillance data, analysis is often necessary to confirm and justify the solution.
Another aspect of the streamlining (in addition to the qualitative project identification and screening process) is that some larger environmental aspects could not be addressed (e.g., area drainage). In order to keep the costs low and the projects quickly implementable, the environmental concerns will be only addressed through the NEPA process during the implementation of any larger "mega-projects" in the future.
Program Funding
No separate funding program was established for the CMPS projects - they have to compete for funding with other projects. If projects are seeking federal funding, then they have to go through the evaluation process established by the MPO, which has its own set of evaluation criteria.
Three exemplary projects yielding dramatic and significant results
Three low-cost bottleneck projects were highlighted by Mn/DOT and used as the models to develop the Congestion Management Planning Study. The positive impacts of these projects on congestion are dramatic (see Table 2 for details):
- Addition of an auxiliary lane. I-394 at Louisiana Street. Mn/DOT added an auxiliary lane 1 mile long at a cost of $2.6M. Previously, queues could back up for 6 miles on this section; after completion, queues were reduced to zero! (for recurring conditions).
- Simple completion of a missing, incongruent highway section. I-94 in St. Paul. A four-lane section of freeway connected to two six-lane sections (a lane-drop bottleneck). Mn/DOT increased the number of lanes to six throughout this extended segment at a cost of $10.5M. Queues were reduced by 0.5 miles in the westbound direction and 2.0 miles in the eastbound direction. The existence of major bottlenecks at the end of the segment (freeway-to-freeway interchanges) limited the effectiveness of this improvement.
- Modified two substandard interchanges. This project was chosen by one local newspaper as the "public improvement project of the year." TH-100 past St. Louis Park is another example of a 6-4-6 lane drop with a highly restricted cloverleaf interchange in the four-lane section. Short sections of shoulder were used in some areas to augment the creation of an additional through lane in each direction. A very close-by diamond interchange was connected by C-D roads, reducing access points from 7 to 4, and the cloverleaf was redesigned to a diamond interchange, all at a cost of $7.5M. Northbound queues were reduced from 5.25 miles to 0.25 miles and southbound queues were reduced from 6.0 miles to 0.25 miles.
The benefit/cost (B/C) ratios for these projects are very high - 8:1, 14:1, and 13:1, respectively. These ratios account for only the direct effect on the improved facility, not congestion relief on nearby facilities (which have benefited because of small traffic diversion).
TABLE 2. Cost and Travel Time Benefit of Completed Congestion Management Projectsa
Project Cost
(in millions) |
Reduction in Annual Hours of Delay |
Estimated Annual Travel Time Benefit
(in millions) |
Project Service Life
(in years) |
Estimated Travel Time Benefit over Project Service Life
(in millions) |
Estimated Travel Time Benefit to Cost Ratio |
| I‑394 |
$2.6 |
87,000 |
$1.1 |
20 |
$21.6 |
8 |
| I‑94 |
$10.5 |
139,000 |
$1.7 |
20 |
$34.6 |
3 |
| TH 100 |
$7.1 |
1,063,000 |
$13.2 |
7 |
$92.3 |
13 |
| Total |
$20.2 |
1,289,000 |
$16.0 |
- |
$148.5 |
- |
Another example of the effectiveness of low-cost improvements was a comparison of two improvements on parallel facilities (Figure 1):
- I-494 Design/Build project from Hwy 5 to Hwy 55 - Project Costs $138 million (leftmost project circled in Figure 1)
- Hwy 100 at Hwy 7 - Project Costs $7.1 million
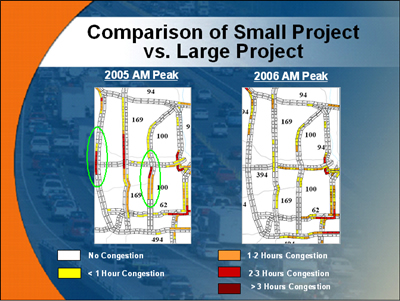
Figure 1. Comparison of small project versus large project.
Figure 1 shows that congestion relief was essentially the same for the "mega project" (the left-most project) and the low-cost improvement (the centered project) based on analysis of Mn/DOT's detector data. Granted, the mega project was closer to a facility rebuild, complete with sound walls, fully developed and researched plans, right-of-way issues, and such, but in the end, the project delivered approximately the same benefit (i.e., reduction in long-standing recurring congestion) as did the much lesser costing, shoulder-use project.