Safety Assessment Process: DFW Connector
slide 1: Work Zone Performance Management Peer Exchange Workshop
Texas A&M Transportation Institute
May 8, 2013
Atlanta, GA
slide notes:
Saving Lives, Time, and Resources
slide 2: Presentation Outline
- Project Description
- Methods
- Findings
slide notes:
None.
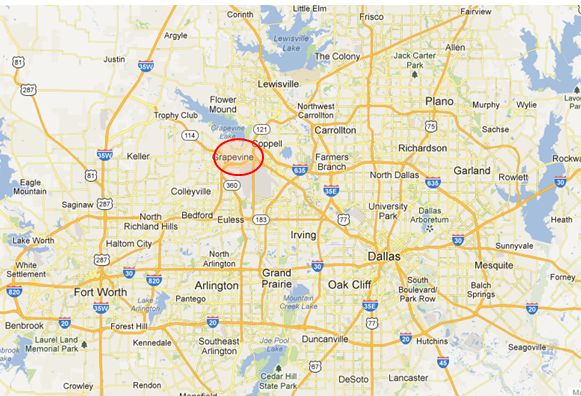
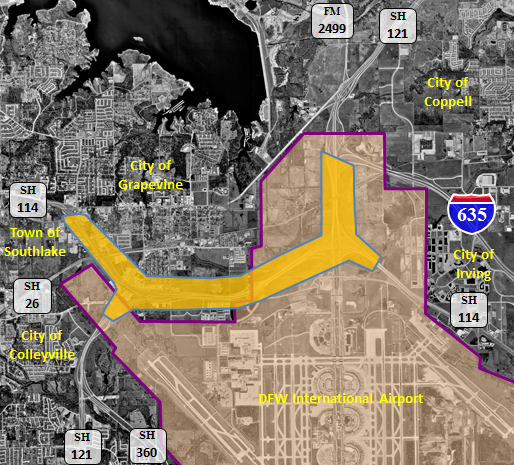
slide 3: Orientation
slide notes:
None.
slide 4: Project Description
- 8.4 miles
- Developer: NorthGate Constructors
- $1.02 billion design-build project
- Construction Start: Feb 17, 2010
- Estimated Completion: Summer 2013
slide notes:
None.
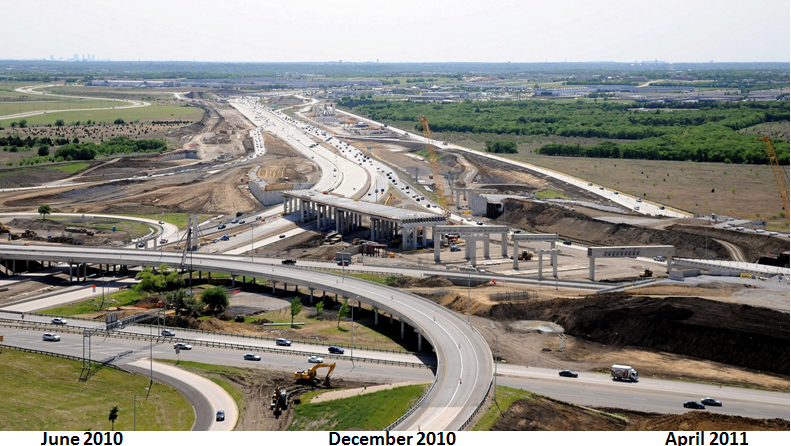
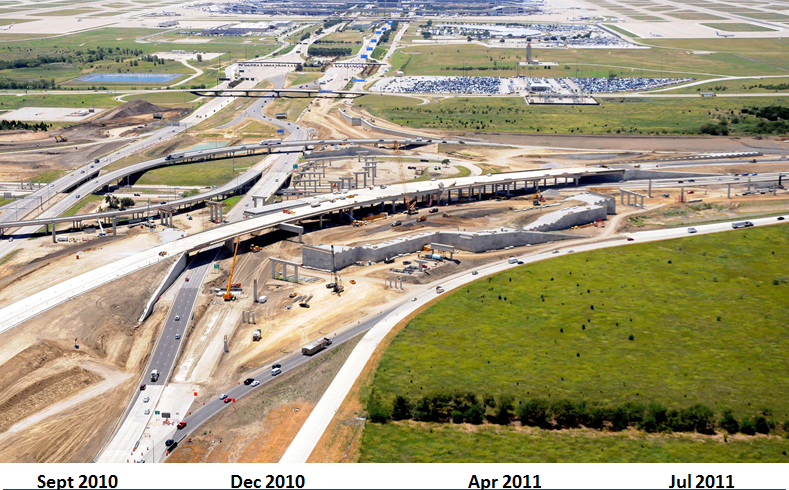
slide 5: Fast Moving, Design-Build Project
"It is a changing landscape. You can drive through there one day and it can change the next," NorthGate spokeswoman Selma Stockstill.
slide notes:
None.
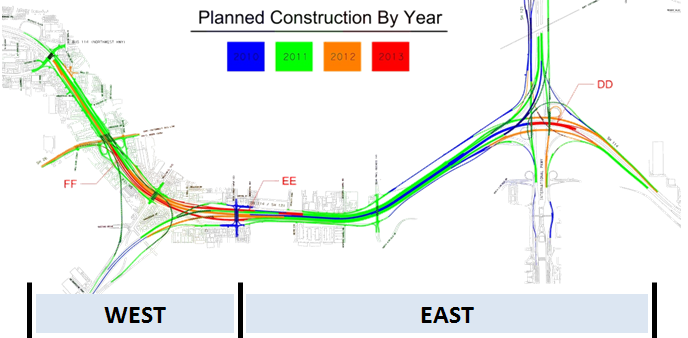
slide 6:
slide notes:
None.
slide 7:
slide notes:
None.
slide 8: DFW Connector
- Allowable Mainlane Lane Closures
- Weekdays 8 PM to 6 AM
- Weekends
- Incident Reporting
- Project TMC
- Courtesy Patrol
- Emergency Response
- Action-oriented Culture
slide notes:
None.
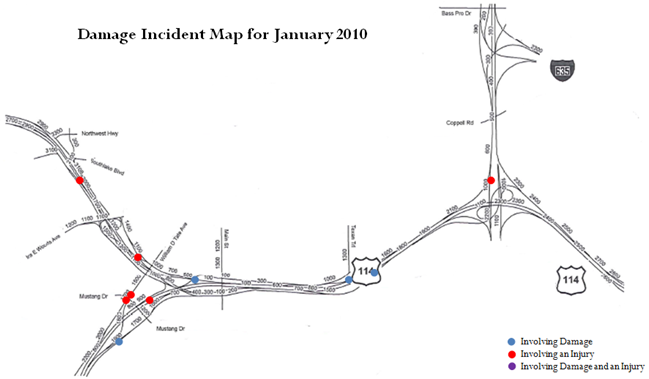
slide 9: Contractor Tracking – Jan 2010
slide notes:
None.
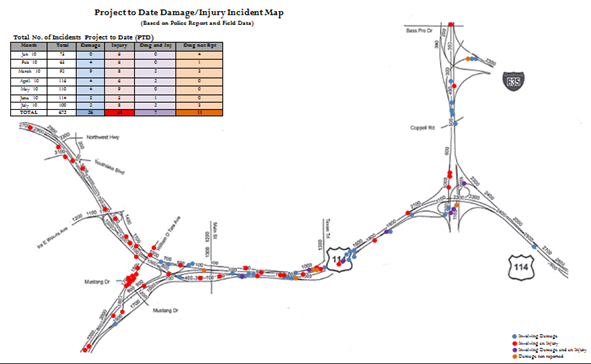
slide 10: Contractor Tracking – Jul 2010
slide notes:
None.
slide 11: Methods
- Data
- Historical Crash Records
- In-Construction Crash Records
- TxDOT Traffic Data
- Analysis
- Modified Ohio Procedures
- Injury and Property Damage Only (PDO)
- Expected vs. Observed Crashes
- Statistical Significance
- Field Reviews
slide notes:
None.
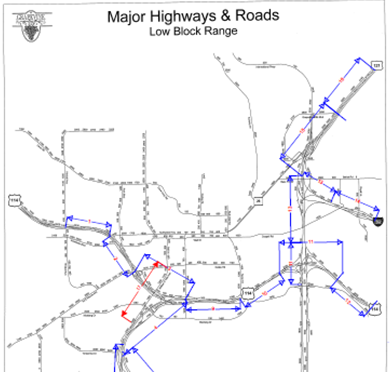
slide 12: Creation of Small Zones
slide notes:
None.
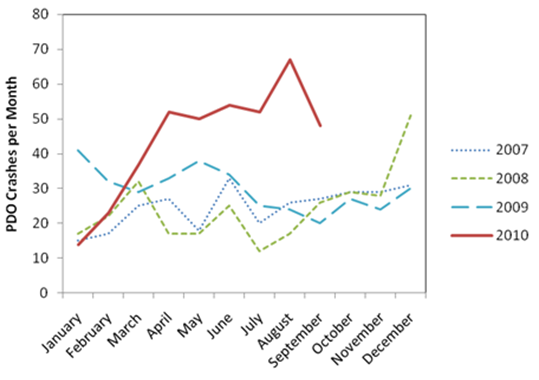
slide 13: Monthly PDO Crash Trends
slide notes:
None.
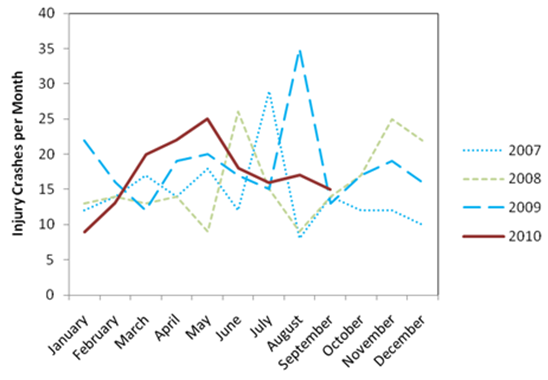
slide 14: Monthly Injury Crash Trends
slide notes:
None.
slide 15: Crash Frequency within Project Limits Q1 2011 from Baseline
| Time Period | Injury Crashes | PDO Crashes | Total |
|---|---|---|---|
| Weekdays | +32% | +174% | +121%* |
| Weeknights/Weekends | -27% | +61% | +31%* |
| Total | +16%** | +139%*** | +94%* |
* percent change is statistically significant at α =0.10 |
|||
slide notes:
None.
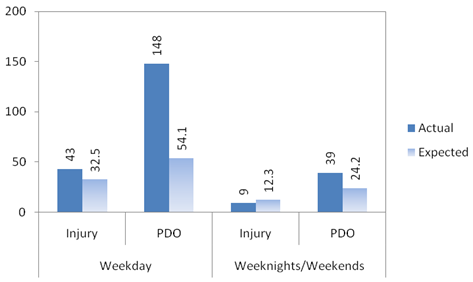
slide 16: Comparison of Actual and Expected Q1 2011 Project Limit Crashes by Time Period and Severity
slide notes:
None.
slide 17: Change in Crashes by Location in Project Q1 2011
| Time Period | West Segment | East Segment | ||
|---|---|---|---|---|
| Injury Crashes | PDO Crashes | Injury Crashes | PDO Crashes | |
| Weekdays | +9% | +99%* | +57%* | +260%* |
| Weeknights/Weekends | -24% | +9% | -30% | +121%* |
| Total | No change | +71%* | +33%* | +217%* |
* percent change is statistically significant at α =0.10 |
||||
slide notes:
None.
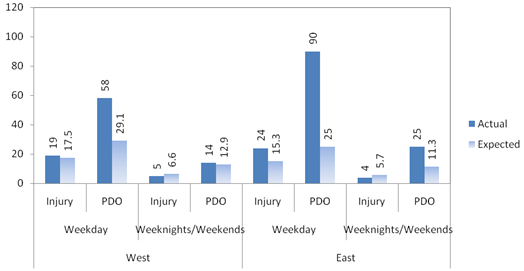
slide 18: Comparison of Actual and Expected Q1 2011 Project Limit Crashes by Location, Time Period, and Severity
slide notes:
None.
slide 19: Weekday, West Side Injury and PDO Crashes
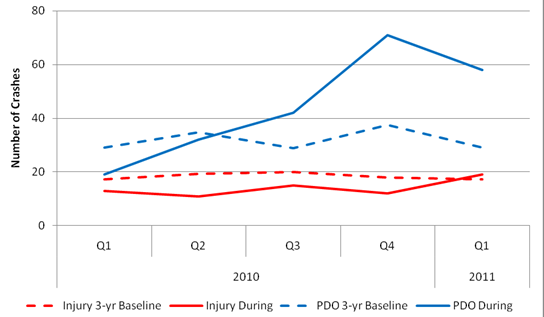
slide notes:
None.
slide 20: Weekday, East Side Injury and PDO Crashes
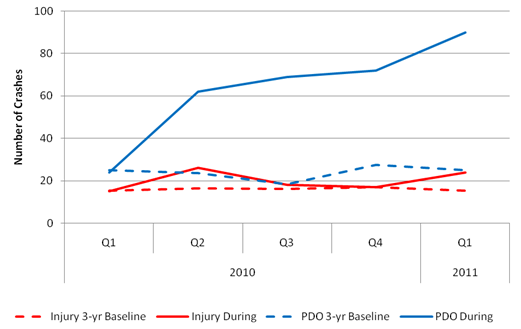
slide notes:
None.
slide 21: Weeknight/Weekend, West Side Injury and PDO Crashes
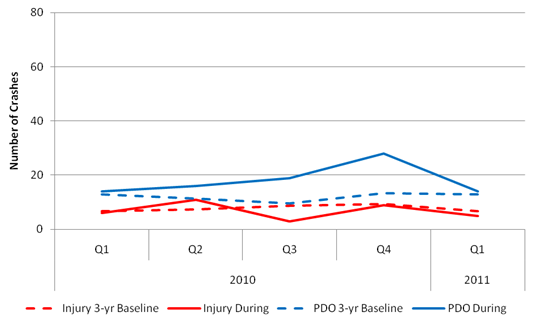
slide notes:
None.
slide 22: Weeknight/Weekend, East Side Injury and PDO Crashes
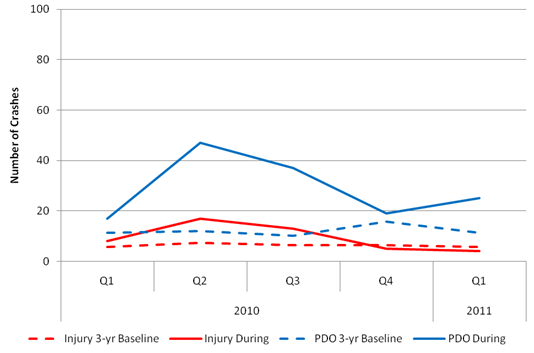
slide notes:
None.
slide 23: Weeknight/Weekend, West Side Rear-end (RE) and Side-swipe (SS) Crashes
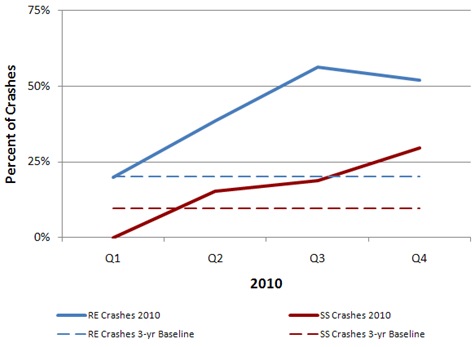
slide notes:
None.
slide 24: Weeknight/Weekend, East Side Rear-end (RE) and Side-swipe (SS) Crashes
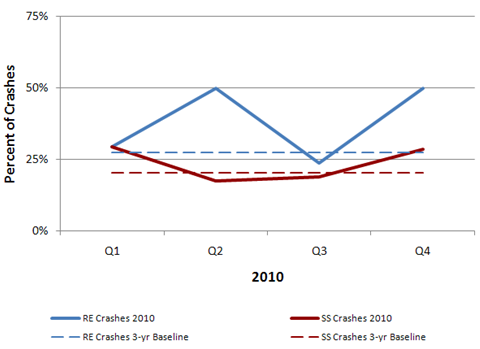
slide notes:
None.
slide 25: Comparison of 1st Quarter 2011 Crash Numbers between TxDOT CRIS and Grapevine PD Hard-Copy Reports
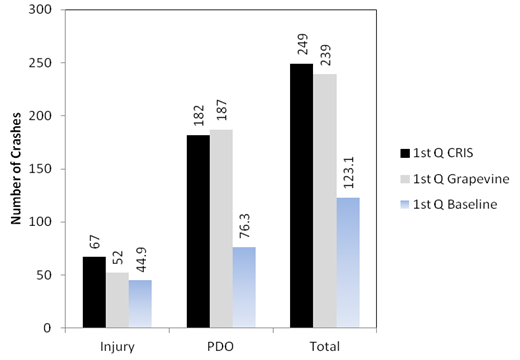
slide notes:
None.
slide 26: Field Review
- Observe conditions to understand nature of crashes
- Example observations
- Pavement marking visibility under high sun reflectivity
- Directional lighting
- Lane shifts in/near ends of horizontal curves and ramp merges
- Guide sign placement within 10° cone of vision
slide notes:
None.
slide 27: Future Directions
- Continuing analysis…next steps
- Associated with active lane closures
- Associated with detour routes
- Comparison of CRIS to In-construction Reports
- Working to meet FHWA's Toward Zero Deaths: Make work zones safer for workers and public
slide notes:
None.
slide 28: Contact Information
Jason A. Crawford, P.E.
Texas Transportation Institute
(817) 462-0534
jcrawford@tamu.edu
Jerry Ullman, P.E., Ph. D.
Stephen Ranft
Scott Cooner, P.E.
slide notes:
None.
Return to List of Presentations