Analysis of Travel Choices and Scenarios for Sharing Rides
| |||||||||||||||||||||||||||||||||||||||||||||||||||||||||||||||||||||||||||||||||||||||||||||||||||||||||||||||||||||||||||||||||||||||||||||||||||||||||||||||||||||||||||||||||||||||||||||||||||||||||||||||||||||||||||||||||||||||||||||||||||||||||||||||||||||||||||||||||||||
| Market | Number of Users | Percent |
|---|---|---|
| Tucson | 380 | 30% |
| El Paso | 566 | 45% |
| Austin | 314 | 25% |
| Total | 1,260 | 100% |
Out of the 1,260 users, 644 had a completeness rate of all the survey questions of greater than 40 percent. Metropia™ imputed missing data, where possible, in conducting analysis for this study.8 The basic concept behind imputing data is that the number of users participating in the survey and the number of questions administered in the survey form a matrix that is generally sparse (i.e., not all users respond to all questions). The Multivariate Imputation by Chained Equations (MICE) process9 was utilized by Metropia™ in this study to complete the sparse matrix, and the micro-survey data were used as explanatory variables. After Metropia™ completed the imputation process, data pertaining to the travel behavior (mobility option and reward points), trip characteristics (travel time and distance), and day of the week (weekday versus weekend) were attached by Metropia™ to its 644 users, resulting in a dataset of 16,897 observations (9,224 for weekday and 7,673 for weekend) based on an average of 14.3 and 11.9 months of activity for each user on weekday and weekend, respectively.
Based on the mobility option selected, Metropia™ mapped each user to one of the following four roles for each trip and computed the proportion of each role for over an observation period:
Metropia's™ data support both cross-sectional and longitudinal analysis and thus a three-tiered framework was developed, as illustrated in figure 9.
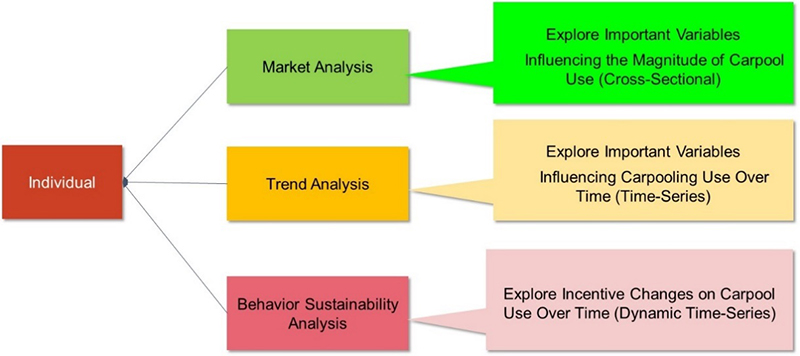
Figure 9. Diagram. Tiered analysis framework.
(Source: Metropia™)
Metropia's™ dataset allowed a breakdown of results by a host of demographic and trip characteristics. As the focus of the analysis here is on the broader impacts of the type of strategy that Metropia™ deployed, some detail available from Metropia™ was less relevant to the findings focused on in this document.10 One area of interest, though, was whether those with growing usage over time were demographically different and/or exhibited other behaviors different from those showing declining participation. This was of interest as those with growing usage are more likely going to be long-term participants in app-based carpooling than those with declining usage.
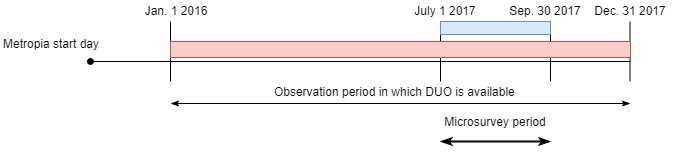
For the period between January 2016 and December 2017, over 85 percent of the users had used Metropia's™ platform in the last 6 to 15 months. The time-series data associated with the trend analysis reflected monthly carpool utilization for those users who had used the platform for at least 6 months. Carpool use in the Metropia™ app varies by time of day (peak versus non-peak), day of the week (weekday versus weekend), activity type, and user socio-demographic characteristics. Furthermore, segmenting by commute purpose (i.e., travel primarily associated with work or school); the user's familiarity with a specific market; age; education level; and years of driving appeared to have significant explanatory value in attempting to understand the differences (behavior) in carpool-passenger and drive-alone modes.
Metropia™ stated that its primary goal was to create and deploy a behavioral engine that establishes and maintains a new mobility habit for users, while being financially sustainable for partnering agencies. Table 12 summarizes the distribution of the selected users by three markets.
| Market | Number of Users | Percent |
|---|---|---|
| Tucson | 206 | 45% |
| El Paso | 134 | 30% |
| Austin | 113 | 25% |
| Total | 453 | 100% |
For these markets, Metropia™ divided carpool users into groups that exhibited an increasing trend, decreasing trend, or no trend in utilization, based on the Mann-Kendall test.11,12 The Mann-Kendall trend test is a non-parametric test to detect significant trends in time series and requires that trend to be monotonic, meaning that for an increasing trend observation, observation y needs to be higher than observation y – 1. Based on the Mann-Kendall test of the 453 users, 308 users or 68 percent had no trend, 93 users or 21 percent had an increasing trend, and 52 users or 11 percent had a decreasing trend. Of the 145 users who had a trend, 24 percent were from Austin, 44 percent from Tucson, and 32 percent from El Paso. Figure 10 illustrates the temporal carpool use for these users, providing the following observations:
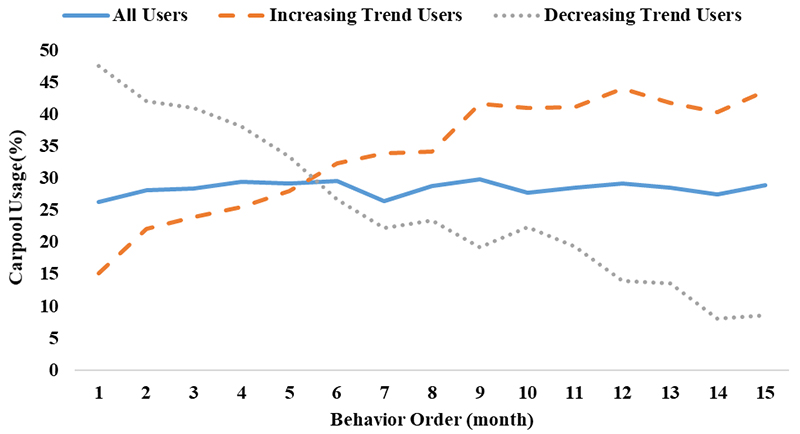
Figure 10. Graph. Temporal carpool use.
(Source: Metropia™)
Metropia™ undertook a time-series analysis to better understand how incentive changes over time affect the carpool use trend (i.e., can carpool behavior be sustained if incentives are reduced over time?). This is an important aspect of the overall policy framework, since it is directly related to the ability of the public agency to support a desired change in travel behavior in a cost-effective manner. It is also tied to the underlying principle of using incentives as a mechanism to break an old habit and support a new habit that can be maintained over time with an affordable cost structure.
Figure 11 illustrates how DUO reward points changed over time for both carpool drivers and passengers, indicating that reward points were reduced about 14.5 percent for drivers and 3.3 percent for passengers during the analysis period for this study. User carpooling levels tended to stay the same or increase, rather than decrease, despite declining rewards, suggesting that Metropia™ has created an award structure that is associated with users sustaining desired behaviors.
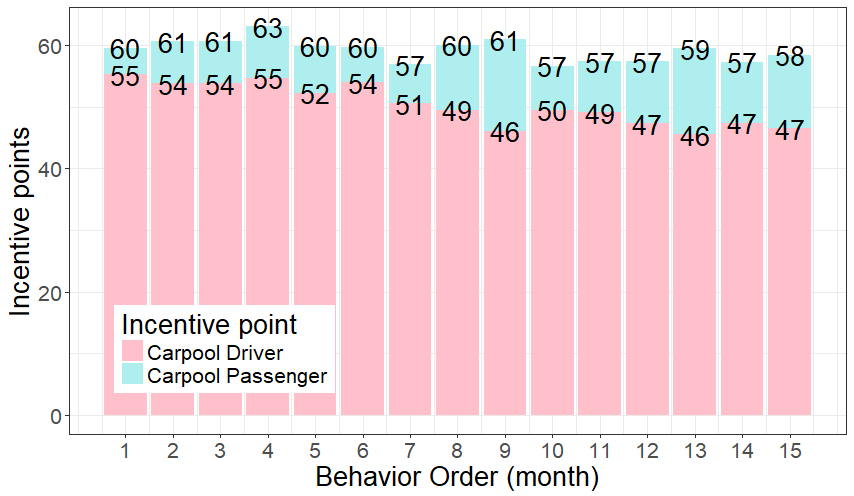
Figure 11. Graph. Carpool driver and passenger incentive point trend.
(Source: Metropia™)
Hytch™ provided a range of examples about partner reward structures. Since such partnership arrangements provide the financing that may lead to behavior change, understanding these arrangements and the motivations of partners to enter into them offers insights on the potential to expand app adoption and usage. First, the City of South Bend, Indiana, is using Hytch™ to pay 50 cents per mile to the general community to take qualified people to specific work locations by carpool. Second, an anonymous Fortune 100 partner company is deploying Hytch™ to pay for sharing rides by carpool or vanpool to or from a specific pilot site in San Diego. Third, the City of Spring Hill, Tennessee, contracted to deploy Hytch's™ "corridor rule" to reward citizens when they take longer, but less congested routes within a targeted corridor. Finally, the teledentistry company SmileDirectClub™ contracted with Hytch™ to pay employees and their co-travelers when they carpool to and from specific parking locations with limited parking supply. Their rewards also apply to employees using public transit and other modes.
One feature of Hytch Rewards™ is that the company has arranged to offset carbon emissions from all recorded trips even when monetary rewards to users are not provided. Hytch™ records carpooling trips but does not match carpoolers. Instead, carpools are arranged by individuals, reward partner organizations, or another firm that provides such matching.
In 2018 and 2019, Hytch™ provided rewards to 10,889 individual users, for their over 12 million miles of travel rewarded. During this period, the total average user reward was $23.62, amounting to about 2 cents per rewarded mile.
Over time, Hytch™ reward levels have tended to decrease gradually, largely since reward partners typically seek to find the most cost-effective means to achieve their goals. As can be seen in figure 12, reductions in the number of rewarded miles (which would be contrary to the goals of the reward partners) were not seen until per-mile reward amounts declined to below 2 cents.
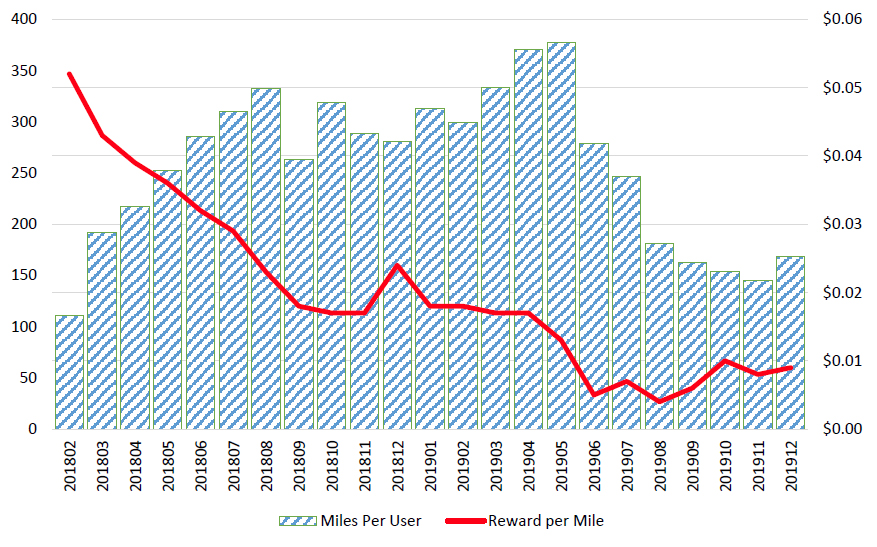
Figure 12. Diagram. Total miles per user per month compared to average rewards per mile.
(Source: Middle Tennessee State University Data Science Institute)
According to Hytch™, it is concerned about attrition of app users and interested in finding the lowest cost rewards that sustain desired behavior. Minimizing attrition is important to realizing long-term benefits of applications. Normal attrition rates have hovered at or below 1 percent per month. An attrition rate of 1 percent per month means that half of the participants would have dropped out in 50 months, or that the average participant is, under normal conditions, expected to stay in the system for about four years. But when user rewards have, in some instances, been eliminated entirely for many trips (excluding carbon emission offsets, which have continued), participation drop off is substantial. As can be seen in table 13, and also in figure 13 use fell immediately following a large reduction in reward levels in June 2019. The share of users taking their last trip using the app grew each month after the reduction in rewards, reaching 4.4 percent in November 2019. A high positive correlation of 0.73 was found with the elimination of rewards and permanent disengagement from the app. (This finding was made through Middle Tennessee State University Data Science Institute running a correlation matrix, which indicates the mutual strength of the relationship between two variables, from -1 to +1, known as the coefficient of correlation.)
| Year Month | Total Trips | No Reward Trip Count | No Reward Percent | Last Trip Count | Last Trip Percent |
|---|---|---|---|---|---|
| 2019 Jan | 41,795 | 5,369 | 12.8% | 348 | 0.8% |
| 2019 Feb | 38,253 | 4,258 | 11.1% | 248 | 0.6% |
| 2019 Mar | 44,212 | 6,045 | 13.7% | 444 | 1.0% |
| 2019 Apr | 41,067 | 4,135 | 10.1% | 398 | 1.0% |
| 2019 May | 38,347 | 8,538 | 22.3% | 408 | 1.1% |
| 2019 Jun | 21,898 | 13,259 | 60.5% | 426 | 1.9% |
| 2019 Jul | 14,533 | 6,991 | 48.1% | 313 | 2.2% |
| 2019 Aug | 10,997 | 7,842 | 71.3% | 377 | 3.4% |
| 2019 Sep | 7,940 | 3,825 | 48.2% | 288 | 3.6% |
| 2019 Oct | 6,382 | 2,763 | 43.3% | 234 | 3.7% |
| 2019 Nov | 6,084 | 2,987 | 49.1% | 269 | 4.4% |
| 2019 Dec | 4,713 | 2,453 | 52.0% | 186 | 3.9% |
| TOTAL | 276,221 | 68,465 | 24.8% | 3939 | 1.4% |
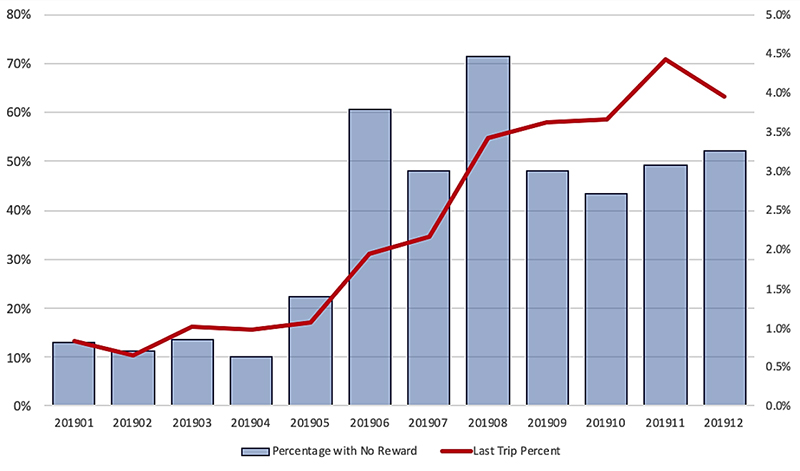
Figure 13. Percentage of trips with no rewards and last trips per month.
(Source: Middle Tennessee State University Data Science Institute)
Responses to varying reward amounts may be considered a "natural experiment," where the differing conditions faced by participants were due to factors outside of the control of the platform company. Random assignment would be preferable for this research need, since markets, programs, and reward amounts in this natural experiment could vary somewhat, but random assignment would require sufficient planning and budgeting. Despite this note of caution, changes in behavior from the natural experiment, especially within group behavior changes when reward levels have been varied, may be the result of the changes in reward amounts rather than other factors. When examining "within user" data, or changing behavior of individual users over time, the lack of random assignment becomes less of a concern since users are not being compared to others. While, in theory, it is possible that different users might respond differently to changing reward levels, there is no inherent reason that users found to be in one of these three categories (increasing, stable, and decreasing reward levels) would respond differently to changing incentives than would users ending up in other categories.
Data from Hytch™ allows researchers to find correlations between per-mile reward values and user miles that are rewarded. Table 14 is quite instructive in this regard and shows that a reward level of 2 cents per mile appears to yield indistinguishable results in monthly Trips per User from higher reward levels, but substantially better results than for lower reward levels. Monthly average awards of $7.54 for participants receiving 2 cents per mile, as shown below, appear to be a very affordable cost as compared to other transportation investment options (which are not explored as part of this research).
| Reward Per Mile14 | User Percentage15 | Distance Per Trip16 | Total Trips Per User17 | Distance Per User18 | Ave. Reward Per User19 |
|---|---|---|---|---|---|
| $0.00 | 19.6% | 24.08 | 7.86 | 189.32 | $0.41 |
| $0.01 | 25.0% | 20.38 | 15.19 | 309.43 | $3.30 |
| $0.02 | 22.3% | 15.51 | 24.75 | 383.85 | $7.54 |
| $0.03 | 13.6% | 13.81 | 23.57 | 325.39 | $9.52 |
| $0.04 | 7.8% | 13.03 | 23.49 | 305.99 | $12.00 |
| $0.05 | 4.1% | 11.57 | 23.50 | 271.85 | $13.59 |
| $0.06 | 4.4% | 9.75 | 18.31 | 178.59 | $10.61 |
| $0.07 | 1.8% | 8.51 | 15.55 | 132.38 | $9.15 |
| $0.08 or more | 1.3% | 9.80 | 10.57 | 103.60 | $10.93 |
Table 14 shows that higher average per-mile reward levels correspond to average trip lengths that are shorter than with lower reward levels. Hytch™ explained that some reward sponsors cap reward amounts on a per-trip basis, suggesting that those receiving the highest per-mile rewards were taking shorter trips, where no cap is imposed. Where such a cap exists, the expected manifestation of behavior change resulting from a higher per-mile reward structure would be more trips taken by those inclined to take shorter trips, as such trips would be handsomely rewarded. The data here do not show that result.
Another area of inquiry with the Hytch Rewards™ data requested by FHWA was for Hytch™ to report on individual distance per user and trips per user with rewarded miles where reward levels have, over time, declined noticeably, stayed the same, and increased noticeably. Such an inquiry may help formulate the most cost-effective strategies for allocating reward funds and could answer the following FHWA questions:
To begin to answer FHWA's questions, Hytch™ reviewed its data and shared a number of products the company generated from its data. The data and related products showed expected seasonal effects (e.g., travel picks up after the winter months). The reduction in reward miles when per-mile rewards dipped below 2 cents was also very apparent. Overall, though, clear patterns were difficult to discern. Future controlled experiments may be able to answer these questions.
Hytch's™ existing data could help guide such controlled experiments. To answer the third question above (i.e., "For users where reward levels rise, do distance per user and trips per user rise in a corresponding fashion?"), Hytch™ has only a very small number of users to whom this condition applied. Nonetheless, the data, shown in the table below, suggest that there might be something worthy of further exploration.
For this sample, table 15 shows that increasing reward levels appear to correlate with increased average miles per user. This is particularly apparent beginning in week 12 of 2019, or two weeks after average reward per mile jumped (and continued edging up in subsequent weeks). The rewards increased in weeks where seasonal driving might have increased, which might account for a bit of the shift, but results from this small sample were far higher than would likely be due to seasonality. Nevertheless, caution in interpreting the data is advised. The number of week-over-week users varied, sometimes substantially. After some time, reward miles declined despite per-mile reward levels remaining high, so it is an open question as to whether behavior changes are sustained. These data suggest that providing increasing reward levels to a greater number of participants (randomly assigned) in a future study could make for a worthy test even though, as noted earlier, higher per-mile reward levels were not correlated with higher numbers of reward trips across the entire study population.
| Year-Week | Week Start Date | Total Active Users | Average Reward/Mile | Average Miles Per User | Ave. Miles Change Per User % |
|---|---|---|---|---|---|
| 2019-06 | 2/3/19 | 9 | 0.031 | 98.44 | -50% |
| 2019-07 | 2/10/19 | 7 | 0.029 | 140.76 | 48% |
| 2019-08 | 2/17/19 | 10 | 0.030 | 126.94 | 18% |
| 2019-09 | 2/24/19 | 8 | 0.031 | 149.79 | 14% |
| 2019-10 | 3/3/19 | 9 | 0.054 | 136.71 | -36% |
| 2019-11 | 3/10/19 | 11 | 0.059 | 134.28 | -3% |
| 2019-12 | 3/17/19 | 11 | 0.067 | 209.34 | 214% |
| 2019-13 | 3/24/19 | 12 | 0.070 | 172.75 | -6% |
| 2019-14 | 3/31/19 | 11 | 0.077 | 154.07 | -20% |
| 2019-15 | 4/7/19 | 8 | 0.077 | 250.57 | -16% |
| 2019-16 | 4/14/19 | 12 | 0.076 | 222.64 | 40% |
| 2019-17 | 4/21/19 | 14 | 0.072 | 187.18 | -2% |
| 2019-18 | 4/28/19 | 10 | 0.074 | 161.53 | -26% |
| 2019-19 | 5/5/19 | 12 | 0.087 | 162.23 | 40% |
| 2019-20 | 5/12/19 | 12 | 0.084 | 137.95 | -11% |
| 2019-21 | 5/19/19 | 8 | 0.087 | 139.47 | -39% |
1 Direct correspondence between Allen Greenberg (FHWA) and Corinne Dutra-Roberts and Peter Engel (Contra Costa Transportation Authority) regarding Carpool Ridematch Platform Pilot. February 9, 2019. [ Return to Note 1 ]
2 Shen, Q., Wang, Y., and Gifford, C. (2020). "Building Partnership Between Transit Agency and Shared Mobility Company: Incentivizing App-Based Carpooling in the Seattle Region." [ Return to Note 2 ]
3 Kurth, S.B. and Hood, T.C. (1977). "Car-pooling Programs: Solution to a Problem?" [ Return to Note 3 ]
4 Gardner, B. and Abraham, C. (2007) "What Drives Car Use? A Grounded Theory Analysis of Commuters' Reasons for Driving." [ Return to Note 4 ]
5 Levin, I.P. (1982). "Measuring Tradeoffs in Carpool Driving Arrangement Preference." [ Return to Note 5 ]
6 Correia, G. and Viegas, J.M. (2011). "Carpooling and Carpool Clubs: Clarifying Concepts and Assessing Value Enhancement Possibilities Through a Stated Preference Web Survey in Lisbon, Portugal." [ Return to Note 6 ]
7 Since the study, DUO has been updated and additional information on the current DUO 2.0 version can be found at www.metropia.com. [ Return to Note 7 ]
8 Based on Metropia's™ experience and preliminary data analysis, the imputation process for users with lower than 40 percent completeness rate would not have provided enough variables for imputation. [ Return to Note 8 ]
9 Zellner, A. (1962). "An Efficient Method of Estimating Seemingly Unrelated Regressions and Tests for Aggregation Bias." [ Return to Note 9 ]
10 For broader analysis, see Papayannoulis, V., Arian, A., Chiu, Y.C., and Hsieh, C.W. (2020). "Social Carpool Behavior Analysis: Using Data from Incentive-Based Demand Management Platform." [ Return to Note 10 ]
11 Mann, H.B. (1945). "Nonparametric Tests Against Trend." [ Return to Note 11 ]
12 Kendall, M.G. (1975). Rank Correlation Methods (4th Edition). [ Return to Note 12 ]
13 FHWA requested that Hytch™ analyze data it had already gathered prior to this study in response to questions developed by FHWA for this study. Related findings are described here as an example of the kinds of analysis that may be possible from data from travel incentive apps. [ Return to Note 13 ]
14 Reward Per Mile – The average reward per mile for a user in a month (for example, if User ID 334 averaged $0.04 rewards per mile in a given month, they would be counted in the $0.04 category, which had 7.8% of the months. If the next month, they average $0.05, they would be counted in the $0.05 category. [ Return to Note 14 ]
15 User Percentage – Percentage of user months that averaged a particular Reward Per Mile category. [ Return to Note 15 ]
16 Distance Per Trip – The average miles per trip in a particular Reward Per Mile category. [ Return to Note 16 ]
17 Total Trips Per User – The total number of trips per user in a particular Reward Per Mile category [ Return to Note 17 ]
18 Distance Per User – The average miles per user in a particular Reward Per Mile category. [ Return to Note 18 ]
19 Average Reward Per User - The average rewards per user in a particular Reward Per Mile category. [ Return to Note 19 ]
|
United States Department of Transportation - Federal Highway Administration |
||