Weather-Responsive Management Strategies (WRMS) for Flood Management in Iowa, Missouri, and NebraskaPrintable version [PDF 2.2 MB]
U.S. Department of Transportation FHWA-HOP-20-050 WEATHER-RESPONSIVE MANAGEMENT STRATEGIES CASE STUDY BackgroundThe Weather-Responsive Management Strategies (WRMS) initiative under the Federal Highway Administration (FHWA) Every Day Counts—Round 5 (EDC-5) program promotes the use of road weather data from mobile and connected vehicle (CV) technologies to support traffic and maintenance management strategies during inclement weather. The goal is to improve safety and reliability, as well as reduce environmental impacts on the transportation system resulting from adverse weather. WRMS can mitigate the impact of flooding events through preparation and prediction efforts that leverage and build data, tools, and relationships. As a result, agencies are better equipped for response and recovery efforts. While experience with major flood events increases Department of Transportation (DOT) staff understanding of how to assess and respond to flood risks, flood-related WRMS enable DOT staff to better understand the consequences of specific stream gauge readings, what the impacts will be and where, who to talk to, what resources are available, and new tools and next steps required to advance practices. This case study highlights the experiences and lessons learned from the Iowa, Missouri, and Nebraska DOTs while managing major flood events in the Missouri River Basin. The DOTs utilized similar strategies but different tactics given the various agency relationships and resources available for flood management. Missouri River Basin Major Flooding EventsThe Missouri River Basin, shown in Figure 1, typically experiences some annual flooding in the spring as a result of snowmelt from upstream areas and increased rainfall. Levees, dams, and other infrastructure are in place to help control the floods and minimize the impacts of this annual cycle. Significant flood events on the Missouri River in 2011 and 2019 caused major prolonged impacts and road closures, resulting in recovery and reconstruction efforts lasting for many months. 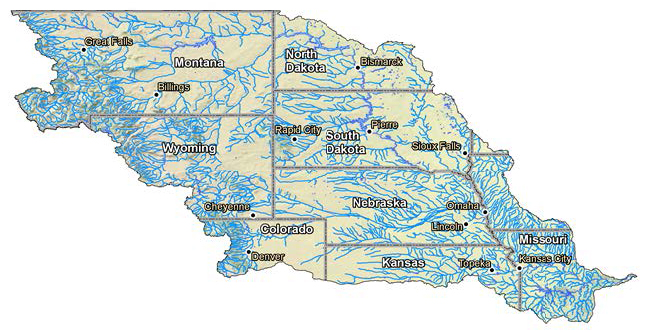
Figure 1. The Missouri River Basin is in the north central United States The 2011 flood caused over two billion dollars in damages and five fatalities in the United States. Flooding followed wetter than normal fall soils, record winter snowfall, and then record-setting spring precipitation. Numerous levees were breached along the Missouri River, flooding thousands of acres of farmland and damaging transportation infrastructure. During the event, there was flash flooding along uncontrolled tributaries and extensive mainstem river flooding, which continued for months in some locations. Extreme river levels caused hydraulic conditions, which Missouri DOT had not previously observed.1 The 2019 flood was caused by a confluence of events. An intense storm with heavy rains and warm air in March rapidly melted much of the thick snowpack and ice that had accumulated over the winter, producing significant runoff in a short period. Large chunks of river ice, which ran against dams, levees, and other infrastructure, packed together to jam waterways, and contributed to the failure of Spencer Dam in Nebraska. Several streams and rivers reached all-time record levels in Nebraska, Iowa, and South Dakota.2 Data and Tools for Prediction and PreparationDOTs rely on a variety of data and tools to predict and prepare for a significant flood event. Experience helps staff understand the spatial relations between the height of a roadway and how it will be impacted by a certain water level, in conjunction with models that examine inundation at various river levels. However, when levees are destroyed or events are exceptional, this historic experience becomes less relevant, and staff needs to rely on available data and models to understand the resulting rise and fall of the flood water levels. Below are examples of data and tools used by DOTs:
Intra- and Inter-Agency PartnershipsDuring a major flood event, State DOT personnel must coordinate and work with staff from a variety of agencies, departments, and other partners that typically conduct separate day-to-day activities. For example, Missouri DOT has participated in tabletop exercises for a variety of scenarios other than weather with the American Red Cross, hospitals, NWS, emergency managers, and other partners to help develop these relationships. Experience with previous emergency events provides a basis for understanding points of contact for assistance as different questions and issues arise. During a flood event, agencies may work with the entities listed below:
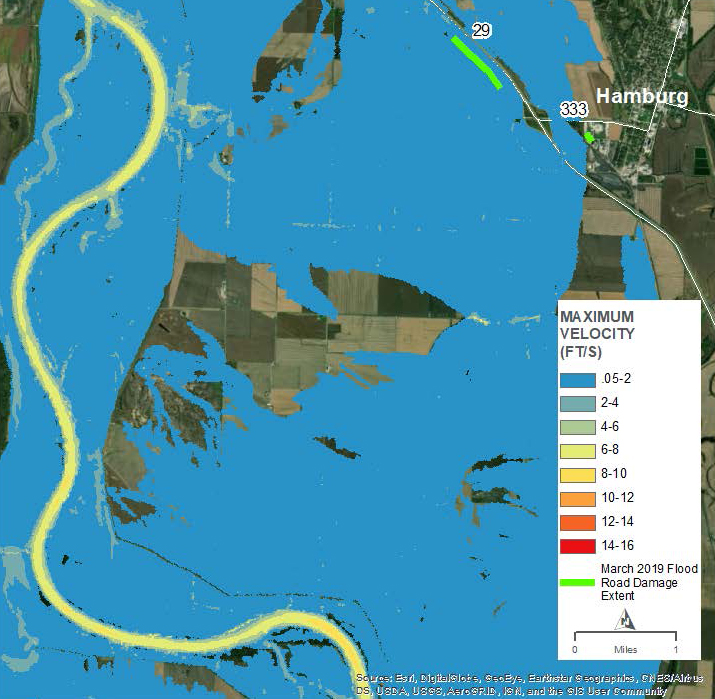
The State DOT may contact a variety of other agencies to support flood preparation and recovery efforts, depending on the resources required in specific locations. For example, Iowa DOT noted that the Department of Corrections was engaged in advance of a flood event to provide labor to fill sandbags. The National Guard helped supply aid to a Nebraska community that could not be accessed by road due to flood waters. The 2019 flood also prompted Nebraska DOT to engage the Game and Parks Department to use airboats and officer operators to inspect flood damage. The State DOT may also engage county agencies, the Department of Agriculture, and the U.S. Geological Survey to support flood-related efforts. Response and RecoveryA key lesson learned for agencies experiencing a major flood event is that the State DOT often serves as a major resource to other people, cities, and agencies for emergency operations—devoting State DOT staff and equipment to provide support on top of standard duties to care for roadways. As a result, State DOT maintenance groups tend to be extremely short-staffed during floods, because they are helping others as approved by emergency operations, even as staff are shifted internally to support the impacted area. Additionally, State DOT office staff help to organize emergency efforts from different offices and District areas. Further, State DOT maintenance garages are often used as emergency distribution hubs to provide sandbags, supply water, or collect garbage. The Iowa, Missouri, and Nebraska DOTs all emphasized the importance of knowledge, experience, and relationships when responding to major flood events. Experience gives a basis for understanding past successes and failures, and the various tactics used in a situation. As such, the bigger struggle is what to plan for, based on the prediction of what to actually expect. Bridge Re-opening Challenges after Major FloodingIn the seven months after the March 2019 flood, the U.S.-59 Amelia Earhart Bridge across the Missouri River was fully closed on three separate occasions for multiple weeks at a time. This was necessary because of subsequent flooding resulting from impacted, vulnerable infrastructure and dams releasing water. This bridge also serves as a major route for commuters from Missouri into Atchison, Kansas. The shortest alternate route adds over 30 miles in one direction. Missouri DOT used temporary traffic signals when only one lane of the highway could be opened. Staff monitored flood water on-site to keep the route open as long as possible, and used extensive community outreach to keep the public informed and minimize impacts from the detour. During recovery, State DOT staff must inspect the damage caused by flooding to determine whether roadways can be reopened or require repair—which can be a major challenge when roadways are closed and inaccessible. For example, 3,000 miles of roads were closed in Nebraska following the 2019 flood. District staff immediately began assessments and continued inspections over the following weeks to determine there were 27 damaged bridges and 200 miles of roadway requiring repairs. Nebraska DOT maintenance staff conducted the majority of cleanup and initial repairs, and then hired contractors to begin major repair work. Meanwhile, there were over 470 road closures in Missouri. Compounding the problem, 180 breaches in Missouri levees were not repaired by the USACE until a year after the flood, with some roads remaining underwater in the interim. This created a need for the DOT to understand the recovery process and timeline set by other agencies so DOT staff could access flooded areas to assess damage and set a timeline and approach for recovery. Given similar damage, Missouri DOT cited constraints on the District budget caused by major flood events. For instance, the State DOT spent about $11 million for flood recovery efforts in 2011. The repairs were completed by contract, and the 80 percent reimbursement came back into the District’s State Transportation Improvement Program (STIP) budget for contracting 8 years later. Additionally, assessing the economic impact of closures is a major challenge for justifying investments, faster response, and preparations for future flood events. A similar challenge, noted by Nebraska DOT, is that bridges reconstructed using Federal Emergency Management Agency funds must be built according to the original design and cannot be upgraded to anticipate future flood events. Missouri DOT is generating benefit-cost ratios and examining the likelihood of flooding on roadways impacted by significant and recurring floods to determine whether additional mitigation treatments (like raising the roadway or armoring shoulders) should be implemented with other repairs. Missouri DOT is also considering the installation of permanent gates on I-29, which would allow them to close the highway as warranted by future flooding and severe winter weather. ConclusionThe experiences by Iowa, Missouri, and Nebraska DOTs during major flood events provide a number of valuable lessons learned, especially for agencies that may have limited experience with flood events. Developing and maintaining relationships with partners will help agencies understand contacts and available resources when they are needed, as well as the various data and tools that may support prediction and response efforts. After a flood event, recovery efforts may last for months and are often beyond the State DOT’s control, depending on timelines of other agencies and availability of funding. Available ResourceFHWA’s EDC-5 WRMS Resource Toolkit: https://collaboration.fhwa.dot.gov/dot/fhwa/RWMX/SiteAssets/WRMS/home.aspx Technical ContactsTina Greenfield Tonya Lohman Michael Mattison The U.S. Government does not endorse products or manufacturers. Trademarks or manufacturers' names appear in this report only because they are considered essential to the objective of the document. For additional information, please contact: David Johnson 1 U.S. Department of Commerce, National Oceanic and Atmospheric Administration, Service Assessment: The Missouri/Souris River Floods of May – August 2011 (May 2012) [ Return to Note 1 ] 2 NASA Earth Observatory. “Historic Floods Inundate Nebraska.” https://earthobservatory.nasa.gov/images/144691/historic-floods-inundate-nebraska [ Return to Note 2 ] |
|
United States Department of Transportation - Federal Highway Administration |
||