Utilizing Probe-Vehicle Data for Work Zone Mobility Performance Management

Printable Version [PDF, 1.1MB]
You may need the Adobe® Reader® to view the PDFs on this page.
Contact Information: Operations Feedback at OperationsFeedback@dot.gov

U.S. Department of Transportation
Federal Highway Administration
Office of Operations
1200 New Jersey Avenue, SE
Washington, DC 20590
ops.fhwa.dot.gov
June 2019
FHWA-HOP-19-051
The Virginia Department of Transportation uses probe-vehicle-based performance measures to estimate work zone related delay and queuing at the State, district, corridor, and project levels.
Project Overview
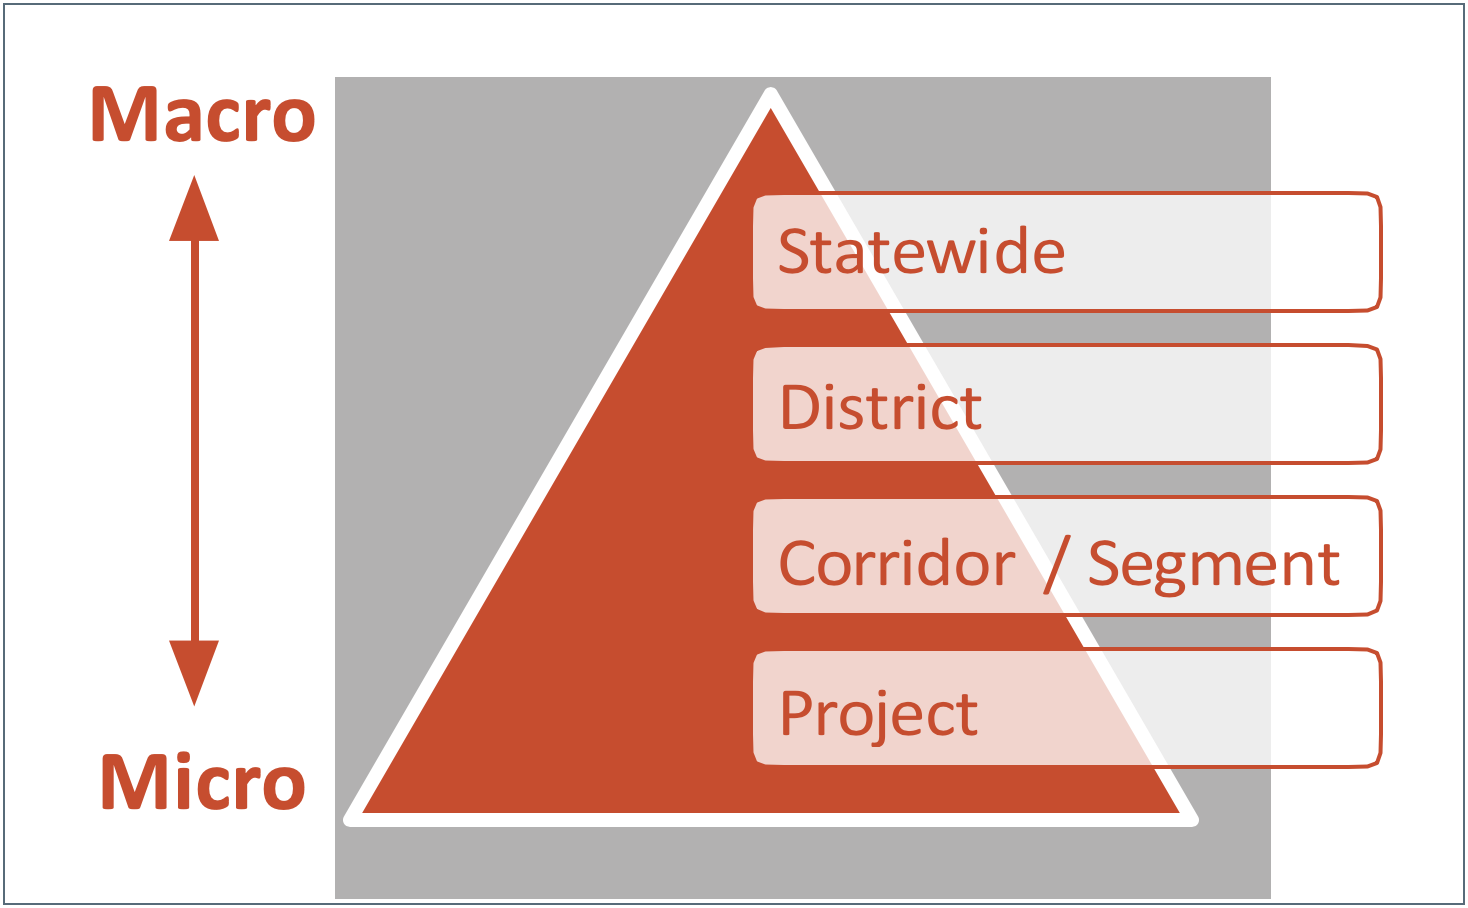
The Virginia Department of Transportation (VDOT) uses probe vehicle data from different sources to measure highway system mobility performance at both the macro- and microlevels. VDOT uses delay as the key metric for macro-level performance measurement and measures both recurring and non-recurring delay at the statewide, district, and corridor levels. The sources of non-recurring delay include traffic incidents, work zones, weather events, and holiday travel. VDOT's micro-level performance measurement uses more granular probe vehicle data to measure queues, queuing patterns, and travel time at the individual project-level on selected projects. The data and information are used to identify macro-level (e.g., corridor-specific) and micro-level (e.g., project-specific) contribution to delay, the underlying issues and root causes, and areas and opportunities for improvement.
Work zone mobility is a key focus area for VDOT's performance measurement program. By measuring work zone mobility performance at the project, road segment, corridor, district and statewide levels, VDOT is not only able to report performance on an annual basis but also analyze trends and patterns year-over-year and over time. Further, by segmenting and aggregating performance measures at the individual-project level and the macro-levels, VDOT gains a comprehensive bottom-up and top-down view of work zone performance. VDOT's work zone and traffic control practitioners use the intelligence gained from these efforts to improve project-level work zone management practices and broader agency, district, and corridor-level work zone policies and procedures.
Data and Analytical Tools
VDOT uses INRIX1 probe vehicle speed and travel time data as the key data for monitoring and quantifying work zone mobility performance. Since 2010, VDOT has purchased real-time speed and travel time data from INRIX, a traffic mobility data provider that uses Global Positioning System (GPS) trajectory data collected from a wide array of commercial vehicle fleets, connected cars, and mobile applications. INRIX provides speed and travel time data at different levels of granularity.
Lower granularity data is better suited for broader regional performance measurement while higher granularity data is best suited for understanding segment and project level performance and variability. INRIX XD and Sub-XD data segments are better able to quickly capture changes in traffic conditions when compared to the standard TMC data. However, the XD and Sub-XD data may produce a high data volume that may require additional storage, and higher handling and processing time and power.
Data Fusion, Visualization and Analytics
VDOT analysts and engineers fuse data from different sources using Tableau2 and other tools to gain an integrated understanding of performance including delay and congestion patterns, and potential causes and underlying issues. VDOT uses the following tools to integrate, fuse, analyze, and visualize data:
- RITIS-Probe Data Analytics Suite: Provides VDOT with the capability to calculate, analyze, and evaluate system performance measures to support planning, operations and other activities. Specific applications include real-time speed data, travel time reliability metrics, and queue measurements.
- iPeMS3: Traffic analysis system that provides tools for calculating and visualizing performance data from various traffic data sources including probe vehicles and road sensors.
- Tableau: Software tool that analyses and visualizes data from multiple sources.
VDOT uses the following additional data to supplement INRIX and/or provide additional contextual data to help understand the dynamics and causal relationships of work zone performance:
- Traffic volume counts from roadway detectors and from VDOT count stations (loop and radar detector-based);
- Bluetooth and WiFi travel time data on selected projects;
- Data from VDOT's five Traffic Operation Centers (TOCs) including incident, work zone activity, road condition, and weather data; and
- Vehicle Hours of Delay (VHD) data from the Regional Integrated Transportation Information System (RITIS)4 Vehicle Probe Analytics Suite.
Macro-Level Programmatic Analysis
A good delay and congestion management strategy starts with identifying sources of delay and measuring the magnitude of delay. The objective of VDOT's macro-level programmatic analysis is to obtain a high-level understanding of vehicle-hours of delay induced by recurring and non-recurring sources at the statewide, district, and corridor levels. Tracking high-level mobility performance over time helps to identify key work zone related-hot spots and issues that might require modifications to work zone transportation management plans and procedures.
The figure below shows the 2016 and 2017 results of VDOT's macro-level programmatic analysis of delay. In 2016 and 2017, non-recurring sources contributed to about 24% of total statewide delays in Virginia with work zones contributing an estimated 4% and 8%, respectively. Such analysis allows VDOT to gain a more representative understanding of delay from VDOT's work zones instead of extrapolating values from national averages that may not be representative of Virginia work zones. While the national average of non-recurrent delay is generally estimated to be 50% of total delay, VDOT estimated only 24% using more recent data sources. The split between recurrent and non-recurrent delay varied around the state, with recurrent congestion being more predominant in large urban areas. Similarly, the national average of work zone-related delay is estimated to be 10% of total delay, while that of Virginia ranged between 4% and 8%.
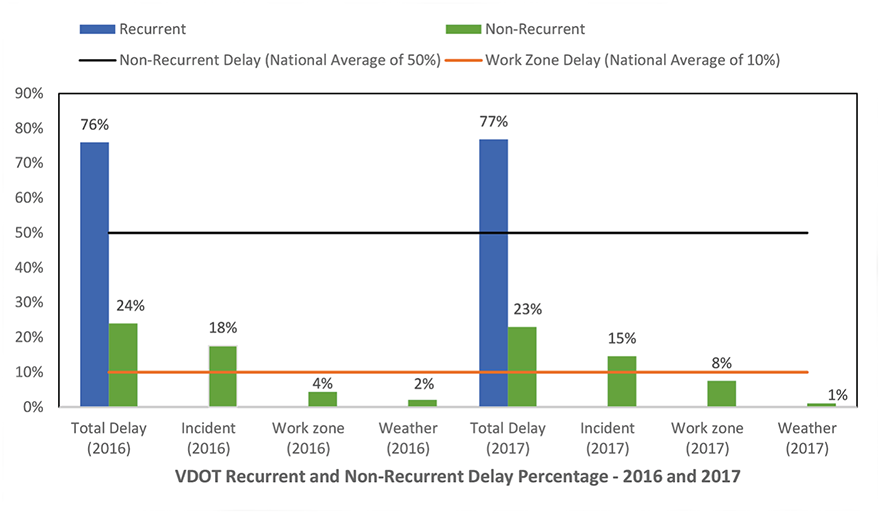
An interesting point to note is that the work zone related delay went up from 4% of total delay in 2016 to 8% in 2017. This was because VDOT started a major capacity expansion project in the Hampton Roads district in 2017, which resulted in a large increase in work zone-related delay. Having the performance numbers along with the appropriate contextual information allows VDOT to identify issues, attribute causality and context, and take action as appropriate.
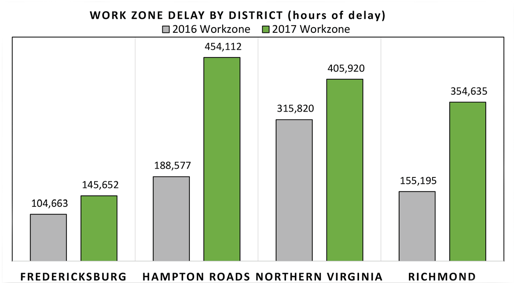
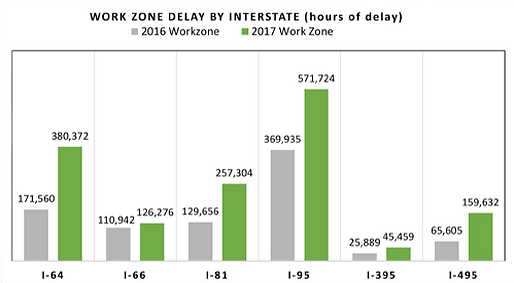
The two figures below depict work zone delay by VDOT district (left figure) and by corridor (right figure). As you can see, between 2017 and 2016, there is a marked increase in work zone related delay in the Hampton Roads and Richmond districts. VDOT can use this data to investigate why delay increased substantially (e.g., significant increase in the number/size of road projects, changes in district-level work zone management practices, etc.) and identify solutions to mitigate the issues and improve performance. At the corridor-level, in the years 2016 and 2017, interstates I-64, I-95, and I-81 experienced relatively high work zone delays compared to the other interstates. It is also important to note that while the total increase in delay for I-495 was not as high as other interstates, the magnitude of change was much higher, more than doubling from 2016 to 2017. A top line view of this data can indicate where VDOT needs to prioritize the agency's resources to improve the performance of key corridors that are most impacted by work zones.
Micro-Level (Project-Level) Analysis
VDOT's micro-level work zone performance measurement focuses on quantifying travel time and queue lengths for selected individual work zone projects. These metrics are analyzed based on time of day, duration, and length of the queue in a given work zone.
As mentioned previously, the TMC segment data from INRIX may not be granular enough to measure the delay performance and queuing patterns of individual work zones. For example, in rural areas, freeway TMC segments in Virginia can be up to 18 miles, and often they do not align with the work zone boundaries and may under- or over-estimate the work zone impacts. Therefore, VDOT uses higher resolution INRIX XD and Sub-XD segment data for analyzing the queuing and travel time impacts of individual work zones. INRIX XD data can have resolutions as long as 0.5 miles to 1 mile and Sub-XD can go as low as 0.16 miles. This data is integrated into Tableau and used to perform queuing, delay and travel time analysis. The below two charts show queuing heatmaps generated using INRIX TMC data (left) and Sub-XD data (right) for the same project and time horizon. The queuing analysis conducted with TMC data shows that there was a sustained queue of 1.97 miles from 1:16 PM to 4:29 PM. The same analysis using Sub-XD data shows that the maximum queue was a little lower at 1.94 miles, and that the typical sustained queue was only 1.36 miles, about a half a mile lower than that estimated using TMC data.
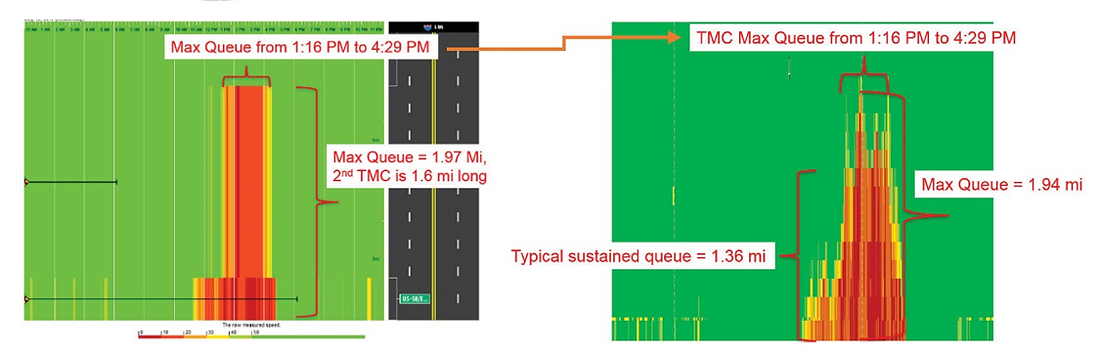
Queuing profiles obtained from INRIX's TMC (Left) and Sub-XD (right) datasets
Unlike the INRIX TMC or XD datasets, INRIX Sub-XD data is not readily available and is not archived by INRIX. In order to utilize this Sub-XD dataset, VDOT used INRIX's Application Programming Interface (API) to collect data and used Python to parse, process, and manipulate the probe vehicle data. Currently, VDOT uses INRIX Sub-XD data for offline analysis of delays and queues for individual work zones. In the future, VDOT is exploring the use Sub-XD data for real-time work zone performance monitoring and traffic management including queue warning and traveler information applications, and estimating real-time delays and queue lengths.
The key takeaways from VDOT's project-level work zone performance measurement practices are:
- Granular (e.g., < 0.5-mile segments) probe-vehicle data is needed to accurately analyze project-level delays and queues. However, TMC data can still be useful in getting a broad estimate of delay induced by individual work zones;
- Leveraging granular probe-vehicle data (i.e., XD and Sub-XD data) requires a certain degree of sophistication in the area of data analysis and data science; and
- The usage of probe-vehicle data for performance measurement is still a relatively young field and there is plenty of opportunity for innovation and application to work zones.
Using Sub-XD data for Real-Time Work Zone Management Systems
To test the accuracy of INRIX Sub-XD data and its suitability for active work zone performance management, VDOT set up an experiment in a smart work zone project along I-95 in Emporia, Virginia. The objective was to compare INRIX Sub-XD data with speed data collected from conventional methods. VDOT installed conventional radar sensors in the vicinity of the work zone to measure traffic speed, volume and density. The system would trigger queue warning messages when speeds dropped below 40 miles per hour (mph). The following are the key findings from the experiment:
- Overall, traffic speed data from conventional radar detectors and INRIX Sub-XD matched 97.7% of the time.
- When traffic speed was less than 55 mph, the match percentage reduced to 86.7%.
- INRIX Sub-XD data may be reliably used for work zone performance measurement and monitoring – for example, to model vehicle queuing dynamics, estimate delays, fine tune allowable work hours, and implement queue warning and management applications.
In addition, VDOT found that using INRIX Sub-XD data for real-time work zone management (e.g., smart work zone applications) can potentially eliminate the need for conventional sensors and hardware, and lead to significant cost savings for the DOT.
VDOT used INRIX Sub-XD data to monitor work zone queues and assess the impacts of queue management on four paving projects in VDOT's Northwest District.
Work Zone Data Challenges
VDOT practitioners are working to solve the following challenges related to work zone data.
- Incomplete and inaccurate work zone data. Work zones are sometimes entered as “point” occurrences rather than zones or sections on a route segment and the spatial extent of work zones is not reported. Work zone features are sometimes not accurately documented, such as lane closure information or work zone beginning and ending times. Work zone data documentation also suffers from lack of a consistent process and reporting format.
- Some data sources are not real-time. When calculating total vehicle-hours of delay, work zone travel time is obtained from real-time probe vehicle data while traffic flow rates (volumes) are based on historical counts. Therefore, total vehicle-hours of delay calculations may not exactly reflect the real-time total delays at work zones.
- Delay attribution may be inaccurate. It can be difficult to disentangle the different delay sources and definitively estimate work zone-related delays separate from the effects of recurring congestion, incidents, weather, and planned events when they occur simultaneously.
Key Takeaways from VDOT's Work Zone Performance Management Program
- A programmatic macro and micro analysis of work zone performance provides VDOT with estimates of work zone impacts at the statewide, district, corridor, and individual project levels. Performing macro analysis provides a high-level understanding of the cause, location, and magnitude of delay. This information enables VDOT to coordinate the management of work zone mobility issues across stakeholders, identify and prioritize areas for mitigation, and analyze trends and patterns towards ultimately improving work zone management policies and practices. The micro analysis provides a better understanding of the mitigation strategies needed for specific projects. Most importantly, micro analysis moves the technology forward and enables the innovations needed for State DOTs and other agencies to better understand and manage the mobility performance of road projects.
- Probe vehicle data provides a significant opportunity to measure both high-level as well as in-depth work zone performance. VDOT demonstrated that real-time probe vehicle data can be an effective data source for work zone performance measurement both at the macro- and micro-levels. Given the relatively low-cost and superior spatial coverage, real-time probe data when combined with other existing data (e.g., traffic counts and archived data), opens the possibility of getting a more comprehensive understanding of work zone mobility performance. DOTs are increasingly purchasing probe vehicle data for planning purposes and broader transportation system management and operations (TSMO) efforts, which presents an opportunity for work zone programs to “piggy back” their data needs onto such efforts. Another potential application of probe data is for use in ongoing agency work zone process reviews to improve policies and procedures.
- Accurate and reliable work zone performance measurement and monitoring requires fusing different data sources. Diverse datasets from diverse sources are required to support work zone performance measurement. For these datasets to be useful, all data sources should be cleaned and consistently formatted into a desired format, and appropriate fusion techniques need to be used to extract meaningful information. Creative data visualization techniques can also be useful in providing a visual understanding of the diverse datasets, e.g., overlaying plots of two data sets. Once data are fused, they can be used to identify and monitor work zone delay patterns, identify delay sources, and develop planning and operational countermeasures to minimize delays. VDOT has successfully developed and used custom software tools to mine, fuse, and visualize different work zone-related datasets. All agencies may not be readily able to support the effort and resources needed for processing and fusing complex data sources. Agencies may need to look to external partners for support as well as maintain a forward-looking mindset to adapt and be able to leverage the opportunities presented by new and emerging data sources.
- Standardized work zone activity data and documentation practices are needed. Work zone activity data and documentation often suffers from a lack of detail, inaccuracy, and formatting inconsistencies. Developing standard work zone activity data definitions, formats and processes will help to set the foundation for effective work zone impacts and performance management. Developing standard documentation procedures will increase the consistency and accuracy of manually entered work zone activity data.
For more information on VDOT's use of probe data for work zone mobility performance management, contact Michael Fontaine (Michael.Fontaine@vdot.virginia.gov).
Additional resources on SWZ Performance Measurement can be found at: https://www.workzonesafety.org/swz/
For additional information, please contact the FHWA Work Zone Management Program: WorkZoneFeedback@dot.gov
1 INRIX (Kirkland, Washington) is a private-sector source that provides probe vehicle speed and travel time data and analytics as a commercial service. [Return to Note 1 ]
2 Tableau is a data integration, visualization, and dashboarding software tool provided by Tableau, Inc. (Seattle, Washington). [Return to Note 2 ]
3 IPeMS is a transportation system performance monitoring and measurement platform that is provided by Iteris, Inc. (Santa Ana, California). [Return to Note 3 ]
4 RITIS is a regional integrated transportation system performance management platform provided by the Center for Advanced Transportation Technology (CATT) Lab at the University of Maryland (College Park, Maryland). [Return to Note 4 ]