Strengthening Linkages between Transportation Demand Management and Traffic Management
Context 6. Managing Special Events Using Parking, Traffic Demand Management, and Traffic Management
Special events, such as sporting events, concerts, parades, cultural events, and festivals, offer communities the potential for substantial economic and social benefits. Events can provide a tangible, immediate economic return from entry fees and accompanying purchases from local merchants. They can also unite communities, foster civic pride, and engage community members who help to organize and participate in the event.
These benefits can be quickly undercut if traffic congestion, lack of parking, and missing or unclear signage makes it difficult to reach the venue, or if event traffic impedes the normal movements of residents and commuters—resulting in negative publicity and citizen and business resentment that can linger long after the event. Conversely, a well-organized event that makes access to the event venue easy and reasonable, while allowing local travel to continue relatively seamlessly, can enhance political and community support and extend economic benefits by encouraging other groups to consider the community or venue for future events.
Bike Parking/Bike Valet at Sports Areas
Many venues are establishing bike parking and bike valet services. One example is Nationals Park in Washington, DC, which offers free, secure bike parking for more than 250 bicycles. The lot opens two hours prior to game time and remains open until one hour after the game ends. Capital Bikeshare also has docks and bikes available at the stadium. Bike valet parking is also offered at AT&T Park (San Francisco, CA), Amalie Arena (Tampa, FL), Golden 1 Center (Sacramento, CA), and Kauffman Stadium (Kansas City, MO).
Traditionally, special event traffic management has focused on limiting or controlling road access, expanding and managing event parking, and installing signage to guide participants. Many travelers use navigational or wayfinding apps such as Google Maps and Waze to detour around traffic bottlenecks. But when special events cause unusually high traffic volumes, these detouring vehicles can cause problems for residential communities near the venues. The towns of Mansfield and Norton, MA, encountered this situation for the sold-out crowd of 20,000 for a kickoff concert at a local arena. To mitigate residents' concerns in the hours during and following the concert, local police set up roadblocks on strategic roads so that travelers would input those roadblocks into their wayfinding apps and the apps would add those roadblocks into their navigating algorithms. Thus, the wayfinding apps did not include those roads in their detour routes, keeping traffic away from the neighborhoods. Following the concert, local police met with residents and successfully employed the same techniques for future concerts.
The three event case studies in this section illustrate both commonalities and unique characteristics that might be encountered in special event management. The first case, the 2015 Union Cycliste Internationale (UCI) Road World Championships bicycle races, reflects a multi-day international event that involved travel for event spectators, extensive use of roadways for races, and potentially substantial impact on local commute travel in the downtown of a State capital. The second case, the 2014 Super Bowl, profiles a sports venue well served by public transit and well used to dealing with large crowds, but hosting a high-visibility showcase event attended by many very important persons and out-of-town visitors who might be unfamiliar with transit. The third case, the 2017 solar eclipse in Wyoming, represents a rare, once-in-a-lifetime event that attracted nearly 200,000 out-of-state visitors to a State that was unaccustomed to traffic congestion of any kind, for a one-hour, weather-dependent event.
Combining Concert and Transit Tickets
The concert series Ogden Twilight in Ogden, UT, includes transit fare in the Twilight ticket price, locating the show just four blocks from a bus station served by three routes, and offering a bus pass with the concert ticket.
The common threads through these cases were development of modal and traffic management strategies appropriate for the events, wide dissemination of advance and real-time information, and extensive planning and coordination among a wide range of actors. Because many special events are one time or temporary in nature, transportation managers do not have the luxury of trial and error in managing event traffic; once the event begins, they have a limited amount of time in which to get it right. Thus, coordinated planning well in advance of the event is essential to define transportation, access, and information strategies; establish clear roles and responsibilities for traffic management tasks; brainstorm what could go wrong; and develop contingency plans. Integrated communication during the events, which connects transportation, public safety, emergency response, and public outreach and information functions in real time, can further smooth the process by quickly conveying information to event decision makers as issues arise during the event and coordinating rapid resolution.
Overall, these case studies demonstrate that a coordinated traffic mitigation—a transportation demand management (TDM) approach to special events—can result in a more successful event. The approach can also pay later dividends to the agencies and organizations involved in planning and managing the event, such as ongoing relationships established during the planning phase and in modal infrastructure and strategies developed for the event.
Establishing Ridesourcing Pickup Locations at Event Venues
During the month-long Mardi Gras celebration, options are available to allow visitors to leave their cars at home. In 2016, the transportation network company (TNC) Uber began a special promotion to encourage use of ridesourcing. Mardi Gras presents a particular traffic challenge because many roads and entire city sections are closed to vehicle traffic for the dozens of parades that occur over the month. Uber developed a Mardi Gras guide to direct potential riders to permissible pickup locations; the company has subsequently prepared similar guides for the Super Bowl in Houston and the Kentucky Derby in Louisville. Several event venues, including Nationals Park in Washington, DC, have worked with TNCs to designate a formal pickup area and limit curbside pickup.
Source: Uber.(46)

 Case 13. Union Cycliste Internationale Road World Championships (Richmond, VA)
Pre-event planning and during-event coordination led to new communication links among key agencies that participated in traffic mitigation activities
In September 2015, Richmond, VA, hosted the 2015 UCI Road World Championships, an annual 10-day bicycle racing event that attracts nearly half a million visitors, representing 34 States and 29 countries (figure 21). Major travel disruptions were expected not only from the influx of visitors, but also from rolling road closures that were required along the racecourses during daily road races that changed each day as the racecourse moved to different locations. The challenge presented by the race was to operate the event safely and efficiently and accommodate event visitors, while minimizing impacts on residents' daily lives and business operations.
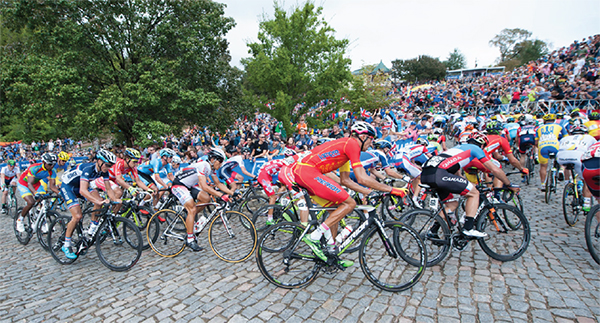 Figure 21. Photo. Race participants at the starting line of the 2015 UCI Road World Championships.(47)
(Source: Rena Schild/Shutterstock.com).
Figure 21. Photo. Race participants at the starting line of the 2015 UCI Road World Championships.(47)
(Source: Rena Schild/Shutterstock.com).
The race planning task force met this challenge through a combination of detailed planning that started two years before the event; extensive cross-agency coordination among transportation agencies and transportation service providers, city and county staff, police and public safety agencies, and business entities; and implementation of strategies to encourage travelers to use public transportation, telework, and other alternatives to driving during the event period. This task force included Richmond 2015, a nonprofit corporation formed specifically to organize, manage, and promote the UCI event; the Virginia Department of Transportation; and the Greater Richmond Transit Company (GRTC) (including RideFinders, a division of GRTC that is a non-profit commuter assistant organization). Richmond 2015 partners included the Commonwealth of Virginia, the City of Richmond, two neighboring counties, and numerous corporate partners. This task force developed strategies that incorporated transit, bike share, and shuttle service options alongside careful race route planning, rolling-bubble road closures, and other traffic management strategies to ensure minimal impact to regular traffic.
Noteworthy Outcome
These links and relationships have facilitated coordination on other projects since the event.
Because the event was so extensive and spanned a full business week, in addition to weekends, the City of Richmond required the event promoter to conduct a dry run event to test the interim planning. This test run was conducted in May 2014 for a smaller race that overlapped with only one commute day (Friday), but used course routes proposed for the UCI race and tested road closures, traffic and parking operations, and communications systems.
By transportation standards, the event was generally considered a success. There were no significant incidents, traffic impacts were minimized, and transit service accommodated riders as expected. The actual visitor count was lower than promoters had initially indicated, and thus the preparations for transit and parking demand were more than needed. But agencies involved with the planning indicated that capacity was available had the full visitor count been realized.
Strategies Providing Mode Choice
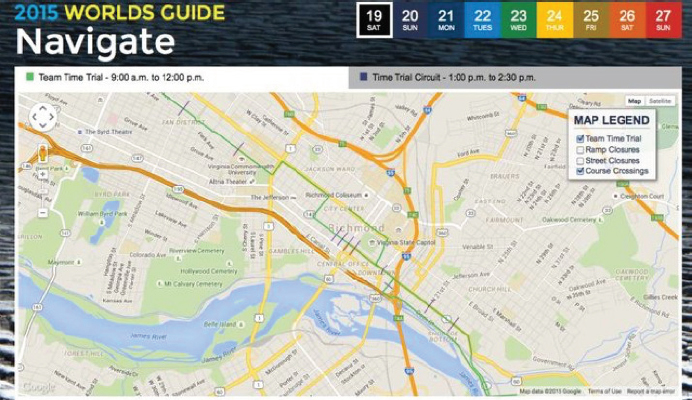
Event organizers prepared two printed travel option guides called Navigate the Worlds (figure
22)—one providing information about intercity and intracity transit options, and another providing road closure information. An online resource, Navigate.Richmond2015.com, featured interactive mapping tools and information on where to watch the event, transit and parking options, and travel restrictions.
GRTC added bus runs on some commuter routes, rerouted some routes to avoid roads that were closed for race activities, and added temporary stops along some of the detour routes. GRTC offered unlimited ride privileges (any route, any time) for the duration of the racing event. To facilitate efficient bus operation, GRTC established a new downtown 9th Street Transfer Plaza and routed nearly all local bus and commuter bus routes to pass through the transfer point. The plaza, which can accommodate 90 buses per hour, was established more than one year before the UCI event, so regular riders had sufficient time to adjust to route changes. GRTC assigned staff to work at the plaza throughout the event to assist riders who were unfamiliar with the service.
Temporary bikeshare stations provided rental bikes for use by residents and visitors. Amtrak and the Virginia Department of Rail and Public Transportation offered enhanced walk-up bike service on select trains and at select stations during the event, enabling out-of-town visitors to have their personal bikes available. Bike valets were provided in convenient locations throughout the downtown race areas. To create awareness about bike valets, Richmond 2015 operated bike valets at multiple community events before the UCI event. In preparation for the event, the City of Richmond undertook a bike infrastructure expansion that included bike lanes and bike racks.
The City of Richmond and event organizers established three remote parking areas with free shuttles to bring visitors who were staying in hotels outside the city to race-viewing locations. Shuttles began running two hours prior to race events and made their last trip back to the lots two hours after the podium ceremony concluded. The shuttles carried nearly 9,000 riders over the course of the event. Downtown parking was restricted in areas adjacent to race routes, encouraging using remote parking lots.
RideFinders and GRTC offered individual assistance to commuters, State agencies, universities, and major employers to identify carpooling, transit, and bicycling options for commute trips. RideFinders also extended the hours of its downtown Transit Store to enhance access to transit information and pass sales.
Strategies Providing Route or Time Choice
Racecourses were defined very early in the planning process, but a key element of the planning was early coordination between UCI, Richmond 2015, and transportation partners to define race-courses that took into account morning and evening commute patterns, while still providing a good experience for riders. The Richmond Police Department employed rolling bubbles to reopen streets block by block as cyclists passed. This minimized traffic disruption on racecourse routes and allowed police to lift access and parking restrictions as quickly as possible.
VDOT posted information about road and ramp closures and traffic alerts on 511virginia.org and used variable message signs (VMSs) to provide information to travelers who were en route to downtown. To respond to incidents on interstate and State routes, VDOT arranged for traffic cameras to feed to the Unified Command center to assist early responders to identify incident locations and service needs. VDOT also staged tow trucks and coordinated with local emergency services to promote timely response.
The City of Richmond and RideFinders worked with employers, particularly large employers, to provide telework and commuter flextime programs to shift travel out of the peak travel period. Several large employers, including State agencies, which comprise a substantial portion of employees traveling to the downtown, implemented liberal telework policies and minimized business activities that would require business travel to Richmond locations.
Successes Supportive of the Integration of Transportation Demand Management and Traffic Management
VDOT and its partners had the following successes:
Event planning spanned two years and required extensive coordination among many organizations. During the event, a Unified Command coordinated traffic operations, police, emergency services, parking, and transit activities. The command center included two-way radio connections among race organizers and transportation/police staff to facilitate rapid response to issues that arose. The pre-event planning and during-event coordination developed new communication links among key agencies, which have facilitated coordination on other projects since the event.
Preparation for the event included establishment of a bike stakeholders group, organized by the Department of Public Works, which met monthly to address biking issues and needs. The City of Richmond also developed new bike lanes, added bike accommodation on roadway bridges, installed bike racks in public areas, and created several bike repair stations along bike trails. The event increased public awareness and interest in bicycling, which has encouraged the City of Richmond to continue to expand its bike infrastructure.
 Case 14. Mass Transit Super Bowl (New Jersey and New York)
Heavy promotion of mass transit leads to many unused car parking spaces
Super Bowl XLVIII, pitting the Seattle Seahawks against the Denver Broncos, was played on February 2, 2014, at the MetLife Stadium in the New Jersey Meadowlands Sports Complex, less than 5 miles from Manhattan, NY (figure 23). Because of its location, the complex is well served by numerous transit options, including a dedicated rail shuttle and charter buses. Vehicle parking for the complex is constrained at only 13,000 spaces. Of the more than 80,000 fans attending the football game itself, it was anticipated that 40,000–50,000 would arrive by charter or public bus, 10,000–12,000 by train, and 20,000 by car (although many would be getting dropped off instead of parking).
 Figure 23. Logo. Super Bowl XLVIII travel logo.(49)
(Source: State of New Jersey Department of Transportation).
Figure 23. Logo. Super Bowl XLVIII travel logo.(49)
(Source: State of New Jersey Department of Transportation).
It was recognized that many fans attending the game would be from outside the region, so they may not have been familiar with the New Jersey/New York transit systems or even with riding transit at all, and would need information. To address this, a transportation plan (the Playbook) was jointly developed by NJ Transit and other area transit providers and the National Football League (NFL). The Playbook discussed how to plan for mass transit services during Super Bowl week as well as traffic mitigation strategies, such as traffic signalization and construction project suspension. Successful development of the plan required coordination among several agencies, each controlling different aspects of transportation. Assuming that other attendees could be New York residents or workers, the New York State Department of Transportation under the efforts of a TDM program (511NY Rideshare), also helped to carry out the travel management strategies in the Playbook through its TDM website. 511NY Rideshare conducts outreach to employers and individuals in New York City, Long Island, and the lower Hudson Valley and so had an opportunity to reach a large constituency.
Strategies Providing Mode Choice
Rail services and facilities were enhanced to maximize the carrying capacity and efficiency of the rail option. This included extending the platform to accommodate higher-capacity trains and adding capacity to most regional rail services and bus services. NJ Transit offered a Super Pass for unlimited rides during Super Bowl week. Based on prior experience with other Super Bowls, the NFL operated a Fan Express bus service from locations in Manhattan and New Jersey. This was a pre-ticketed, non-stop service from nine stops.
On Super Bowl Sunday, an unanticipated number of fans used the dedicated rail shuttle service and overwhelmed the transit system. Some 28,000 fans used the dedicated rail shuttle to access the complex, and 33,000 used this option to depart. However, projected mode splits were the opposite: 40,000–50,000 by bus and 10,000–12,000 by train. Over 20,000 fans bought their train tickets on game day, providing only a short window of opportunity to plan for the demand. Unfortunately, the number of fans accessing the rail system after the game far exceeded the capability of the rail service and its security system to move fans efficiently and quickly. Fans waited up to 90 minutes to get into the stadium and several hours to depart from the stadium after the game ended. To provide context, for events at the Meadowlands that are anticipated to exceed 50,000 persons, NJ Transit has never seen shuttle counts higher than 12,500 for regular-season NFL games. A report to the NJ Transit Corporation Board of Directors pointed out several key lessons learned, two of which were the need for contingency planning for unexpected demand, and the need to better communicate the capacity of each travel option.
Strategies Providing Facility or Lane Choice
The Lincoln Tunnel Exclusive Bus Lane, operated by the Port Authority of New York and New Jersey, was expanded from one to two lanes for traffic from Manhattan to New Jersey (figure 24). Special approach lanes were also created for cars with a special NFL placard. Additionally, real-time information was provided via VMSs on the George Washington Bridge (another major crossing between New York City and New Jersey).
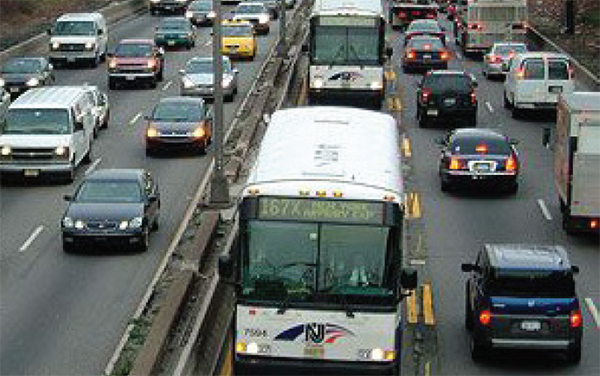 Figure 24. Photo. Buses traveling in the exclusive bus lane.(50)
(Source: Port Authority of New York and New Jersey).
Figure 24. Photo. Buses traveling in the exclusive bus lane.(50)
(Source: Port Authority of New York and New Jersey).
Successes Supportive of the Integration of Transportation Demand Management and Traffic Management
NJ Transit and its partners had the following successes:
Service providers made enhancements to their services and facilities to accommodate more demand during the week.
Transit services and traffic management were integrated into a single Playbook to accommodate moving fans for this large-scale special event. The Playbook detailed special services, special fares, maps, and a marketing campaign to promote the use of public transportation during Super Bowl week. The Playbook also detailed other traffic mitigation strategies, such as the New Jersey Department of Transportation's suspension of all roadway construction within a 20-mile radius of the stadium and ways to leverage the signal timing optimization system, which enables 144 traffic signals to self-adjust signal timings based on the flow of traffic rather than set times. The Playbook was a coordinated effort to maximize the use of public transit to get to the Super Bowl at the Meadowlands.

Noteworthy Lesson Learned
The unanticipated heavy usage of train over bus led to lessons learned: have contingency planning for unexpected train demand and provide better communication on the capacity of travel options to travelers.
 Case 15. Wyoming Department of Transportation and the 2017 Solar Eclipse
Finding ways to reduce congestion but still encourage travel to the State
The solar eclipse on August 21, 2017, passed across the entire State of Wyoming (figure 25) and attracted over 261,000 eclipse viewers, 197,600 of which were from outside the State. This rare event posed unusual challenges to a region that is typically unconcerned with traffic congestion and crowding. Further complicating planning for the event, there was no precedent with which to gage crowd levels. Through a collaborative, State-level planning approach, WYDOT sought to encourage carpooling, early arrivals, and informed departures for the event.
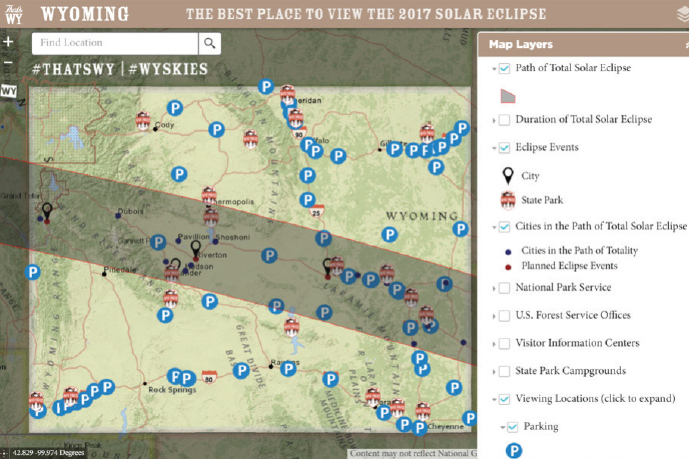
 Figure 25. Wyoming visitor information website with layers to assist travelers wishing to view the total solar eclipse.(51)
(Source: Wyoming DOT).
Figure 25. Wyoming visitor information website with layers to assist travelers wishing to view the total solar eclipse.(51)
(Source: Wyoming DOT).
This was an unusual TDM and traffic management challenge in that WYDOT did not want to discourage people from traveling to see the eclipse, so strategies to reduce total travel or to shift traffic or destinations away from the totality path were not feasible options. Rather, WYDOT had to find other ways to manage the congestion and perhaps the total number of vehicles on the road.
Noteworthy Outcome
Routes experienced a 100 to 400 percent increase in traffic, but due to proactive messaging about anticipated delays, WYDOT received no complaints from the public.
During the eclipse event, many routes experienced an over 100 percent increase in vehicular traffic, with one segment of I-25 seeing an over 400 percent increase in traffic compared to the five-year average. Despite the traffic, WYDOT received no complaints from the public and credits proactive messaging about the event. Further, only one traffic fatality occurred, which was due to an illegal maneuver of a motorcycle. WYDOT had several planned activities to communicate weather and travel information for the event and executed all of them with the sustained assistance of the National Weather Service (NWS).
Strategies Providing Destination Choice
The WYDOT 511 map included a layer explicitly related to the eclipse, showing many possible parking and viewing locations. Pairing this information with the route suggestions and travel times that were available on the WYDOT 511 website, WYDOT helped spread visitors out across the State. On the day of the eclipse, WYDOT used dynamic message signs (DMSs) in three different ways:
To discourage travelers from parking along the highway or within the emergency vehicle right of way; parking in these areas would prevent highway patrol and emergency vehicles from using these areas in case of an emergency.
To discourage people from stopping on the road around the time of the eclipse and causing traffic to build up behind them.
To help people find an appropriate area to view the eclipse and alert travelers when upcoming destinations were full.
Strategies Providing Route or Time Choice
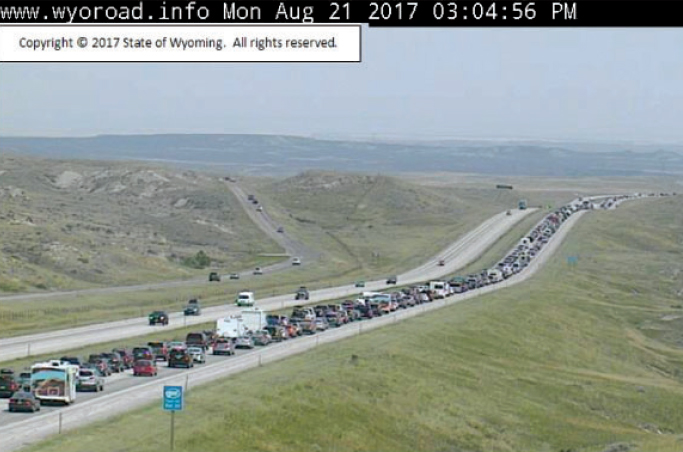
The Wyoming Office of Tourism attempted to get out-of-state travelers to consider extending their visits either before or after the eclipse via a Wyoming Skies advertisement campaign. This would spread out inbound and outbound travel demand and offer local economic benefits. Route suggestions and real-time travel times were available on the WYDOT 511 website to show travelers what current conditions were and help drivers avoid congested areas (figure 26). WYDOT used Pathfinder, a road weather management strategy that includes collaboration with NWS, to share clear and concise explanations of the impact of weather on road conditions and viewing locations.
 Figure 26. Wyoming highways experienced high volumes of traffic from travelers coming to view the total solar eclipse.(52)
(Source: WYDOT).
Figure 26. Wyoming highways experienced high volumes of traffic from travelers coming to view the total solar eclipse.(52)
(Source: WYDOT).
For freight, WYDOT issued proactive messaging through its Commercial Vehicle Operator Portal to make freight drivers aware that heavy traffic would be expected during the total solar eclipse and that no oversize load permits would be issued on that day. Further, WYDOT collaborated with the Wyoming Trucking Association to disseminate warnings and advisories to avoid the area during the eclipse.
To further reduce traffic buildup, WYDOT implemented a temporary moratorium on construction activities so that lane closures or slow construction zones would not impede routes.
Successes Supportive of the Integration of Transportation Demand Management and Traffic Management
WYDOT had the following successes:
WYDOT and the Wyoming Office of Homeland Security set planning efforts at a State level, creating a consistent planning framework across the State. This allowed WYDOT to implement strategies such as placing a statewide moratorium on road construction and preemptively stationing emergency responders in key corridors.
During the lead-up to the eclipse, regular meetings were held with a key group of about 10 individuals (the number of attendees was limited to ensure meetings were effective and fast moving). Attendees included the eclipse planning lead at WYDOT, maintenance engineers, the deputy of highway control, an intelligent transportation system specialist, a public relations specialist, and an aeronautics specialist since WYDOT has air travel in its purview. Now, after the eclipse, these personal relationships are making later collaboration easier.