Metro Model: Innovative Data Sources Inform Truck Tour Framework for Dynamic Portland Region - Freight Demand Modeling and Data Improvement Implementation Support
Printable Version [PDF 1.5 MB]
You may need the Adobe® Reader® to view the PDFs on this page.
Contact Information: Operations Feedback at OperationsFeedback@dot.gov

U.S. Department of Transportation
Federal Highway Administration
Office of Operations
1200 New Jersey Avenue, SE
Washington, DC 20590
FHWA-HOP-18-023
December 2017
Table of Contents
Executive Summary
Challenges
Located in the Pacific Northwest, Metro serves as Portland, Oregon's metropolitan planning organization (MPO). As an international gateway and domestic freight hub, the region is particularly influenced by the dynamic trends affecting distribution and logistics. Thousands of Oregon companies depend on Portland's marine, rail, air, and road facilities for access to markets. The agency has spent thousands of staff hours in truck model maintenance, updates, and applications over the past 20 years. As it was completing commodity flow forecasts for 2014, the MPO became increasingly interested in improving freight demand modeling capabilities. Metro's model at the time was limited in its ability to report responses to network conditions and costs. In addition, the model could only depict truck volumes on the network, but not the flow of goods by commodity type. Further, Metro found that the model's usability was limited as a tool to support regional policy evaluation.
Approach
At the time, research sponsored by the Federal Highway Administration (FHWA) and led by the Chicago Metropolitan Agency for Planning had produced and implemented an advanced freight behavior-based model in the Chicago region. Metro applied for and was awarded second Strategic Highway Research Program (SHRP2) C20 implementation assistance to build from this model. In addition, Metro was able to secure additional local funding to design and conduct an establishment survey to collect behavioral freight data for the region.
Outcomes
The Metro project team first collaborated with the region's freight stakeholders and potential model users to gain a better understanding of their needs and challenges. Next, the project team successfully implemented and improved the behavior-based freight model that was previously developed in Chicago. Finally, the project team conducted a robust establishment survey effort that included developing a smartphone application for data collection as well as collecting and analyzing both vehicle system monitoring data and truck global positioning system data to supplement survey responses.
Integration Into Business Practices
The model developed under this project will help Metro and its stakeholders evaluate regional economic policies, understand the broad range of responses to transportation network conditions and costs, depict both truck volumes by vehicle type and flow of goods by commodity type on its network, and understand movement of freight and service trucks.
Introduction
Background
Located in the Pacific Northwest, Metro serves as Portland, Oregon's MPO. Access to the Pacific Ocean via the Columbia River created the region's original economic engine. As an international gateway and domestic freight hub, the region is particularly influenced by the dynamic trends affecting distribution and logistics. Thousands of Oregon companies depend on Portland's marine, rail, air, and road facilities for access to resources and markets. Within the last two decades, the agency has spent thousands of staff hours in truck model maintenance, updates, and applications. The MPO's first commodity-flow based truck model was developed in 1996. Commodity flow forecasts for the region were first prepared in 1997 and subsequently updated in 2002, 2006, and 2014. The 2014 commodity flow forecast was used to update Metro's truck model in the same year. The commodity flow survey projected a doubling of freight tonnage moved in the region by between 2002 and 2030. Over the years, Metro has completed a number of other activities related to freight data analysis and modeling, such as intercept truck surveys, motor carrier surveys, truck following studies, and extensive classification counts.
In addition to Metro's technical experience, the agency has executive-level support for freight modeling. The MPO developed its first regional freight plan in 2010. The plan specifically calls out investment in analytical tools, including a multimodal freight model, as a key priority. Further, funding was allocated to improve analysis tools.
Changes in shipping patterns driven by advances in logistics platforms and increases in shipment volumes are limiting the accuracy of traditional freight modeling methodologies. Further, traditional data sources are not providing the level of detail required to accurately depict freight shipment behavior. In recent years, the state of the practice for passenger demand modeling has advanced toward activity-based modeling to more closely replicate actual traveler decisions and behavior; however, the state of the practice for freight demand modeling had been relatively unchanged over the same timeframe.
Several challenges limit the accuracy of traditional freight models. Typically, these are aggregated models that do not provide adequate ability for sensitivity testing with regard to fine-grained changes, such as variations in specific economic drivers or different land use scenarios. These traditional freight models are often limited to goods shipped via truck and do not account for the multi-modal aspect of supply chains. Finally, many traditional freight models do not address regional or international supply chains, and if they do, are limited to simple scenarios. Without accurate or reliable tools or methods, transportation planners at State agencies, MPOs, and in the private sector struggle to make sound decisions on a variety of issues in the realm of freight transportation. One approach to overcoming the limitation of traditional freight models is developing behavior-based demand models.
As Metro was completing the commodity flow forecasts for 2014, the MPO became increasingly interested in improving model capabilities. It sought to increase the model's range of responses to network conditions and costs. The agency also desired to depict, not only truck volumes on the network, but the flow of goods by commodity type. Finally, Metro was interested in better using its model as a tool to support regional policy evaluation. In an effort to secure support for these model improvements, Metro applied for and was awarded funding from the Strategic Highway Research Program 2 (SHRP2) C20 Implementation Assistance Program.
Project Team
Table 1 describes the various partners and their roles on this project.
| Project Partner | Role |
|---|---|
| Metro | Led project. |
| Port of Portland | Provided stakeholder input. |
| Portland Freight Committee | Provided stakeholder input. |
| Oregon Department of Transportation | Provided stakeholder input. |
| Federal Highway Administration | Provided coordination support and guidance. |
Objectives
The overarching objective of the project was to develop and implement a behavior-based freight model for the region. The project team anticipated that this model would:
- Help stakeholders evaluate regional economic policies.
- Depict a broad range of responses to network conditions and costs.
- Depict both truck volumes (by vehicle type) and flow of goods (by commodity type) on the network.
- Include freight trucks as well as service and parcel trucks.
Process
Project Management
The project team selected a consultant with national freight modeling experience to lead the development of the new tool. Frequent project meetings were held to review progress, discuss technical issues, review output and recent findings, and discuss upcoming activities.
Project Implementation
The sections below discuss major project components as well as related activities completed by the project team to develop, test, and implement a behavior-based freight model. This case study provides a brief overview of the most significant of these activities. The development of any behavior-based freight model consists of many tasks, including thorough testing, calibration, and validation. For brevity, not all of these tasks are discussed in the case study.
Data Identification and Collection
The consultant selected for this project had significant experience developing similar models for other transportation agencies and leveraged it in developing the new model. Building from previous experience, the project team initially identified important data sources used by other agencies for input on behavior- based freight modeling. While some of these data sources were publicly available with nationwide coverage (e.g., Commodity Flow Survey data), other sources were not (e.g., truck counts).
Publicly available datasets with nationwide coverage make up a significant portion of those used by the project team. These publicly available datasets included network, freight flow, economic, and employment data. The project team also obtained local data for input, calibration, and validation of the model. Examples of local data obtained include highway networks, truck traffic counts, and freight facility locations.
Behavioral freight data are data that provide more context regarding individual trips. Typical information includes the context or purpose of travel, types and quantities of commodities transported, origins and destinations, linkages between stops on a tour, arrival/departure times, and attributes of the establishments involved in each travel event. These data are critical in calibrating and validating the behavioral aspects of a behavior-based freight model. Many agencies do not have access to this type of information from their own regions. To overcome this challenge, behavioral data can be adapted from other regions, or the data can be collected.
For this project, Metro collected behavior data through the development of an establishment survey that focused on travel across four counties in Metro's modeling area. Invitations to participate in the survey were distributed to non-freight service providers (e.g., construction contractors) and firms associated with short-distance light- and medium-truck goods movement. Focus groups were held before survey development, recruitment, and piloting to assist the project team in modifying the materials, helping ensure that potential participants would clearly understand the language and information in the survey.
Survey participants were given the opportunity to use a standard paper-based survey (Figure 1) or the smartphone application (Figure 2). The paper-based survey was similar to a traditional travel log, where participants were asked to record arrival and departure times, locations, and purposes for each work trip. The smartphone application simplified this process in some ways because the users did not have to record time and location data that was already captured from the global positioning system (GPS) receiver within their smartphone. Users of the smartphone application simply had to enter information regarding the purpose of trips.
In two cases, businesses in the region opted to share vehicle system monitoring data instead of participating in the survey. As such, the project team received records from a wholesale beverage distributor that serves Northwest Oregon and Southwest Washington and the largest public utility provider in the Portland region. The project team opted to also obtain truck GPS records from two data vendors to further supplement this information. In all, the project team collected GPS records for approximately 3.2 million truck trips in the region.
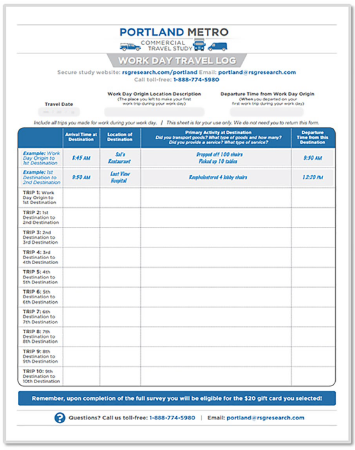
Source: Metro
Figure 1. Image. Example work day travel log.
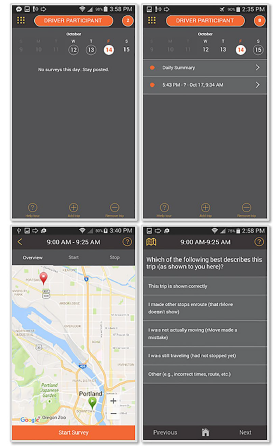
Source: Metro
Figure 2. Image. Example screenshots of the survey smartphone application.
Model Design
At the beginning of this project, the project team held a series of meetings with freight stakeholders and potential model users in the region. The purpose of these meetings was to get a better understanding of the needs of potential users. The organizations participating in these meetings included the Oregon Department of Transportation (ODOT), the Port of Portland, local agencies, and the Portland Freight Committee.
Together, the interviews allowed the project team to compile a list of issues and challenges faced by freight stakeholders in the region as well as freight-related impacts stakeholders wanted to measure with the new model. In general, participants cited challenges conducting analyses on the non-truck freight modes as well as calculating impacts of specific freight-related activities such as last mile truck moves, opening a new distribution facility, and investing in operational improvements. The project team took the challenges and needs into consideration when developing the freight model.
The project team designed a model framework integrating the new freight model with the existing passenger travel demand model (Figure 3). The figure illustrates how the new model components (shown in orange) were integrated with the existing travel demand model (shown in gray), and illustrates the model outputs (shown in blue).
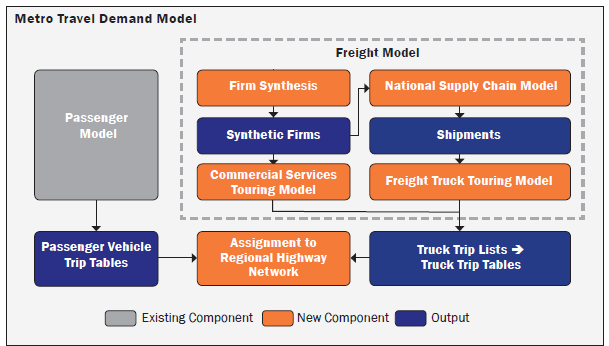
Source: Metro
Figure 3. Diagram. Metro model design framework.
The sections below provide further overviews of three new components in the freight model framework: the national supply chain model, the freight truck touring model, and the commercial services touring model.
National Supply Chain Model
The supply chain model consists of several steps (Table 2). It begins with development of a list of businesses both within and outside the model's study area. With the list of businesses established, suppliers and buyers are connected based on supplier production and buyer consumption. Commodity flows are distributed among the pairs and a determination is made whether the shipments were direct or required intermediate handling (e.g., a distribution center). The model then calculates the shipment size and the frequency of shipments between each buyer and supplier pair. Next, the shipment mode is determined for each leg of the trip. Finally, the trip is assigned to the multimodal network.
Table 2 summarizes the steps involved in developing the supply chain model.
| Step | Description |
|---|---|
| 1. Firm Synthesis | Produce a list of all firms (i.e., buyers and supplier) within the United States as well as a sample of international firms. |
| 2. Suppler Firm Selection | Match buyer firms with supplier firms based on commodity produced and consumed. |
| 3. Goods Demand | Estimate the annual commodity demand in tonnage between each buyer and supplier pair. |
| 4. Firm Allocation | Allocate appropriate firms to the traffic analysis zone within the study region. |
| 5. Distribution Channels | Estimate how goods are shipped between each buyer and supplier (e.g., shipped directly, shipped through a distribution center). |
| 6. Shipment Size and Frequency | Convert total tonnage shipped between buyer and supplier to discrete shipments. |
| 7. Modes and Transfers | Estimate the travel mode for each leg of the shipment as well as any applicable transfer locations. |
| 8. Trip Assignment | Assign shipments to the multimodal network and any applicable transfer centers (e.g., a distribution center). |
Truck Touring Model
This model estimates truck activity within the model's region. Direct shipments (shipments without intermediate handling) are modeled as out-and-back trips. Shipments involving a distribution center are modeled as truck tours1 to simulate actual pickup and delivery activity within the region. For each truck tour simulated, departure and arrival times are estimated as well as the need for any intermediate stops (e.g., for a meal). Metro's implementation of this model improved previous truck touring models by adding the steps to estimate intermediate stops along a truck tour.
Table 3 summarizes the specific steps involved in developing this model.
| Step | Description |
|---|---|
| 1. Ports of Entry/Exit | Determine how and where the shipment entered the truck touring model's region. |
| 2. Vehicle Choice and Tour Pattern | From the port of entry, determine tour pattern (e.g., direct to destination, truck tour) as well as vehicle class (e.g., heavy truck). |
| 3. Stop Clustering | Shipments delivered on a truck tour are grouped. |
| 4. Arrive Time at First Stop | Estimate delivery time for the first stop on the tour. |
| 5. Routing Sequence | Sequence stops using the "Traveling Salesman" algorithm* on travel time combinations. |
Commercial Services Touring Model
The third major component of the model is the commercial services touring model. The purpose of this model is to estimate truck trips due to non-freight commercial vehicles (e.g., construction vehicles). This model uses similar design concepts and model components as the truck touring model, with tweaks to vehicle type and stop duration based on industry, trip distance, and stop purpose.
While the truck touring model and the regional commercial vehicle touring model share similar design, several important differences exist. With regard to vehicle classes estimated in each, the truck touring model focuses on medium (FHWA classes 4 through 7) and heavy vehicles (FHWA classes 8 through 13) while the commercial vehicle touring model also includes light duty vehicles (FHWA class 3). All of the trips estimated in the truck touring model involve a shipment delivered to a business, whereas the commercial vehicle touring model has service stops to both business and residences as well as deliveries to residences. Finally, the truck touring model is connected to external demand (i.e., the national supply chain model), but the commercial vehicle touring model is not influenced by external demand.
Model Integration
The new Metro model was developed and the various components were integrated using the R programming language, an open source programming language commonly used for statistical and data analysis. The functions and scripts that comprise the model have been compiled into a single package called "rFreight." While the model developed in this project has been tailored for Metro, rFreight is the basis of freight models currently being used by other States and metropolitan planning organizations.
Outcomes
Project Benefits
The Metro behavior-based freight model is founded on a combined supply chain and tour-based framework developed and implemented in the Chicago region through the Broad Agency Announcement (BAA) program offered by the Federal Highway Administration (FHWA). The same framework is used by several other agencies in the United States, which allows the improvements made by the Metro project team to have applicability elsewhere.
The project developed a freight flow model for a region encompassing two MPOs: Metro and the Southwest Washington Regional Transportation Council. The new model produces detailed truck and freight forecasts that will support decisionmaking within the two MPOs as well as in neighboring cities and smaller municipalities throughout the region.
Metro and its partners will be able to use this model to answer questions related to regional economic policies. The model has the ability to focus on major regional export sectors, to produce data on the economic costs of bottlenecks, and to help planners model freight-related impacts of commercial and industrial land use policies and plans.
The new model added a more accurate depiction of trucks on the network. This gives planners a better understanding of responses to congestion and cost. It also sheds light on estimated times and frequencies of deliveries, number and length of truck tours, number of stops that are made per tour, and the number of trucks needed to serve all customers in the region. In addition, the model increased Metro's ability to understand the flow of goods on the network. It expands the truck classes (e.g., light, medium, heavy) that may be modeled and can track commodities by type and value.
Service vehicles (e.g., construction and parcel delivery vehicles) often account for a significant percentage of truck movement in urban areas. However, they are not typically accounted for in freight models and were not included in Metro's previous model. This project includes a component focusing on service vehicles and will allow planners to estimate the movement of these vehicles separately from typical freight vehicles (e.g., long-haul trucks).
Transferability of the Project
While many of the activities of this project were completed to tailor the model to the Portland, Oregon metropolitan area, other States and MPOs are currently deploying the core model used. Agencies that want to develop and implement a similar behavior-based freight demand model will be able to replicate activities completed within this project, building upon that core model. These agencies will need to ensure they have, or can obtain, the required data to calibrate and validate the model.
Lessons Learned
The project team shared a number of lessons learned during the process of developing this model:
- Establishment survey recruitment was more difficult than expected. Before it began, the project team was fully aware of the typically low participation rates for establishment surveys. The team developed a robust recruitment strategy that included hiring a past Oregon Trucking Association president with longstanding ties to the freight industry, holding successful focus groups, developing a press release from Metro that was distributed to local business publications announcing the project and survey, mailing 6,000 postcards to businesses, and developing a user-friendly smartphone application for drivers. Even with these recruitment activities, the project team did not meet the original sample size target.
- Smartphone application for data collection can provide high quality data, but presents challenges. This project was successfully able to capture driver behavior data through a smartphone application. Some of the recruitment challenges faced by the project team were specific to that application, however. Team members believe that the delay caused by the requirement to register for the smartphone application before beginning the survey caused some participants to lose interest. The project team initially asked participants to use the smartphone application for seven days, but this request was relaxed to a single day later in the study. If this had been the original requirement the team believes it would have attracted a larger sample size. Finally, some businesses declined to participate in the smart phone application option, due to concerns about distracted driving.
- Vehicle monitoring system data can be useful as behavioral data. In lieu of participating in the establishment survey, two businesses in the study area provided vehicle monitoring system data to the project team. A challenge specific to obtaining vehicle monitoring system data is that the data are not likely standardized as different businesses use different systems and track different information. Processing such data can require a significant amount of cleaning and standardization, but the data may prove more robust than establishment surveys or smartphone data.
- Companies are willing to share the vehicle data. While vehicle monitoring system data did not necessarily include all of the contextual information provided by the survey (e.g., stop purpose, commodity type), the willingness of businesses to share their vehicle monitoring system data, traditionally held as proprietary, was promising. The project team believes that in addition to (or in some cases instead of) conducting an establishment survey to obtain behavioral data, a tool or data collection strategy might be developed to extract the necessary information directly from the vehicles or from dispatch software used by a company, bypassing the need to work with vehicle drivers. Feedback from businesses in this project showed that, after being assured of confidentiality, the barrier to establishment survey participation often remained its potential for driver distraction.
Next Steps
The Metro project team has identified several next steps it wishes to complete with its new model. This includes working with neighboring MPOs and the State to coordinate and integrate models. Also, several advancements were identified that may be pursued in the future, including:
- Conducting further research to identify time-sensitive shipments (e.g., certain factory and construction site deliveries, some food shipments) and modify the freight model to enable tracking them.
- Improving long-haul mode choice by introducing additional attributes on the supply chain network.
- Assigning additional modes to the local freight network (e.g., direct rail shipments to local businesses; trains into, out from, and through the region) to enable analysis of rail/highway conflicts.
Conclusion
Through this project, Metro was able to implement a behavior-based freight model for the region. Notable outcomes of this project included:
- Building on the freight model framework previously developed and implemented in Chicago, since improvements achieved under this project can be transferred to other users.
- Gathering key stakeholders and potential model users to solicit needs and building those needs into the project's work plan.
- Developing and implementing a robust recruitment process and smartphone application to conduct an establishment survey and collect behavioral data.
- Supplementing behavioral data with truck GPS data and vehicle system monitoring data.
The model developed under this project will help Metro and its stakeholders evaluate regional economic policies, understand the broad range of responses to transportation network conditions and costs, depict both truck volumes (by vehicle type) and flow of goods (by commodity type) on the network, and understand movement of freight and service trucks on the network.
Product Information
Product Title: SHRP2 C20: Behavior-based Freight Demand Model
Agency Name: Metro
Contact Information:
Name: Chris Johnson
E-mail: Chris.Johnson@oregonmetro.gov
Phone: 503-797-1765
1 A truck tour represents a series of movements (e.g. deliveries) that a truck makes throughout a single day, often resulting in the truck returning to the location it started from. This term is used in contrast to a truck trip which typically represents a single truck movement from origin to destination where the truck starts and ends in different locations. [ Return to note 1. ]

The second Strategic Highway Research Program (SHRP2) is a partnership of the Federal Highway Administration (FHWA), the American Association of State Highway and Transportation Officials (AASHTO), and the Transportation Research Board (TRB). TRB completed the research, and now FHWA and AASHTO are jointly implementing the resulting SHRP2 Solutions that will help the transportation community enhance productivity, boost efficiency, increase safety, and improve the reliability of the Nation's highway system.
FOR MORE INFORMATION
Chris Johnson
Metro Modeling Services Manager
Metro
Phone: 503-797-1765
E-mail: Chris.Johnson@oregonmetro.gov
Jeffrey Purdy
Federal Highway Administration
Office of Freight Management and Operations
Phone: 202-366-6993
E-mail: Jeffrey.Purdy@dot.gov
Learn more about the SHRP2 program, its Capacity focus area, and Freight Demand Modeling and Data Improvement (C20) products at www.fhwa.dot.gov/GoSHRP2/
STRATEGIC HIGHWAY RESEARCH PROGRAM
U.S. Department of Transportation Federal Highway Administration
American Association of State Highway and Transportation Officials – Transportation Research Board