Intra-Local Distribution Model: How Regional Tour-Based Truck Movement Fits Within Statewide Flows
Printable Version [PDF 1.0 MB]
You may need the Adobe® Reader® to view the PDFs on this page.
Contact Information: Operations Feedback at OperationsFeedback@dot.gov

U.S. Department of Transportation
Federal Highway Administration
Office of Operations
1200 New Jersey Avenue, SE
Washington, DC 20590
FHWA-HOP-18-022
December 2017
Freight Demand Modeling and Data Improvement Implementation Support
Table of Contents
Executive Summary
Challenges
Estimating and forecasting freight movements in today's heavily congested Baltimore-Washington metropolitan area demands sophisticated models and analytics well beyond the capability of traditional tools. The region is home to many major freight facilities representing all modes, yet geography and dense urban development provide limited infrastructure expansion options. The Maryland Department of Transportation State Highway Administration(MDOT SHA), Baltimore Region Transportation Board (BRTB), and the Baltimore Metropolitan Council (BMC), understood that these factors as well as the intricacies of international supply chains and the need to account for trip-chaining behavior of commercial truck drivers in urban areas presented complexities for which they needed innovative data models.
Approach
The MDOT SHA, BRTB, and BMC had worked together, in recent years, to advance their collective transportation modeling capabilities. Building on this partnership, the group developed an operational behavior-based freight model sensitive to both long-distance freight flows as well as short-distance urban truck tours. The group designed the model to be responsive to different performance measures and policy questions MDOT SHA (statewide) and BMC (regional) could have, and built it with a modular design allowing flexibility for a range of data, analysis, and integration needs.
Outcomes
The resulting product now provides transportation planners and decisionmakers in Maryland access to one of the most advanced freight modeling tools in the United States. The new model is multi-modal and describes the national supply chain as well as regional truck touring and commercial vehicle activity from the service sector in the State. During its development, all data used was collected, reviewed, and inventoried with other relevant documents and information in a single location, facilitating current access and future model updates. Finally, the project team developed a five-year plan for deploying and improving the model.
Integration Into Business Practices
The new model will be integrated in statewide and regional transportation planning processes in several ways. It provides planners with the ability to conduct new and more detailed analyses, with model outputs that are designed to be used in several areas, including: bottleneck analysis, impact of trucks on roadway capacity, temporal analysis of truck trips, and project prioritization. In addition, the 5-year plan for the model provides a number of action items and relevant approaches for the use, maintenance, and improvement of the model.
Introduction
Background
The Baltimore region contains many major freight facilities serving all modes, including the nation's sixth largest port, the Port of Baltimore, two Class I and three regional railroads, as well as the Baltimore/ Washington International Thurgood Marshall Airport. Situated at the midpoint on the eastern seaboard, the heavily congested Baltimore-Washington region, has an extensive roadway and highway network, but dense urban development offers limited infrastructure expansion options. Therefore it is critical for planners at the Maryland Department of Transportation State Highway Administration (MDOT SHA), Baltimore Region Transportation Board (BRTB), and their partners to understand how freight is moving into, out of, and within the region.
In support of the BRTB, transportation modelers from the Baltimore Metropolitan Council (BMC) and MDOT SHA had collaborated on approaches to integrate statewide and urban freight modeling. One such approach was the development of a multilevel behavior-based freight demand model.
Changes in shipping patterns driven by advances in logistics platforms and increases in shipment volumes are limiting the accuracy of traditional freight modeling methodologies. Further, traditional data sources are not providing the level of detail required to accurately depict freight shipment behavior. In recent years, the state of the practice for passenger demand modeling has advanced toward activity-based modeling; however, the state of the practice for freight demand modeling had been relatively unchanged over the same timeframe.
Several challenges limit the accuracy of traditional freight models. Typically, these models are aggregated models that do not provide much ability for sensitivity testing with regard to fine-grain changes, such as specific economic drivers or different land use scenarios. These traditional freight models are often limited to goods shipped via truck and do not account for the multi-modal aspect of supply chains. Finally, many traditional freight models do not address regional or international supply chains, and if they do, these supply chains are limited only to simple scenarios. Without accurate or reliable tools or methods, transportation planners at State Departments of Transportation, metropolitan planning organizations (MPOs), and the private sector will struggle to make sound decisions on a variety of issues in the vitally important realm of freight transportation. One approach to overcoming the limitation of traditional freight models is to develop behavior-based freight demand models.
To support the development of a new freight model, MDOT SHA and BMC jointly applied for and were awarded SHRP2 C20 implementation assistance. This allowed the group to develop an operational behavior-based freight model sensitive to both long-distance freight flows as well as short-distance urban truck tours.
Project Team
Table 1 describes the various partners and their roles on this project.
| Project Partner | Role |
|---|---|
| Maryland Department of Transportation State Highway Administration | Led overall project management. |
| Baltimore Metropolitan Council | Oversaw project consultant. |
| Baltimore Regional Transportation Board Freight Movement Task Force | Provided stakeholder input. |
| Federal Highway Administration | Provided coordination support as well as technical and administrative guidance. |
Objectives
While the end goal of this project was to develop and implement an operational behavior-based freight model, the product would need to meet a number of criteria to be useful for both MDOT SHA and BMC. Together, MDOT SHA and BMC determined that the new model needed to support decisionmaking by MDOT SHA (statewide) and BMC (regional), be sensitive to different performance measures and policy questions each agency might have, and be designed and built modularly to allow flexibility for different data, analysis, and integration needs.
Before the project began, the two agencies had developed a cooperative and coordinated effort, sharing enhancements and methods, processes and assumptions, and inputs and output to inform regional and statewide modeling platforms. The two agencies also determined that the project would deliver both hands-on training and increased staff capacity in freight modeling, as well as a documented plan to guide the agencies in the initial years of use, in order to ensure the model's success.
Process
Project Management
This project was led by MDOT SHA and BMC, in partnership. MDOT SHA led overall project management activities while the BMC oversaw the specific activities led by the consultant. The project team selected a consultant with national freight modeling experience to lead model development. Bi-weekly project meetings allowed the project team to review progress, discuss technical issues, review output and recent findings, and discuss upcoming activities.
Project Implementation
The sections below discuss major project components as well as related activities the project team completed to develop, test, and implement a behavior-based freight model. It should be noted that this case study provides only a brief overview of the most significant activities. The development of any behavior-based freight model involves many tasks, including thorough testing, calibration, and validation.
Data Identification and Collection
The consultant selected for this project leveraged significant experience developing similar models for other transportation agencies in developing the Baltimore/Maryland model. First, the project team identified important data sources that other agencies had used as input for behavior-based freight modeling. While some were publicly available with nationwide coverage (e.g., Commodity Flow Survey data), other sources were not (e.g., truck counts).
The publicly available datasets make up a significant portion of those used by the project team. Data in this category included network, freight flow (both Commodity Flow Survey data and Freight Analysis Framework 4 data), economic, and employment figures.
The project team also obtained and input local data to calibrate and validate the model. Examples include highway networks, truck GPS data, truck traffic counts, and freight facility locations.
This project did not include collecting behavior data, which, in this context, describes truck driver routing and delivery activity. These data can be collected a number of ways, including driver or truck intercept surveys, among others. The project team worked, instead, with the Ohio Department of Transportation to obtain the 2006 Ohio General Establishment Survey (OGES) data. The project team viewed OGES data as the best available source of truck driver diary data, and it included a good representation of non-freight commercial movements as well as light and medium vehicles.
A stakeholder workshop was among the first steps of the project. The workshop focused on outreach to modelers and potential users of model results. Stakeholders included representatives from: BMC, United Parcel Service (UPS), Federal Highway Administration, Maryland Department of Transportation SHA, Maryland Port Administration, Baltimore City Department of Transportation, Baltimore County Office of Economic Development, Norfolk Southern Corporation, CSX Railroad, and Brookings Institute.
Model Design
Soon after kick off, the project team tapped into the regional freight advisory committee and convened a workshop that gathered a wide range of stakeholders, from both the public and private sectors. Together, they discussed issues, objectives, and priorities for the freight model, from which several themes emerged. The model needed to:
- Demonstrate the connectivity of the region to the nation and world.
- Facilitate linking transportation investments to economic development.
- Support decisionmaking activities on a range of topics (e.g., planning, operations, maintenance).
The model provides three levels of geographic coverage: urban shipments within the BMC's region, shipments across the State, and shipments into or out of Maryland to or from the rest of the world. The model estimates all major freight modes (truck, rail, water, and air). For goods moved by truck, the model includes light, medium, and heavy-duty vehicles.
To accomplish this ambitious agenda, the project team designed the new model to be integrated with two existing passenger demand models: the Maryland Statewide Model (MSTM) and BMC's regional model (InSITE). The overall model design, components, and integration between the MSTM and InSITE are shown in Figure 1.
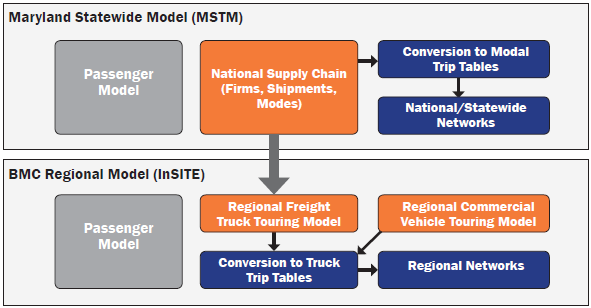
Source: Resource Systems Group, Inc.
Figure 1. Diagram. Overall model design.
To develop the new behavior-based freight demand model, the project team was able to build off existing work. The regional commercial vehicle touring model was developed specifically for the Baltimore region.
National Supply Chain Model
The supply chain model consists of several steps beginning with developing a list of businesses both within and outside of the model's study area. Suppliers and buyers are then connected based on supplier production and buyer consumption. Commodity flows are distributed among the pairs and a determination is made whether or not the shipments are direct or if they require intermediate handling (e.g., a distribution center). With the shipment path identified, the model next calculates the shipment size and the frequency of shipments between each buyer and supplier pair. Next, the shipment mode for each leg of the trip is determined. Finally, the trip is assigned to the multimodal network.
Table 2 summarizes the steps involved in developing the supply chain model.
| Step | Description |
|---|---|
| 1. Firm Synthesis | Produce a list of all firms (i.e., buyers and supplier) within the United States as well as a sample of international firms. |
| 2. Suppler Firm Selection | Match buyer firms with supplier firms based on commodity produced and consumed. |
| 3. Goods Demand | Estimate the annual commodity demand in tonnage between each buyer and supplier pair. |
| 4. Firm Allocation | Allocate appropriate firms to the traffic analysis zone within the study region. |
| 5. Distribution Channels | Estimate how goods are shipped between each buyer and supplier (e.g., shipped directly, shipped through a distribution center). |
| 6. Shipment Size and Frequency | Convert total tonnage shipped between buyer and supplier to discrete shipments. |
| 7. Modes and Transfers | Estimate the travel mode for each leg of the shipment as well as any applicable transfer locations. |
| 8. Trip Assignment | Assign shipments to the multimodal network and any applicable transfer centers (e.g., a distribution center). |
Truck Touring Model
This tool estimates the truck activity within the model's region. Direct shipments, defined as shipments without intermediate handling, are modeled as out-and-back trips. Shipments involving a distribution center are modeled as truck tours to simulate actual pickup and delivery activity within the region. For each truck tour simulated, departure and arrival times are estimated as well as the need for any intermediate stops (e.g., a meal). The Maryland implementation of this model improved previous truck touring models by adding the steps required to estimate intermediate stops along a truck tour.
Table 3 summarizes the specific steps involved in developing this model.
| Step | Description |
|---|---|
| 1. Ports of Entry/Exit | Determine how and where the shipment entered the truck touring model's region. |
| 2. Vehicle Choice and Tour Pattern | From the port of entry, determine tour pattern (e.g., direct to destination, truck tour) as well as vehicle class (e.g., heavy truck). |
| 3. Stop Clustering | Shipments delivered on a truck tour are grouped. |
| 4. Arrive Time at First Stop | Estimate delivery time for the first stop on the tour. |
| 5. Routing Sequence | Sequence stops using the "Traveling Salesman" algorithm1 on travel time combinations. |
Commercial Services Touring Model
The third major component of the behavior-based model is the regional commercial vehicle touring model. The purpose of this model is to estimate truck trips due to non-freight commercial vehicles (e.g., construction vehicles). This model uses design concepts and model components similar to the truck touring model, with tweaks to vehicle type and stop duration based on industry, trip distance, and stop purpose. The model was developed specifically for the Maryland implementation and had not been previously attempted in other States.
While much of the design between the truck touring model and the regional commercial vehicle touring model is similar, there are several important differences. With regard to vehicle classes estimated in each model, the truck touring model focuses on medium and heavy vehicles while the commercial vehicle touring model also includes light duty vehicles. All of the trips estimated in the truck touring model involve a shipment delivered to a business, whereas the commercial vehicle touring model includes service stops to businesses as well as deliveries to residences. Finally, the truck touring model is connected to external demand (i.e., the national supply chain model), but the commercial vehicle touring model is not influenced by that factor.
Model Integration
The new model was developed and its various components integrated using the R programming language, an open source language commonly used for statistical and data analysis. The functions and scripts that comprise the model have been compiled into a single package called "rFreight". While the model developed in this project has been tailored for MDOT SHA and BMC, rFreight is the basis of freight models in use by other States and metropolitan planning organizations. As discussed below in the Freight Model System Plan, this commonly used platform allows improvements requested or made by one user to be available to all other users. Figure 2 illustrates the model's software structure.
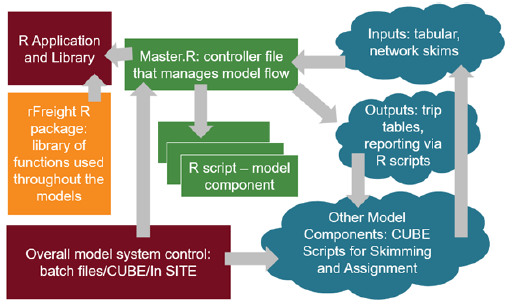
Source: Resource Systems Group, Inc.
Figure 2. Diagram. Software structure.
Capacity Building
The project included activities to build MDOT SHA and BMC staff capabilities for using the new product. The project team spent time introducing staff and stakeholders to the products, provided on-site training, and developed a guide for activities MDOT SHA and BMC should consider throughout the first five years of model use. On-site training activities provided both high-level information and outcomes for program stakeholders and detailed, technical training with work examples for the technical staff. Topics discussed during the technical training sessions included:
- Model installation and operation.
- Model structure.
- Model performance.
- Running scenarios.
- Recommended next steps.
Freight Model System Plan
The project team helped ensure the success of the new model by developing a guide providing recommendations for the first five years of model use. Called the Freight Model System Plan, it focused on four topics: application code maintenance, validation and model input data collection, behavioral data collection, and supply chain economic sensitivity enhancements.
Data used for the new model typically includes publicly available information or data already accessible by the project team. To improve the model, the project team will consider acquiring new or updated data for calibration and validation. The truck probe data available for model calibration is known to focus on long-distance freight shipments and may not represent well the medium and light duty vehicles used for urban goods movement in the region. Acquiring that data, specific to the region, will improve the model's accuracy. Other data sources, such as the FAF and CFS, are updated regularly and should be incorporated into the model as they become available.
An evaluation is recommended on the behavioral properties of the model to determine if the project team needs to collect new data to replace the current behavioral data that was obtained from the Ohio Department of Transportation. The guide details several options for collecting behavioral data, including establishment-based truck driver diary surveys, a smartphone application, anonymized GPS data, and origin-destination surveys.
The model developed as part of this project can provide limited insight into how different economic scenarios affect freight movement within the region. The project team will consider implementing supply chain economic sensitivity enhancements to better understand how different scenarios or economic stimuli can change commodity flows in Maryland. While a number of enhancements may be implemented, both simple (pivot-point method1) and sophisticated (procurement market simulation models2) options are proposed for the project team's consideration.
Outcomes
Project Benefits
The project team successfully developed a behavior-based freight demand model that is integrated with the State and MPO's passenger demand models. True benefits resulting from this project, however, are the improvements to planning and decisionmaking.
The new model can provide insight into supply chain decisions, including distribution channels, models, and shipment sizes. This allows planners to get a better understanding of potential mode shifts due to different scenarios, such as the development of a new regional distribution center. Given the presence of a major airport and seaports in Maryland, changes to the levels of imports and exports can be accounted for to show changes in truck traffic near airports, seaports, and railyards.
The new model is a disaggregate model where information on vehicle movement is captured on the micro-level (e.g., individual truck movements). This type of model is an improvement over an aggregate model where findings are compiled to the study area (e.g., total number of truck movements). In addition, the new model has commodity information attributed to the individual vehicle movements so that planners can better understand transportation system performance related to commodity movement. Detailing commodity movements allows MDOT SHA and BMC to understand the freight transportation network through activities such as identifying high-value commodity corridors or determining what commodities are most affected by (or contributing to) bottlenecks.
Understanding truck touring behavior, both spatially and temporally, provides MDOT SHA and BMC with the ability to ask many different questions and investigate a variety of scenarios. For example, impacts due to tolling or other policies can be investigated. Activities such as bridge maintenance can be prioritized because vehicle type and estimated loads are calculated by time of day. Also, model scenarios can be developed to support project prioritization. The model incorporates all commercial vehicle movements, including those truck movements from non-freight service providers, which is a significant enhancement over similar models. This information will allow MDOT SHA and BMC to better understand truck impacts on congestion in the region.
Transferability of the Project
While many of the project activities sought to tailor the model to Maryland, other States and MPOs are now using the core model developed. Agencies can replicate activities completed within this project to tailor and implement a similar behavior-based freight demand model as long as they have or can obtain the data required to calibrate and validate it.
The core code for the new model is used by several other States and MPOs around the country. An online repository has been established where model users and designated stakeholders can collaborate to maintain and improve the model code, helping ensure consistency and efficient updates. The repository is used to report software bugs and their fixes and allows users to download the latest version of the model code. Because all users are linked to a central repository, any software fixes or added functionality requested by one agency can be downloaded and used by another. Action steps for application code maintenance steps involve inviting staff to become active users in the online repository, which includes regularly reporting bugs and requesting model enhancements.
Lessons Learned
The project team identified a number of lessons learned as a result of this project, including the following:
- Consolidate data and knowledge in a single location. Activities can be streamlined by creating, at the beginning of the project, a package that consolidates local modeling data, knowledge, and insight into a single location. That occurred by the end of this project, producing a documented, organized set of shared folders containing data, GIS files, analysis outputs, and scripts. The package then becomes a useful resource that can accompany the model and facilitate future updates.
- Maintain open communication. Open communication is critical for complex projects such as this. Bi-weekly meetings held by the project team kept all stakeholders updated on progress and helped quickly identify and address potential issues. Since external dependencies can be expected to affect the project's schedule, open communication will allow all team members to understand these changes.
- Do not neglect training and capacity building as part of the project scope. The project team used a consultant to develop the new model, so it was important to deliver training on the model as well to provide model documentation and a guide for future improvements. These materials increase the likelihood of long-term use, maintenance, and improvement to the model.
Next Steps
The Freight Model System Plan informed a menu of potential activities for consideration by MDOT SHA and BMC over the first five years of model use. In addition, the project team has already identified several new activities for which they hope to use the model in the near-future. These include:
- The project team first seeks to become more familiar with the model and its capabilities. The team intends to run scenarios to gauge the model's sensitivity to local and State freight issues based on feedback from local freight stakeholders. The project team also intends to develop additional documentation, including a report on the model's capabilities.
- Because the model was developed in a modular fashion, MDOT SHA and BMC have the flexibility to integrate it with other models. Integration with the regional and statewide passenger demand models was completed under this project. As a future step, the team intends to integrate it with the U.S. Environmental Protection Agency's Motor Vehicle Emission Simulator (MOVES) 2014 model.
- Lastly, the model will be used to conduct analysis in several areas including bottleneck evaluation, the impact of trucks on roadway capacity, temporal analysis of truck trips, and project prioritization.
Conclusion
MDOT SHA and BMC combined forces to complete this project and move their capabilities to the forefront of advanced freight modeling in the U.S. Key outputs of this project include a multilevel, behavior-based freight demand model, a comprehensive package of data and supporting documentation, and a five-year plan for using and improving the model.
The new model includes several state-of-the-art components (national supply chain model, regional freight trucking touring model, and regional commercial vehicle touring model), allowing MDOT SHA and BMC to estimate freight shipments both at the aggregate (e.g., tons shipped per year) and disaggregate (e.g., specific commodity shipments by location and time of day) levels. This information opens a number of possibilities for model use, including planning, project prioritization, policy analysis, and environmental analysis.
Through the development process, the project team was able to collect and consolidate all related information in a documented and organized set of shared folders. These folders include data used to develop the model, GIS data, model scripts, analysis output, and other pertinent detail that will greatly assist MDOT SHA and BMC in using and updating the model in the years ahead.
Finally, the Freight Model System Plan developed for this project will serve as a five-year guide informing development and use of the model. This helps the project team ensure that the model can stay at the forefront of research in the coming years and lays out several potential approaches for addressing the action items the plan identifies.
Product Information
Product Title: SHRP2 C20: Behavior-Based Freight Demand Model
Agency Name: Maryland Department of Transportation State Highway Administration
Contact Information:
Name: Subrat Mahapatra
E-mail: smahapatra@sha.state.md.us
Phone: 410-545-5649
Agency Name: Baltimore Metropolitan Council
Contact Information:
Name: Brian Ryder
E-mail: bryder@baltometro.org
Phone: 410-732-0500, ext. 1054
Resources
This section includes resources and related project documentation.
Technical Documentation
Baltimore Metropolitan Council and the Maryland Department of Transportation State Highway Administration (2017). Freight and Commercial Vehicle Model Development (Final Report). Baltimore, MD.
1 Calculations used in financial markets to estimate ranges for price movements. [ Return to note 1. ]
2 Models to estimate buyer-supplier matching by incorporating various market conditions, such as regional competitiveness. [ Return to note 2. ]

The second Strategic Highway Research Program (SHRP2) is a partnership of the Federal Highway Administration (FHWA), the American Association of State Highway and Transportation Officials (AASHTO), and the Transportation Research Board (TRB). TRB completed the research, and now FHWA and AASHTO are jointly implementing the resulting SHRP2 Solutions that will help the transportation community enhance productivity, boost efficiency, increase safety, and improve the reliability of the Nation's highway system.
FOR MORE INFORMATION
Subrat Mahapatra
Chief, Innovative Performance
Planning Division
Maryland Department of Transportation
State Highway Administration
Phone: 410-545-5649
E-mail: smahapatra@sha.state.md.us
Brian Ryder
Transportation Planner
Baltimore Metropolitan Council
Phone: 410-732-0500, ext. 1054
E-mail: bryder@baltometro.org
Jeffrey Purdy
Federal Highway Administration
Office of Freight Management and Operations
Phone: 202-366-6993
E-mail: Jeffrey.Purdy@dot.gov
Learn more about the SHRP2 program, its Capacity focus area, and Freight Demand Modeling and Data Improvement (C20) products at www.fhwa.dot.gov/GoSHRP2/
STRATEGIC HIGHWAY RESEARCH PROGRAM
U.S. Department of Transportation Federal Highway Administration
American Association of State Highway and Transportation Officials – Transportation Research Board