Behavioral/Agent-Based Supply Chain Modeling Research Synthesis: Model ApplicationsPrintable Version [PDF 1.8 MB]
U.S. Department of Transportation FHWA-HOP-18-007 March 2018 BACKGROUND AND CHALLENGEBehavioral supply chain models can be used for myriad policy applications. These are dependent upon the specific components that are included and can be categorized into two main types of modeling systems: 1) national supply chain models; and 2) regional truck touring models. POLICY ANALYSESThe national supply chain models include the firm synthesis, allocation of freight demand, and transportation logistics chain components and can support the following policy analyses:
Regional truck touring models can address regional impacts for the following policy analyses:
PERFORMANCE MEASURESFreight-related performance measures are linked with economic impacts of freight and are used for policy analyses. These performance measures are often used by agencies to compare scenarios and to evaluate and prioritize policy goals. Freight-related performance measures are often segmented by commodity group and mode. Shares by mode or market is another means to evaluate commodity flows across different scenarios or geographies using a normalized measure. The following performance measures are used to quantify commodity flows:
Travel time is an important attribute for any freight model; this attribute is also an important means of measuring the performance of the system. Since this is both an input to the system and a measure of performance, it is important to validate travel times against observed data before relying on the performance measures. Typically, these travel times represent an average daily travel time, but these may also be reported by time of day. There are several ways to report travel times for freight:
Advanced freight models that include behavioral or agent-based supply chain methods represent trips as segments of a long-distance supply chain. Such models may also represent the pick-up and delivery system to deliver goods for the last portion of the supply chain. Once the supply chain has been established, each segment is identified as a trip with a specific origin and destination. These trips can be reported by commodity group, mode, and aggregation of zones (i.e., districts or counties) and can be for annual or daily time periods. Truck trips are segmented further by truck type, time of day, and user class—typically for daily time periods. Pick-up and delivery systems for truck travel within a study area can also be reported as stops per tour, tour length, stop duration, and other tour statistics, also typically for daily time periods. An important performance measure for highway planners is average daily truck volumes, reported by road segment, screenline, or facility type. Truck volumes can also be summarized by geography (i.e., district or area type). Truck volumes are typically not segmented by commodity group, but if an agency was interested in this performance metric, then it could be developed by assigning truck trips for a single commodity group or by assigning several commodity groups using a multiclass assignment technique. In addition to the performance measures considered in modeling, there are also performance measures related to the operation of highways, including: travel time index, planning time index, buffer index, average hours of delay for freight vehicles, and safety measures. Table 1 summarizes the performance measures sorted by type.
The public sector primarily utilizes performance measures to quantitatively assess progress toward agency goals. Though there are several performance measures, most typically fall into the following categories:3 Transportation System Performance (efficiency and reliability), Safety, Environmental Sustainability, Economic Indices, and System Preservation. Important components of performance management are longitudinal measurements and trends analysis. An agency may determine that additional investment or a policy change is required based on positive or negative changes in an individual measure over time. For example, an agency may decide to invest in highway improvements in situations where highway infrastructure is demonstrated by a performance measure to be either degraded or inefficient in terms of operations. Private sector performance measures typically fall into one of the following categories: Operations, Financial, or Safety. Additional variation in private sector performance measures is introduced by different business models or financial practices, such as perload or per-mile compensation metrics. Click to enlarge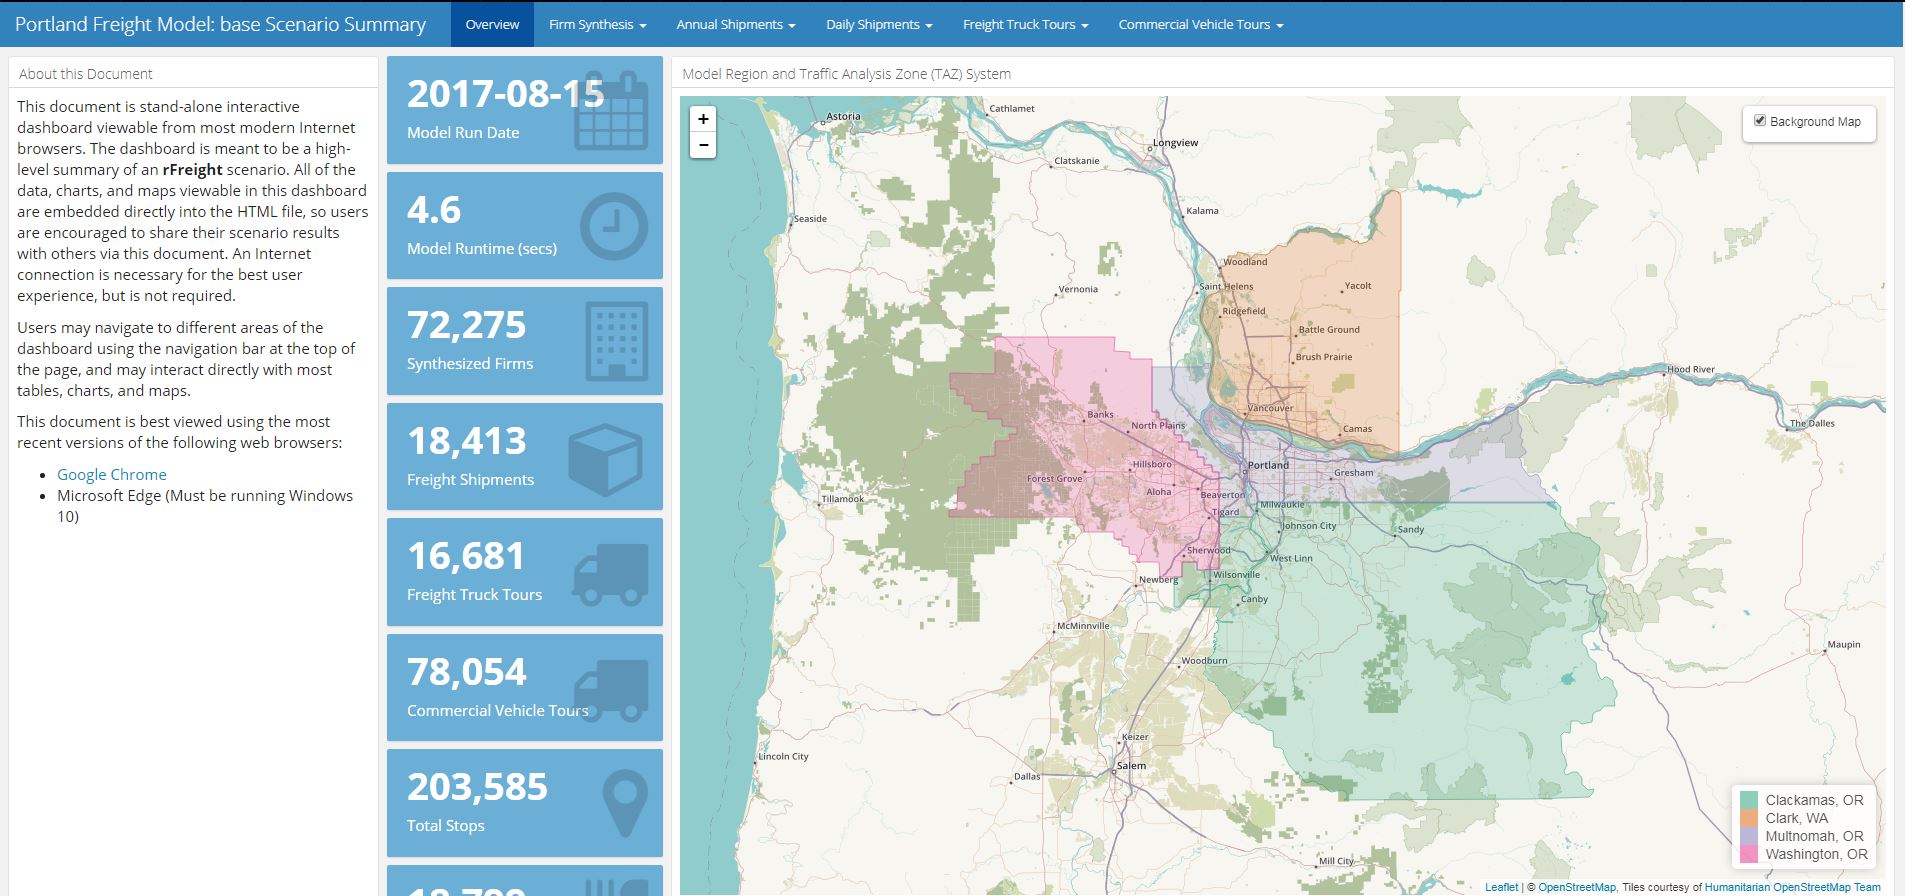
Figure 1. Behavioral Supply Chain Modeling Process. Some behavioral supply chain freight models include a dashboard of model outputs to visualize performance. The dashboard displays charts, maps, tables, and graphs that summarize a model run based on the model output file. It can also display model data alongside other model runs or the reference datasets to show the performance measures of different scenarios modeled. Figure 1 above shows a snapshot of the Metro’s freight model dashboard. FOR MORE INFORMATION
Learn more about the SHRP2 program, its Capacity focus area, and Freight Demand Modeling and Data Improvement (C20) products at www.fhwa.dot.gov/GoSHRP2/
1 External refers to the segment of the freight movements that have some portion of the movement outside the study area but travel through, into, or out of the study area. [Return to Note 1] | |||||||||||||||||||||||||||||||||||||||||||||||||||||||
|
United States Department of Transportation - Federal Highway Administration |
||

 The second Strategic Highway Research Program is a national partnership of key transportation organizations: the Federal Highway Administration, the American Association of State Highway and Transportation Officials, and the Transportation Research Board. Together, these partners conduct research and deploy products that help the transportation community enhance the productivity, boost the efficiency, increase the safety, and improve the reliability of the Nation’s highway system.