The Cost of Congestion: An Innovative Approach to Utilizing Waybill Data to Support Freight Transportation Planning and Analysis
Printable Version [PDF, 534 KB]
You may need the Adobe® Reader® to view the PDFs on this page.
Contact Information: Freight Feedback at FreightFeedback@dot.gov

U.S. Department of Transportation
Federal Highway Administration
Office of Operations
1200 New Jersey Avenue, SE
Washington, DC 20590
FHWA-HOP-17-013
August 2017
BACKGROUND AND CHALLENGES
Recipient Agency: Mid-America Regional Council
Location: Kansas and Missouri
Duration of Activity: 2014 to 2016
Budget: $150,000 plus $39,800 contributed by MARC
Like a typical commuter building buffer time into daily travel to account for congestion and ensure on-time arrival, a similar buffer is often planned for goods shipped by truck over the highway. Unlike the individual commuting to an office, however, the freight carrier incurs labor, fuel, equipment and lost productivity costs when a shipment is stuck in traffic. That cost is either passed on to the consumer or absorbed by the freight carrier.
The Mid-America Regional Council (MARC), the metropolitan planning organization (MPO) for the Kansas City area, sought to overcome traditional challenges in calculating the cost of such delay. MARC was awarded SHRP2 C20 research assistance to explore innovative approaches to utilizing data to better understand the cost of congestion for freight. In the past, research was hampered by the needs of shippers and carriers to consider cost data proprietary in order to maintain a competitive edge in an industry with slim margins. Fortunately, the availability of new datasets, such as the Federal Highway Administration's (FHWA) National Performance Management Research Data Set (NPMRDS) and the Real-time Freight Intelligence (RTFI) commercial freight waybill dataset, now allow researchers to begin the work of calculating the true cost of congestion.
APPROACH
MARC's project used a combination of existing data and new sources of commercial waybill data to address future freight planning needs by establishing methods to demonstrate the impact of congestion on the cost of freight movement. The project:
- Developed an analytical approach to identifying common commodities and shipment routes originating in the MARC region.
- Extracted pertinent information from the freight waybill data.
- Calculated performance measures for selected shipment routes to increase understanding of how highway congestion affects shipment costs.
| Objective | Work Approach | Outcomes |
|---|---|---|
| Identify study area. | Identify major freight activity generators in the region. | A defined area to and from which shipments can be tracked. |
| Identify commodities and origin/ destination pairs for analysis. | Review the freight waybill dataset to identify clusters of locations to and from which similar commodities are shipped. | Eight origin/destination pairs were used calculate shipment costs. |
| Measure performance. | Analyze the NPMRDS data to calculate highway performance between the select origins and destinations. | Measures of performance on selected routes. |
| Draw conclusions. | Determine correlation between cost profiles and performance indexes. | Correlations, if present, between shipment costs and highway performance. |
BENEFITS AND IMPACTS
Key elements that contributed to project outcomes and subsequent impacts include:
- A project team with a strong understanding of the logistics industry.
- Availability of commercial freight waybill data and highway performance data.
- Advanced analytical tools to analyze highway performance data.
Key accomplishments by the project include:
- Insight into major commodities and trade patterns to and from the MARC region.
- An understanding of correlations between congestion and shipment costs.
- Recommendations on next steps to identify and prioritize projects addressing congestion and reducing freight costs.
Benefits
Benefits realized from this project include the ongoing use of the resources it created as well as the changes it may influence in stakeholder behavior. Specific outcomes are listed below:
| Outcome | Evidence |
|---|---|
| New analytical approach. | Project collected and evaluated new sources of data specific to freight movements from the MARC region and developed an analytic process to correlate shipment costs to congestion and other influencing factors. |
| Documented successful practices for analyzing output of the NPMRDS. | The project team documented an approach to analyze large amounts of NPMRDS data. Lessons learned from this project will assist other transportation agencies interested in using NPMRDS data. |
Impacts
| Impact | Application |
|---|---|
| Progress toward a behavior-based freight model. | The development of petroleum-related trip chains during this project represent a critical step in developing a behavior-based freight model. |
| Identification of data gaps. | The project team identified data gaps in describing the petroleum supply and demand chain as well as during the testing of new technologies. By addressing these data gaps, future activities using methodologies developed in this project will provide more detailed insight into petroleum shipments in the region. |
| Documentation and assessment of vehicle detection technologies. | This project provided a wealth of documentation on existing and emerging vehicle detection technologies. While the project team researched emerging technologies to identify, classify, and track vehicles with fuel tanker trucks and tanker rail cars as the target vehicle types, findings from this project are applicable to multiple vehicles types and are useful to any State or local transportation agency interested in using automated data collection technologies. |
Outcomes also include insights into the use of data. The project team documented several approaches to calculate cost profiles and measure performance for each of the 16 freight routes (i.e., eight analysis pairs). An example of the analysis output for automobile manufacturing products being shipped from the MARC region to both Detroit, Michigan and Cleveland, Ohio is shown in Table 1.
| Category | Measure | Destination | Percent Difference | |
|---|---|---|---|---|
| Detroit, Michigan | Cleveland, Ohio | |||
| Cost | Average cost per ton. | $178.80 | $114.60 | 35.90% |
| Median cost per ton. | $164.43 | $111.96 | 31.90% | |
| Percent difference: average vs. median. | 8.73% | 2.36% | Not applicable | |
| Average cost per ton-mile. | $0.25 | $0.15 | 39.30% | |
| Median cost per ton-mile. | $0.23 | $0.15 | 37.80% | |
| Percent difference: average vs. median. | 4.93% | 2.36% | Not applicable | |
| Performance | Buffer index. | 0.24 | 0.19 | 19.90% |
| Planning time index. | 1.36 | 1.3 | 4.20% | |
| Travel time index. | 1.17 | 1.16 | 1.30% | |
| Average travel time (minutes). | 732.6 | 804.1 | Not applicable | |
| Average travel speed (miles per hour) | 58.69 | 59.49 | -1.40% | |
| Distance | Trip distance (miles) | 710 | 800 | Not applicable |
To draw conclusions, the project team collated and compared the median cost per ton-mile (CPTM), planning time index, and travel time index (Figure 1). This analysis yielded a correlation in which the analysis pairs with a higher planning time index and travel time index had a higher median CPTM. Two of the eight analysis pairs deviated from this trend; removing these pairs produced a correlation of 0.845 between CPTM and planning time index and 0.891 between CPTM and travel time index.
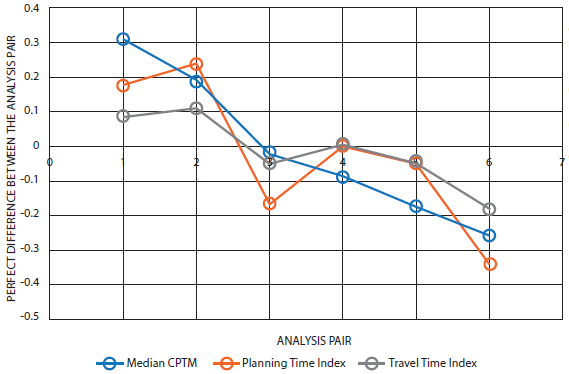
Figure 1. Comparison of shipment cost differences to network performance differences among similar shipments, large discrepancies removed.1
Source: Parsons Transportation Group
Impacts
Impact measures are the ultimate benefits of using a product. These are longer-term, value-added impacts of the product related to saving time, money, and lives.
| Impact | Application |
|---|---|
| Improvement in the current body of research. | This project added to the current body of research by developing a novel, yet replicable, approach to documenting the way congestion influences freight shipment costs. |
| Foundation established for further research. | With further development, the analytical approach may assist future freight transportation planning by supporting the justification and prioritization of capacity improvement projects that maximize benefits to freight and related industries. |
PARTNERSHIPS
MARC – Provided project management and coordination. Will integrate findings into planning process.
University of Maryland Center for Advanced Transportation Technology – Provided access to advanced analytical tools to process NPMRDS data
Federal Highway Administration (FHWA) – Provided coordination support as well as technical and administrative guidance.
1 Parsons Transportation Group (2016). Freight Data Integration in the MARC Region. [ Return to note 1. ]
FOR MORE INFORMATION
Darryl Fields
Senior Transportation Planner
Mid-America Regional Council
Phone: 816-474-4240
E-mail: dfields@marc.com
Jeffrey Purdy
FHWA - Office of Freight Management and Operations
Phone: 202-366-6993
E-mail: Jeffrey.Purdy@dot.gov
Learn more about the SHRP2 program, its Capacity focus area, and Freight Demand Modeling and Data Improvement (C20) products at www.fhwa.dot.gov/GoSHRP2/

The second Strategic Highway Research Program (SHRP2) is a partnership of the Federal Highway Administration (FHWA), the American Association of State Highway and Transportation Officials (AASHTO), and the Transportation Research Board (TRB). TRB completed the research, and now FHWA and AASHTO are jointly implementing the resulting SHRP2 Solutions that will help the transportation community enhance productivity, boost efficiency, increase safety, and improve the reliability of the Nation's highway system.
STRATEGIC HIGHWAY RESEARCH PROGRAM
U.S. Department of Transportation Federal Highway Administration
American Association of State Highway and Transportation Officials – Transportation Research Board