Dynamic Data Fusion: Mining Private Sector Relationships and Public Databases to Enhance and Predict Freight Movement
Printable Version [PDF, 2.2 MB]
You may need the Adobe® Reader® to view the PDFs on this page.
Contact Information: Freight Feedback at FreightFeedback@dot.gov

U.S. Department of Transportation
Federal Highway Administration
Office of Operations
1200 New Jersey Avenue, SE
Washington, DC 20590
FHWA-HOP-17-011
August 2017
Freight Demand Modeling and Data Improvement Implementation Support
Table of Contents
Executive Summary
Challenges
Freight data collection is often fragmented and uncoordinated with plans for long-term maintenance often not well defined. As a result, data standards can vary greatly across freight data sources, making it difficult to integrate available data. Further, while in recent years Federal agencies have been making national freight datasets available to the public, the data are typically not available on the sub-regional scale needed for effective local freight planning.
Approach
Located in Albany, New York, the Capital District Transportation Committee (CDTC) is the designated metropolitan planning organization (MPO) for the Albany-Schenectady-Troy, New York metropolitan area. Surrounded by major highway, rail, and maritime routes, this region serves as a transportation crossroads to many industries and is home to several major freight generators. To assist in acquiring data to support its freight planning activities, CDTC assembled a project team and developed a process to effectively collect, integrate, and maintain freight-related data from multiple sources, including innovative, easily obtainable private data and commonly used public databases. The project team identified existing freight data at the national, State, and local levels, and it designed and conducted data collection activities to obtain new freight data for the CDTC region. This process involved a significant coordination effort among freight stakeholders in the region and helped build relationships with these stakeholders.
Outcomes
A significant outcome of this project for CDTC is the development of a dynamic freight database. This database serves as a central location to house freight-related data for CDTC that the agency can use for future planning activities. A major positive benefit of this project is the availability of processed data that is readily usable for any level of aggregation. In addition to the newly compiled data, outcomes of this project include calibrated models that could be used to estimate the freight flows (trips, generation, and services) at the ZIP code level as well as improved relationships with freight stakeholders in the region that could lead to new data sources and better data sharing.
Integration Into Business Practices
Data made available through this project better positions CDTC to plan for freight. As an example, data compiled during this project supported the development of CDTC's Freight Plan.
Introduction
Background
Standards, formats, and processes for collecting, storing, using, and updating freight data typically vary across transportation agencies. These processes are often fragmented and uncoordinated with longterm plans for maintaining the data not well defined. As a result, different freight datasets often have different spatial and temporal resolutions as well as different standards making it difficult to establish relational connections between them. To this end, there has been a recent emphasis on standardizing and developing freight data from the Federal level. The United States Department of Transportation (USDOT) provides several national-level freight datasets. However, these are typically at a large geographic scale and do not do not disaggregate the data down to the sub-regional scale needed for effective local freight planning.
Located in Albany, New York, the Capital District Transportation Committee (CDTC) is the designated metropolitan planning organization (MPO) for the Albany-Schenectady-Troy, New York metropolitan area. Surrounded by major highway, rail, and maritime routes, this region serves as a transportation crossroads to many industries and is home to several major freight generators. Given the importance of freight transportation to the region, CDTC has initiated significant freight planning activities in recent years, including a regional freight and goods movement study. The committee's intent is to integrate findings from this study into a freight element in its long-range transportation plan.
To assist in acquiring data to support CDTC's freight planning activities and overcome some of the local freight planning challenges, the committee applied for and was awarded SHRP2 C20 implementation assistance. The assistance allowed CDTC to develop a resource providing timely freight data at the subregional level so that the data can be readily used for local freight planning and decision-making.
Project Team
Led by CDTC, the core project team included a university and several data providers. A full list of project partners is shown in Table 1.
| Project Partner | Role |
|---|---|
| Capital District Transportation Committee. | Provided project management and coordination. |
| Federal Highway Administration (FHWA). | Provided coordination support as well as technical and administrative guidance. |
| New York State Department of Motor Vehicles. | Data provider. |
| New York State Department of Transportation. | Data provider. |
| New York State Office for Technology. | Data provider. |
| New York State Thruway Authority. | Data provider. |
| Rensselaer Polytechnic Institute. | Research lead. |
Objectives
The project team identified four objectives to develop the new database. Key objectives and the work approach are detailed Table 2.
| Objective | Work Approach | Outcomes |
|---|---|---|
| Identify and assess available data sources. | Conduct a scan of available data sources; identify potential new data sources. | A list of data sources for data collection. |
| Collect and refine available data. | Parse and compile existing datasets. | Cleaned and standardized version of existing freight data. |
| Collect new data. | Collaborate with regional freight stakeholders to collect new data. | New local freight datasets. |
| Process and fuse data. | Combine existing and new datasets. | New dynamic freight database. |
Process
Project Management
CDTC selected Rensselaer Polytechnic Institute (RPI) to lead the research based on their extensive experience with freight data and modeling as well as connections to the freight community in the region. Throughout the project both CDTC and RPI worked closely with the public and private stakeholders.
Project Implementation
The research approach is detailed below, with the following representing significant research activities:
- Identification of freight data sources and completion of outreach activities.
- Data collection.
- Data integration.
Identifying Freight Data Sources and Completing Outreach Activities
The disjointed nature of many existing freight datasets was one of the key drivers to this project. As such, the project team first identified a list of potential data sources to collect and compile into a single location. This list of potential data sources contained two categories of data:
- Publicly available data: These data are publicly available online.
- Data to be obtained from other agencies: These data are not publicly available online and the project team needed to coordinate with partner agencies to obtain the data.
In addition to collecting existing data, the project team sought to develop new data. The project team brought a long history of partnerships with the local freight community and used this experience to coordinate with stakeholders for data collection. First, the project team approached members of the CDTC Freight Advisory Committee. The project team also developed outreach materials describing the project (Figure 1) and distributed these materials to the New York State Motor Truck Association and the Owner Operators Independent Driver Association. Finally, the project team coordinated with several rail companies in the region to obtain travel time information to identify potential bottlenecks on the rail system.
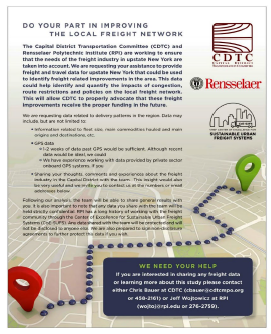
Figure 1. Image. Example of an outreach flyer distributed as part of the project.
Source: Capital District Transportation Source: Capital District Transportation Committee
Data Collection
Existing Datasets
Between those datasets collected from public sources and those collected from partner agencies, the project team compiled data from more than a dozen sources into a single master database. The datasets, geographic scope, and source are shown in Table 3.
| Dataset | Scope | Source | Description |
|---|---|---|---|
| PUBLICLY AVAILABLE DATA | |||
| Commodity Flow Survey (CFS) Data. | National | USDOT / BTS | Shipper-based survey data on freight shipped, value, weight, mode, type of commodity from origin to destination. |
| Employment data (ZIP Code Business Patterns). | National | US Bureau of Labor Statistics | Employment data contain the number of employees, their locations, wages, employment, and unemployment rates for the capital region. |
| Freight Analysis Framework Origin-Destination Data. | National | USDOT / FHWA | Data from several sources is used to estimate freight tonnage, value, and domestic ton-miles by region of origin and destination, commodity type, and mode. |
| Smart Location Data. | National | EPA | Data pertaining to housing density, diversity of land use, neighborhood design, road density, destination accessibility, transit service, employment, and demographics. |
| ACQUIRED FROM PARTNER AGENCIES | |||
| 511 NY data feed. | New York State | NYSDOT | Real time traffic and transit event information, including incidents/accidents, construction projects, special events, traffic, and transit maps. |
| Capital Region updated network data (with volume). | Capital Region | CDTC | Priority maps for bicycle and pedestrian, arterial management priority network, goods movement priority network, transit, and intelligent transportation system (ITS). |
| Census of vehicles. | New York State | USDOT | Comprehensive records of the safety performance of the motor carriers and the hazardous materials. |
| Economic data. | New York State | NYS GIS Clearinghouse | GIS shape files illustrating land use, transportation, and places of interests. |
| E-ZPass data. | New York State | NYSTA | Origin-destination data from E-ZPass electronic toll collection system in the region. |
| HERE travel time data. | New York State | FHWA | Average travel times collected by Global Positioning System (GPS) and Bluetooth equipment. |
| IHS Global Insights TRANSEARCH. | National | CDTC | Estimates of freight flows available at the state, business economic area, and county levels by commodity type and mode of transportation. |
| MIST speed and volume data. | New York State | CDTC / NYSDOT | Volume and speed on each lane of major roadways in the region. |
| Oversize/overweight permitting data. | New York State | NYSDOT | Vehicle characteristics, permitted weight, actual weight, trip origin, and trip destination from oversize/overweight permits. |
| Truck crash data. | New York State | NYSDMV | Data on truck accident events, involved vehicles, and contributing factors. |
| Truck traffic counts. | New York State | NYSDOT | Volume of truck flows on major corridors. |
| Weight-In-Motion (WIM) data. | New York State | NYSDOT | Weight, speed, direction of travel, location, average daily traffic. |
New Datasets
To collect new data, the project team identified freight stakeholders in the region and contacted these organizations in an attempt to acquire new data. During this process, meetings, both in-person and by telephone, were held to discuss project goals and needs as well as to collect the data. The project team collected three types of new data: carrier and receiver data, interview findings, and freight trip generation data.
Carrier and receiver data collected for this project was comprised of data provided by trucking businesses in the region. To collect this data, the project team signed non-disclosure agreements (NDAs) with the data providers. Data were typically Global Position System-based (GPS) records from devices already on-board the commercial vehicles. Other data formats collected from carriers and receivers in the region included delivery logs. Collecting this type of data is useful as it is often high quality and at a very fine resolution.
To get a better understanding of the business practices of freight stakeholders in the region, the project team conducted interviews with manufacturing, retail, and transportation service providers. An objective of these interviews was to better understand factors influencing transportation decisions, such as mode, route, and warehouse location. The individual interviewed at each location was a major decision-maker for the business. In addition to gaining insight into their decision-making process, an additional outcome of these interviews was to collect information about how the different businesses perceive public sector transportation policies.
To develop freight trip generation data, the project team first collected new survey data using processes described in a joint report developed under the National Cooperative Highway Research Program (NCHRP) and National Cooperative Freight Research Program (NCFRP).1 The project team collected basic information from data aggregators on 1,500 businesses in the area that produce and consume freight. Next, the team conducted 170 professional surveys to collect information about freight generation and freight trip generation in the area. Sixty-five percent of the surveys were conducted in establishments in freight-intensive sectors (e.g., construction, manufacturing, wholesale trade, retail trade, transportation and warehousing) within the region. The remainder of the surveys were conducted in establishments providing services (e.g., finance and insurance, real estate, education, health). The four topics covered by these surveys were:
- General information.
- Deliveries and shipments.
- Service trips.
- Current operations and flexibility.
The project team was able to develop several models to describe goods movement in the region, including models focused on freight generation, freight trip generation, and service trip generation.
An example linear model developed for freight trip attraction is shown in Table 4. It should be noted that the newly developed models have a low sample size because the survey data used to develop the models were collected as a small part of another project that the team was completing. The project team considers these models as a starting point that provides insight and data previously unavailable to CDTC.
| NAICS | Description | α | β | Obs. | Employment Range | ||
|---|---|---|---|---|---|---|---|
| Min. | Mean | Max. | |||||
| 23 | Construction | 2.789 | - | 9 | 4 | 16 | 40 |
| 31-33 | Manufacturing | 2.674 | 0.043 | 36 | 3 | 38 | 300 |
| 31 | Food, Beverage, Tobacco, Textile, Apparel | 3.4 | - | 5 | 6 | 51 | 175 |
| 32 | Wood, Paper, Chemical, Plastics, Nonmetals | 3.315 | - | 15 | 3 | 22 | 70 |
| 33 | Metal, Machinery, Electronic, Furniture, and Miscellaneous | - | 0.07 | 16 | 5 | 48 | 300 |
| 42 | Wholesale Trade | 3.282 | - | 29 | 2 | 12 | 53 |
| 44-45 | Retail Trade | 1.905 | 0.113 | 27 | 1 | 14 | 50 |
| 44 | Motor Vehicle, Furniture, Electronics, Clothing | 2.042 | 0.105 | 22 | 1 | 15 | 50 |
| 45 | Sporting Goods, Hobby, Book, and Music Stores | - | 0.262 | 5 | 3 | 10 | 26 |
| 72 | Accommodation and Food | 1.141 | - | 7 | 4 | 15 | 51 |
| All | All Freight Intensive Sectors | 2.932 | 0.093 | 108 | 1 | 26 | 300 |
Where: FTAi is number of freight trips attracted, Ei is the number of employees and, α and β are the value as presented above in columns three and four.
Source: Capital District Transportation Committee
Data Integration
The project team integrated all data collected through this project in a master database on a dedicated data server. As data were collected, the project team documented metadata for each dataset to describe what the dataset contained. The project team spatially aligned the data using Geographic Information System (GIS) software. To check for data consistency and impute missing data, the project team developed spatiotemporal models to characterize data relationships. The project team identified data values outside the normal ranges for the data type to mark as potential outliers. All potential outliers were examined and edited as appropriate. Data visualized from the database is shown in Figure 2. Finally, plans were drafted for updating and maintaining the database.
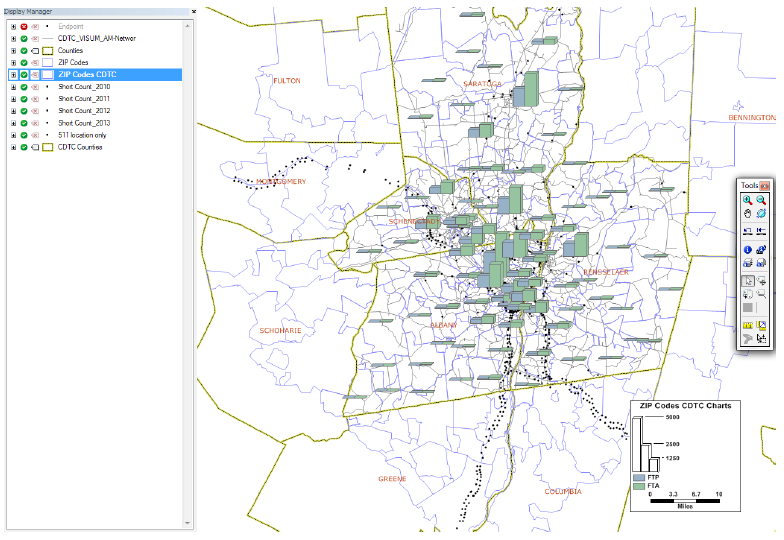
Figure 2. Image. Identifying freight trips produced and freight trips attracted at the ZIP code level.
Source: Capital District Transportation Committee
Outcomes
Project Benefits
The ultimate outcome of this project for CDTC is the development of a dynamic freight database. This database serves as a central location to house freight-related data for CDTC that the agency can use for future planning activities.
The process of developing the dynamic freight database included significant outreach and communication with freight stakeholders in the region. These outreach activities provided CDTC opportunities to build relationships with the freight community, discuss potential for future data improvement, and organize meetings to discuss the potential use and limitations of existing data on freight issues.
While much of the project's effort centered on compiling a number of existing freight data sources into a single location, the project team was also able to capture new freight data as well. New data collected during this project included data from shippers and carriers in the region as well as survey and in-depth interview responses. Together, this information both assisted CDTC in understanding freight shipment patterns in the region and provided insight into the decision-making processes by these businesses.
A major positive outcome of this project was the availability of processed data that is readily usable for any level of aggregation. For example, the Commodity Flow Survey and Freight Analysis Framework could be used for national level analysis, E-ZPass or truck count data could be used to model interstate flows, and freight trip generation, freight generation, and service trip models could be used for ZIP code level analysis. In addition to obtaining and preparing the database, the project team has calibrated models that could be used to estimate the freight flows (trips, generation, and services) at the ZIP code level.
Transferability of the Project
Activities completed during this project are readily transferable to other agencies. While some of the existing datasets collected in this project are limited to New York State or the CDTC region, similar data may be available in other States. All of the national datasets used in this project are available nationwide.
Lessons Learned
Collecting, compiling, and making freight data available for transportation planning is a significant effort. While most Federal datasets are readily available online, obtaining data from partner agencies can require significant coordination. Once data are collected it takes time to parse, clean, and align datasets in order to integrate them into a central location. Data must also be updated in a timely fashion to maintain their usefulness. When undertaking any data collection activities, users should fully investigate and understand the benefits and costs of the data as well as develop a data collection plan with a defined scope and update frequency cycle.
This project demonstrated the usefulness for small sample surveys and interviews. While the original intent for the surveys and interviews conducted during this project was to better understand freight movement in the CDTC region, these surveys and interviews assisted the project team in understanding establishing connections between variables in other datasets.
Data confidentiality was a concern voiced by shippers and carriers during the project. Given small margins on typical freight transportation services, shippers and carriers are often cautious about giving away their competitive advantage if competing firms have access to their data. While the project team was able to collect data after developing an NDA with each of the firms, the process of convincing the firms, developing the NDA, and executing the NDA takes substantial time and effort before data collection can begin.
Next Steps
The project team has identified next steps to improve and build on the results of this project. The database prepared by the team has to be updated and maintained regularly in order to be useful for the CDTC in freight planning. During data collection, the project team identified some datasets that would be useful for integrating into the database, although they were not available at the time. As these datasets become available, collecting, cleaning, and integrating them into the database would improve the committee's ability to plan for freight in the region.
The focus of this project was to develop a consolidated and integrated database to improve freight planning. A next step will be to begin to use the database and analyze the prepared data in order to make better freight planning decisions. Example freight planning activities that could be conducted in part due to the outcomes of this project include: estimating truck vehicle-miles traveled, forecasting truck flows, identifying truck bottlenecks, understanding the impact of trucks on roadway capacity, estimating truck- related emissions, evaluating truck routes, conducting cost-benefit analyses for freight projects, and better understanding the relationship between land use and truck traffic.
Finally, additional efforts to collect freight data in the CDTC region would enable CDTC to better model freight movement in the region. For example, collecting truck count data for non-Interstate routes in the region would enable CDTC to develop a freight tour synthesis model.
Conclusion
This project represented an effort to consolidate fragmented freight datasets into one cleaned and usable location. The project team successfully identified available freight data at the national, State, and local levels; coordinated with partner agencies to collect available data; conducted data collection activities to gather new freight data; and, finally, integrated all data into a single location, where it was ready to be used to improve local freight planning. In addition to the newly compiled data, outcomes of this project include calibrated models that could be used to estimate the freight flows (trips, generation, and services) at the ZIP code level and improve relationships with freight stakeholders in the region potentially leading to new data sources and better data sharing. Together, data made available through this project better position CDTC to plan for freight, including serving as input into a future freight element for its long-range transportation plan.
Product Information
Product Title: SHRP2 C20: Innovations in Local Freight Data
Agency Name: Capital District Transportation Committee
Contact Information:
Name: Christian Bauer, Senior Transportation Planner/Freight Program Manager
E-mail: cbauer@cdtcmpo.org
Phone: 518-458-2161
Resources
This section includes resources and related project documentation.
Technical Documentation
- Capital District Transportation Committee, Rensselaer Polytechnic Institute. (2016). Innovative Local Freight Data (Final Report). Albany, NY.
FOR MORE INFORMATION
Christian Bauer
Transportation Planner
Capital District Transportation Committee
Phone: 519-458-2161
E-mail: cbauer@cdtcmpo.org
Jeffrey Purdy
FHWA - Office of Freight Management and Operations
Phone: 202-366-6993
E-mail: Jeffrey.Purdy@dot.gov
Learn more about the SHRP2 program, its Capacity focus area, and Freight Demand Modeling and Data Improvement (C20) products at www.fhwa.dot.gov/GoSHRP2/
The second Strategic Highway Research Program (SHRP2) is a partnership of the Federal Highway Administration (FHWA), the American Association of State Highway and Transportation Officials (AASHTO), and the Transportation Research Board (TRB). TRB completed the research, and now FHWA and AASHTO are jointly implementing the resulting SHRP2 Solutions that will help the transportation community enhance productivity, boost efficiency, increase safety, and improve the reliability of the Nation's highway system.
STRATEGIC HIGHWAY RESEARCH PROGRAM
U.S. Department of Transportation Federal Highway Administration
American Association of State Highway and Transportation Officials – Transportation Research Board