Fueling Freight Movement:Emerging Technologies Help Clarify South Florida's Regional Petroleum Supply Chain
Printable Version [PDF, 3.2 MB]
You may need the Adobe® Reader® to view the PDFs on this page.
Contact Information: Freight Feedback at FreightFeedback@dot.gov

U.S. Department of Transportation
Federal Highway Administration
Office of Operations
1200 New Jersey Avenue, SE
Washington, DC 20590
FHWA-HOP-16-095
August 2017
Freight Demand Modeling and Data Improvement Implementation Support
Table of Contents
Executive Summary
Challenges
Southeast Florida's historic transportation corridors are coming under increasing pressure for the efficient transfer of people and goods to support a robust economy as population growth continues within the natural boundaries formed by the Everglades and Atlantic Ocean. Enhanced data on the makeup of traffic – of which tanker trucks distributing petroleum products are a critical component – would allow the Florida Department of Transportation (FDOT) to better plan for enhanced mobility, including the potential use of a behavior-based freight model.
Petroleum from Port Everglades accounts for nearly twenty percent of all energy consumption in Florida, and represents all petroleum products (e.g., crude oil, gasoline, diesel, propane, etc.) consumed in the four counties surrounding the port.1 While Port Everglades tracks the volume of petroleum transported in and out of the port, it does not document the delivery locations.
Approach
FDOT District 4 combined emerging technologies for automated vehicle recognition and conventional data sources to better understand the supply and demand chain for petroleum in South Florida. Through a literature review and evaluation, the project team selected two technologies to test in real-world conditions: license plate recognition and video image processing. To document the petroleum supply and demand chain, the project team collected and approximated petroleum shipments through the 12 counties in South Florida using Florida Department of Revenue tax records, Global Positioning System (GPS) truck probe data, and driver surveys.
Outcomes
Results of the field tests shed light on the application of each technology for large-scale deployments. Insufficient license plate registration records prevented the project team from identifying delivery locations for most tanker trucks captured using license plate recognition technology. The project team had 46 hours of field video analyzed through video image processing. While the video image processing algorithms and procedures are proprietary and were not available to the project team to review, the team found the results to be of good quality. A random verification of 15 percent of the video showed that video image processing had a 96 percent accuracy rate for tanker trucks, and a 95 percent accuracy rate for tanker rail cars.
To conduct a petroleum flow analysis, the project team used fuel tax records to plot the distribution of petroleum products on varying geographic scales, developing estimates on the number of truck trips in each micro analysis zone, for use in travel demand modeling. Analyzing truck probe data allowed the project team to identify 807 trip chains from two months of data. Data on these trip chains were prepared in the form of a Geographic Information System (GIS) shapefile that included trip level information such as trip length, trip time, and origin/destination land use description. Finally, driver surveys provided additional validation to the analyses.
Findings from the technology deployment portion of this project show promise for video image processing and automated license plate recognition in collecting data on the movement of petroleum, although the database used for the latter was insufficiently complete. The project team identified several limitations of the technologies tested, including the need to rely on potentially incomplete or separate datasets to support license plate matching and a lack of open-source procedures to conduct automated truck counts through image recognition processing.
Integration Into Business Practices
The methodology developed in this project will allow transportation planners to utilize conventional transportation data to better inform tanker truck route choice behaviors and forecast demand, both of which are critical components in developing a behavior-based freight model. Data collected during this project can also support infrastructure investment and assist emergency management and transportation agencies to manage the transportation system following significant weather events.
Introduction
Background
Given the natural boundaries formed by the Atlantic Ocean and the Everglades, the growing volume of goods moved through Southeast Florida is constrained to a limited number of corridors in the region. To efficiently plan and manage traffic, FDOT routinely completes many large-scale traffic data collection activities. As a result, FDOT has a strong grasp on vehicle counts on routes throughout the State. However, specific details on traffic composition in the State are not as refined. FDOT, like many transportation agencies, often uses vehicle detection sensors to classify vehicles by length, but this classification data provides little information on the type of commodity being transported.
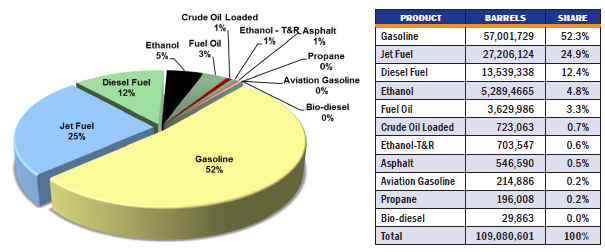
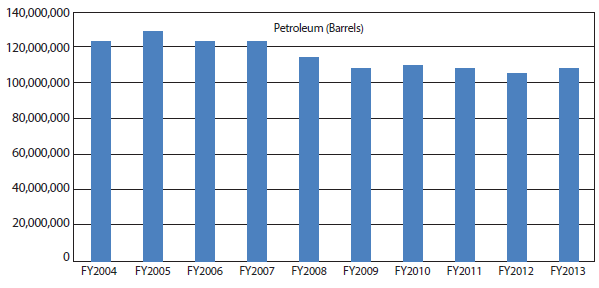
Petroleum products represent one major commodity type in this region, and Port Everglades is the main seaport in the region receiving these products. The volume of petroleum products moved through Port Everglades accounts for nearly 20 percent of all energy consumption in Florida, and represents all petroleum products consumed in the four counties surrounding the port. A breakdown of petroleum distribution at Port Everglades is shown in Figure 1 and historical petroleum activity at the port is shown in Figure 2. While information on the import and export of petroleum products was being collected at Port Everglades, the supply and demand chain for these products exiting the port into the region was not well understood.
Given the importance and volume of petroleum products shipped in the region, FDOT District 4 applied for and was awarded a SHRP2 C20 grant to:
- Conduct a pilot study to research, evaluate and deploy available vehicle detection and classification technologies that distinguish truck and rail fuel tankers from regular semi-trailers and rail cars.
- Collect or objectively approximate the volumes of all transportation modes, on sea and land, including roads, rail and pipelines, that are used to propagate petroleum goods along with their final shipping destinations.
Project Team
Table 1 describes the various partners and their roles on this project.
| Project Partner | Role |
|---|---|
| Florida Department of Transportation District 4. | Steering Committee member. |
| Broward Metropolitan Planning Organization (MPO). | Steering Committee member. |
| Petroleum Fuel industry operators (Petroleum Association of Port Everglades). | Steering Committee member. |
| Port Everglades. | Steering Committee member. |
| Center for Urban Transportation Research (CUTR) at the University of South Florida (USF). | Regional partner. |
| Florida East Coast (FEC) Railway. | Regional partner. |
| Local commercial airports, including Ft. Lauderdale-Hollywood and Miami. | Stakeholder. |
| Miami-Dade MPO. | Stakeholder. |
| Palm Beach MPO. | Stakeholder. |
| Federal Highway Administration. | Provided coordination support as well as technical and administrative guidance. |
Objectives
The project team identified four objectives to complete the project. Key objectives and the work approach are detailed in Table 2.
| Objective | Work Approach | Outcomes |
|---|---|---|
| Quantify and document petroleum commodity flows from Port Everglades. | Develop data fusion methodology to combine multiple sources of data. | Better understanding of petroleum shipments in Southeast Florida. |
| Engage the private sector. | Plan and conduct a robust outreach and coordination effort. | Insight into and feedback from private industry associated with Florida's petroleum products. |
| Identify applicable automated vehicle recognition technology for future deployment. | Literature review and evaluation of applicable technologies followed by use of these technologies to collect and process field data at strategic locations in Southeast Florida. | Identified issues and needs and developed an understanding of technology deployment readiness. |
Process
Project Management
With consultant support, FDOT District 4 assembled a core project steering committee including Port Everglades, the Broward MPO, and the Petroleum Association of Port Everglades. In addition to this core group, the project team routinely coordinated with other stakeholders, including agencies representing the local, State, and Federal transportation interests, academia, and organizations representing the rail and aviation industry. Together, these partners provided insight into the industry, and facilitated coordination with railroads, seaport terminals, truckers, and security operations.
Outreach and coordination with project partners and regional stakeholders was a significant element of this project. To this end, the project team developed a detailed project schedule for outreach activities and conducted more than 50 project meetings through the life of the project. The project team held bi-weekly and ad-hoc meetings to discuss topic-specific progress, needs, and issues, monthly meetings to update staff from FDOT's Central Office and FHWA, and quarterly meetings to deliver project updates to all applicable and interested stakeholders. The project team also developed a project website to share information with relevant stakeholders.4
To raise awareness of the project and get a better understanding of petroleum shipment activities, the project team also conducted site visits to Port Everglades to conduct a terminal tour, a meeting at ExxonMobil's facility, and a meeting at FEC Railway's Intermodal Ramp. The project team also developed and distributed a project fact sheet, a letter to Port Everglades business partners, and a presentation at Florida's Data Symposium.
Project Implementation
The project team developed an implementation plan that included:
- Technology review and evaluation.
- Technology deployment.
- Petroleum flow analysis.
Technology Review and Evaluation
The project team conducted a literature review to identify emerging devices and technologies that can automatically detect and classify tanker trucks and tanker rail cars. Through this effort, the project team identified 15 potential detection technologies. Of the 15, four detection technologies were selected as those with high potential for meeting the project's needs:
- Video image processing.
- Laser scanner/light detection and ranging (LiDAR).
- License plate recognition.
- Transponders.
Video Image Processing
Video image processing uses specialized algorithms to interpret images or videos and can recognize and classify vehicles by length, edges, and a combination of edges and size. Tanker trucks often vary in size and weight, but they tend to have a cylindrical shape that video image processing algorithms can be programmed to recognize. Benefits of video image processing include that the system can be used across multiple lanes, it is easy to add additional cameras to the system, and it is cost-effective to add multiple detection zones within a single camera. A drawback of video image processing is its susceptibility to inclement weather, low-light conditions, and camera obstructions.
Laser Scanner
Laser scanners function by transmitting active energy in the near infrared spectrum (i.e., outside of the light spectrum that is visible to the human eye). LiDAR detection software was identified as one of the most promising methods that use laser scanners. LiDAR can be used to develop three-dimensional renderings of the environment, which can then be used to extract traffic data. Benefits of laser technology include a non-intrusive installation, the capability to operate across multiple lanes, and its enhanced ability to provide accurate information about a vehicle's position, speed, and class. A drawback of LiDAR technology is that operation can be affected by poor visibility (e.g., fog, snow, rain) and highly reflective surfaces. At the time of the study, high-speed scanners cost more than $70,000 and were not available in the market to lease and deploy, making procurement of these scanners cost prohibitive for this project and most projects of its scale. Low-speed LiDAR scanners require vehicles to pass the scanners at very low speeds (e.g., less than five miles per hour), and the project team believed that most tanker trucks would be traveling too quickly to be properly detected by the low-speed scanners.
License Plate Recognition
License plate recognition is a type of video image processing where a camera captures images or video of passing vehicles, and algorithms process the image to interpret the vehicle's license plate number. A database is then queried to obtain information on the vehicle associated with the captured license plate number. Benefits of this technology are that it can work across multiple lanes and that the associated camera can be installed in a variety of mounting locations. Drawbacks of this technology include challenges processing different license plate standards (across State boundaries) and the fact that the system is susceptible to inclement weather or view obstruction. In addition, a challenge for this application is that tanker trucks do not have specialized license plates; to identify all tanker trucks, the project team would require access to license plate information maintained by multiple public and private sector organizations.
Transponders
The final technology that received an in-depth review by the project team was the use of transponders. The Florida SunPass, commonly used for electronic tolling in the region, is one example of a transponder. Data are collected when vehicles pass through a transponder station, and the vehicle's classification can be determined through the transponder's account registration information. Benefits of this technology include its low cost and the accuracy of transponder data. Drawbacks include privacy concerns and the length of time required to obtain access to the transponder data.
After weighing the benefits and drawbacks of each technology, the project team selected video image processing and license plate recognition for field testing. The project team felt that:
- LiDAR technology has high potential, but the technology needs further improvement before it would be viable for detecting tanker trucks.
- The use of transponders was feasible; however, maintaining cooperation and coordination between the various entities providing the transponder data could be difficult during the course of the study.
Technology Deployment
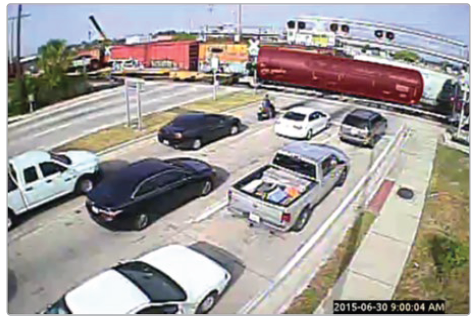
The project team conducted several data collection efforts to support the technology evaluation. First, the team captured manual tanker truck counts and license plate video data at all three Port Everglades gates for 24 hours. Next, the team deployed video cameras to three locations: two locations were at- grade railroad crossings, and the third location was at a major U.S. highway near Port Everglades. These cameras captured 72 hours of traffic video data, including both tanker trucks and tanker rail cars. An example tanker rail car image captured from the field video is shown in Figure 3.
To evaluate the license plate recognition technology, the project team identified the 559 unique tanker trucks captured from the field data. The project team next reviewed the unique license plate data to remove any erroneous entries (e.g., incomplete license plate numbers), resulting in 551 unique tank truck license plates. The project team acquired access to the Florida Department of Motor Vehicles (DMV) database developed to analyze household vehicle ownership and focused on passenger vehicles. Although the dataset did not contain complete collections of motor vehicles with a Florida license tag, the project team was able to match 80 tanker truck license plates and geocode the corresponding registration addresses to get a better understanding of their geographical distribution. Findings from this analysis showed that the majority of the identified tanker trucks represent small and medium-sized independent carriers and distributors in the region. This analysis also identified a fuel tanker truck that was registered to a company located in North Carolina, but operated in Miami with a Florida license tag. It is possible that other tanker trucks are operated locally, but registered out of the State and thus not included in the Florida DMV database. Due to the interstate nature of so much highway travel, this approach would require a national database and the multi-state cooperation that would entail.
The project team worked with a vendor to analyze the field video data through video image processing. The procedure used by the project team included capturing the video recording, uploading the video, and finally downloading the resulting data. Video analyzed in this way can be captured from any source; however, the vendor provided recommendations for video capturing equipment, equipment setup, and video format. The video image processing algorithms have been developed to account for different weather and lighting conditions and self-learn with each new video processed. The algorithms are supplemented with human verification to ensure high quality results.
The project team selected 46 of the 72 hours of field video to be analyzed through video image processing. The video was selected based on lighting conditions, time-of-day, and traffic patterns. The project team also conducted random sample verification on 15 percent of the video data to validate the results of the video image processing. The project team found that video image processing had an overall accuracy rate of 96 percent for tanker trucks and 95 percent for tanker rail cars, although, per the vendor, the analysis did rely also on some level of human review and verification.
Petroleum Flow Analysis
To understand petroleum flows from Port Everglades, the project team identified and synthesized several datasets: Florida Department of Revenue (FDOR) fuel tax data, American Transportation Research Institute (ATRI) GPS data, and driver surveys. IHS Global Insight's TRANSEARCH regional commodity flow data available for this study lacked details on fuel delivery locations and was not utilized in this analysis.
Fuel tax data represent information on fuel sold in the State by licensed operators on a transaction-by-transaction basis, updated monthly. FDOR provides 11 types of fuel-related licenses; for the purpose of this study, the project team narrowed their review of data to those operators licensed as "terminal suppliers" and "wholesalers." The project team collected approximately one year's worth of data consisting of 7.2 million records.
The project team reviewed fuel tax records and identified about 5.2 billion gallons of petroleum shipped from Port Everglades to domestic locations within the analysis period (fiscal year 2013). Next, the team reviewed Florida Department of Environmental Protection (DEP) records to identify storage tank locations for the petroleum product shipped out of Port Everglades. This exercise allowed the project team to identify street addresses where 2.2 of the 5.2 billion gallons of product were shipped. The project team was unable to find matching delivery street addresses for many of the fuel tax records because not all fuel tax records require an active tank facility identification number. The project team conducted regression analysis of petroleum consumption in the study area to account for the petroleum shipped without corresponding delivery addresses in the dataset. The regression analysis used information on the number of gas stations, population density, average household income, and employment density to estimate volume of petroleum products delivered. The project team was able to plot the distribution of petroleum products on varying geographic scales (e.g., zip code, traffic analysis zone) as well as develop estimates on the number of truck trips to each micro analysis zone for use in travel demand modeling.
The project team analyzed ATRI truck probe GPS data to separate tanker trucks from other traffic. The team then recorded these trucks' travel paths from Port Everglades to their final delivery points, including intermediate stops. To separate tanker trucks from other traffic, two months of data were reviewed to identify GPS records for vehicles that fell within specified regions around certain terminals at Port Everglades. The project team analyzed ATRI truck probe GPS data to separate tanker trucks from other traffic. The team then recorded these trucks' travel paths from Port Everglades to their final delivery points, including intermediate stops. To determine if the vehicle was making petroleum-related trips, the project team compared trip ends to known locations of fuel recipients based on fuel tax records and gas station locations from online mapping services. In addition to removing non-petroleum-related trips, this process allowed the project team to identify approximately 100 new gas stations for the dataset.
The project team used an existing algorithm to derive truck trips from the raw GPS records and then convert the truck trips into trip chains. The project team was able to identify 807 trip chains from the two months of data that visited Port Everglades – an apparently reasonable sample size, although estimated to be roughly two percent of the tanker trips at Port Everglades during that time. Data on these trip chains were prepared in the form of a Geographic Information System (GIS) shapefile that included trip level information such as trip length, trip time, and origin/destination land use description. An example of truck routes identified in Broward County, Florida are shown in Figure 4.
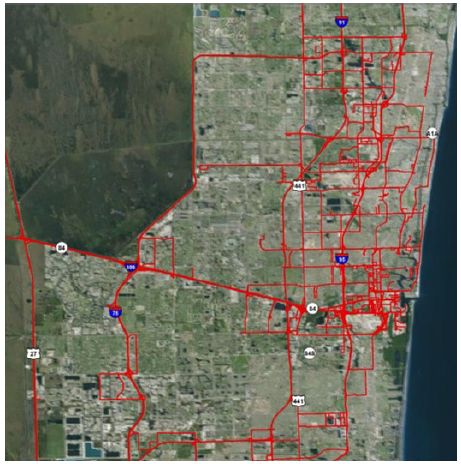
Figure 4. Image. Tanker truck routes in Broward County, Florida.6
Source: Florida Department of Transportation
To supplement information on truck routes identified through GPS records and better understand route choice, the project team distributed surveys during a monthly Petroleum Association of Port Everglades meeting. Three trucking companies participated in the survey providing completed surveys from over 30 truck drivers representing about 100 trips per day. Survey findings validated routes identified through GPS records and show that drivers select routes to minimize travel time, and consider various route characteristics, such as directness, facility type, posted speed limit, access to the destination, toll charges, and land use considerations (e.g., school zones).
Outcomes
Project Benefits
More than 100 million barrels of petroleum product have been shipped through Port Everglades annually over the last decade, and transportation planners in the region have previously had little insight into the delivery locations for the petroleum supply chain. This project developed a new methodology to analyze tax records that, when supplemented with other data (e.g., GPS data and driver surveys), provides planners with insight into the movement of goods that can be used to enhance modeling and simulation tools, which ultimately allows transportation planners to make better decisions regarding infrastructure investment and system operations. This research also demonstrated the use of new data collection and exchange methodologies – for example with Florida Department of Revenue – that allowed the region to enhance its existing freight data sources to support county, regional, and State freight programs, as well as regional traffic management practices. The project team was able to document petroleum usage and its associated economic conditions and population and employment distribution patterns in the region. The results will provide a basis for establishing long-term relationships between freight pattern and economic and demographic characteristics.
Outreach and coordination was a significant focus of this project. Through close coordination between the project's steering committee and the regional partners, the project demonstrated that collaboration between public and private sector stakeholders resulted in an overall better understanding of the individual segments of the petroleum transport community, including shippers, carriers, and customers of the supply and demand chain.
Finally, this project conducted a thorough review of emerging technologies to classify tanker trucks and tank rail cars, evaluated each to determine which of the technologies had the highest potential for success, and tested two technologies. Findings from the deployment show that video image processing and license plate recognition can support the data collection process for tanker trucks and tanker rail cars. However, improvements are still needed before these technologies can be successfully deployed on a large scale for this purpose.
Transferability of the Project
While the project team researched emerging technologies to identify and classify fuel tanker trucks and tanker rail cars, findings from this project are applicable to multiple vehicle types and are useful to any State or local transportation agency interested in using innovative data collection technologies.
Lessons Learned
An important goal of this project was to successfully engage the private sector. The project team believed that continuous outreach and engagement is important when working with private industry, which has less interest in longer-range infrastructure planning. To better engage private industry, the project team completed proactive outreach activities and modified its outreach message to clearly communicate the benefit of participating.
Limitations and challenges should be considered when using video image processing technology. The technology was demonstrated to be reasonably cost-effective and accurate for the study objective. However, working through a vendor for the video image processing prevented the project team from having a full understanding of the image recognition process, due to the proprietary process and algorithms used by the vendor. The lack of transparency made it time consuming to independently validate the data produced through the technology.
Regression analyses can be suitable to compensate for data gaps. The project team looked to use FDOR fuel tax data as a source of information to understand where petroleum products were being delivered in the region. After obtaining the data, the project team found that, due to various tax codes and requirements, much of the applicable data did not include destination locations for the transactions. To overcome this challenge, the project team was able to complete a petroleum consumption regression analysis and successfully supplement incomplete tax revenue data.
Next Steps
The project team has identified several potential opportunities to advance research in the area of automated freight data collection and to enhance FDOT's ability to plan for freight. One characteristic of video image processing algorithms is that accuracy is often improved by a larger data sample size; obtaining additional video from around the State would continue to improve video image processing capabilities. Collecting more recent fuel tax data from FDOR would allow FDOT to fill the identified data gaps and better document the petroleum origin-destination pattern in the region. While the methodology followed in this study focused on petroleum products, its use is not limited to petroleum. The project team believes that bulk sugar and cement shipped in and out of the region could also be viable commodity types to analyze with this new methodology.
Conclusion
Through this project, FDOT District 4 enhanced its understanding of the supply and demand chain for petroleum commodities distributed from Port Everglades to the 12 counties of South Florida. The project team successfully identified, evaluated, and tested emerging technologies for vehicle data collection and developed an analytical approach to integrating new datasets into transportation planning activities. Findings from this project show that it is possible to successfully capture and process the required data through video image processing and automated license plate recognition on a limited scale, but current technology limitations prevent large scale applications for these technologies to collect data on petroleum movement.
The methodology developed in this project will allow transportation planners to utilize conventional transportation data to better inform tanker truck route choice behaviors and forecast demand, both critical components to developing a behavior-based freight model. Data collected during this project can also support infrastructure investment and can assist emergency management and transportation agencies to manage the transportation system following significant weather events. The approach can also be used for other commodity types and vehicle types, and for different geographic areas for which commodity sales tax data are available.
In summary, activities completed on this project demonstrate the outcome of successful, long-term public and private-sector collaboration to enhance freight planning in the region.
Product Information
Product Title: SHRP2 C20: Innovations in Local Freight Data
Agency Name: Florida Department of Transportation, District 4
Contact Information:Name: Min-Tang Li
E-mail: Min-Tang.Li@dot.state.fl.us
Phone: 954-777-4652
Resources
This section includes resources and related project documentation.
Technical Documentation
- Florida Department of Transportation, District 4 (2016). Freight Demand Modeling and Data Improvement Port Everglades Petroleum Commodity Flow Pilot Study, Fort Lauderdale, FL. Retrieved from http://fdotd4-shrp2c20.com/blog/wp-content/uploads/2014/07/Final_report_SHRP2_C20_PEV_PetroleumComm_2016-02-01.pdf, last accessed June 1, 2016.
Applicable Technologies
Table 3 briefly describes each of the 15 technologies considered as part of this project, as well as their potential for detecting tanker trucks.
| Technology | Definition and Operation Theory | Vehicle Classifications Detecting Methods | Potential for Tanker Truck Detection |
|---|---|---|---|
| Video Image Processing | Video image processor systems detect vehicles by interpreting video image and convert signals into traffic flow data. Video image processing can be trained to recognize vehicles ' classification and identification based on the digital imagery that is presented. | Analyze video images: can classify vehicle by length, edges, and combinations of features and sizes. | High |
| Laser Scanner/ LiDAR (Light Detection and Ranging) | A transmitted pulsed or continuous light which is used to image objects, utilized three dimensional (3D) data which extracts road data from classification. | Create 3D images: can classify vehicles by length, edges, shapes, features, and sizes. | High |
| License Plate Recognition | Captures photographic video or images of license plates, which are processed through a series of algorithms to capture and identify the license plate image. | Analyze license plate photos or images: detect vehicle classification based on registration information. | High |
| Transponders | Detect vehicles and collect data when they passing through transponder stations. | Analyze vehicle registration database: detect vehicle classification based on registration information. | High |
| Inductive Loop | A sensor capable of detecting vehicle passage and presence. There are two basic undercarriage loop classifier technologies. One uses the "signature" from existing loops to determine classification by matching the shape of that loop to expected profiles. The other uses specific types of loops to detect changes in inductance associated with wheels, and uses that information to detect and measure axles. | Analyze complex information: can classify vehicles by length, axles, and loop signatures. | Low |
| Weigh-in-Motion | Detect vehicle by presence of an axle as well as the pressure put on the device. | Classify vehicles by axles and weight. | Low |
| Microwave Doppler | The constant frequency signal (with respect to time) allows vehicle speed to be measured using the Doppler principle. Accordingly, the frequency of the received signal is decreased by a vehicle moving away from the radar and increased by a vehicle moving toward the radar. Vehicle passage or count is denoted by the presence of the frequency shift. | Classify vehicles by length | Low |
| Microwave Radar | Vehicle detection devices that transmit electromagnetic energy from an antenna towards vehicles traveling the roadway. When a vehicle passes through the antenna beam, a portion of the transmitted energy is reflected back towards the antenna. The energy then enters a receiver where the detection is made and traffic flow data, such as volume, speed, and vehicle length are calculated. | Classify vehicles by length | Low |
| Magnetometer (two-axis fluxgate magnetometer | Passive devices that detect the presence of a ferrous metal object through the perturbation (known as a magnetic anomaly) it causes in the Earth's magnetic field. Its output is connected to an electronics unit. | Classify vehicles by length | Low |
| Piezo/ Quartz Sensor | An axle detection sensor embedded in the roadway, which produces a signal when an axle/tire comes cross it. | Classify vehicles by axles | Low |
| Passive infrared | A device whose infrared sensitive element detect and converts the reflected and emitted energy from vehicles, road surfaces and other objects into electrical signals. | Classify vehicles by axles | Low |
| Magnetic Detector (induction or search coil magnetometer) | A device that detects changes in the Earth's magnetic field caused by the movement of a ferrous metal vehicle in or near its detection area. It is placed under or in the roadway to detect the passage of a vehicle over the sensor. These sensors generally detect only moving vehicles. Their output is connected to an electronics unit. | Cannot classify vehicles | N/A |
| Air switch/ Road tube | A tube installed perpendicular to traffic, in which a burst of air pressure produces an electrical signal as a vehicle's tires pass over the tube. | Cannot classify vehicles | N/A |
| Ultrasonic | Transmit pressure waves of sound energy at a frequency between 25 and 50 kHz, which is above the human audible range. Most ultrasonic sensors operate with pulse waveforms and provide vehicle count, presence, and occupancy information. | Cannot classify vehicles | N/A |
| Passive Acoustic Array Sensors | Measure vehicle passage, presence, and speed by detecting acoustic energy or audible sounds produced by vehicular traffic from a variety of sources within each vehicle and from the interaction of a vehicle's tires with the road. | Cannot classify vehicles | N/A |
Trucking Company Route Choice Survey8
What Factors Affect Your Route Choice?
Date:
Driver No.:
Year of Service:
□ 1. Travel Time (sensitive to travel time?)
□ 2. Travel Speed (prefer higher speed?)
□ 3. Travel Distance (longer freeway route vs shorter arterial route?)
□ 4. Speed Limit (35 mph vs 45 mph?)
□ 5. Speed Variation (avoid busy local streets?)
□ 6. Congestion (check traffic before choosing route?)
□ 7. Freeway vs Arterial (use freeway when possible?)
□ 8. Residential Area (try to avoid?)
□ 9. Toll Fee (try to minimize?)
□ 10. School Zone (try to avoid?)
□ 11. Rail Crossing (try to avoid?)
□ 12. Draw Bridge (try to avoid?)
□ 13. Pavement Condition (try to take road with fewer signals?)
□ 14. Signal Light Density (try to take road with fewer signals?)
□ 15. Sharp Curves/Turns (try to avoid?)
□ 16. Lighting (choose to use roads with better lighting in night time?)
How Often You Change Route To A Specific Delivery?
□ Rarely.
□ Sometime, due to incidents on the roads.
□ Often, due to traffic condition on roads.
1 Florida Department of Transportation (2016), Freight Demand Modeling and Data Improvement Port Everglades Petroleum Commodity Flow Pilot Study, Fort Lauderdale, FL. [ Return to note 1. ]
2 Florida Department of Transportation (2016), Freight Demand Modeling and Data Improvement Port Everglades Petroleum Commodity Flow Pilot Study, Fort Lauderdale, FL. [ Return to note 2. ]
3 Port Everglades (2013). Port Everglades Fiscal Year 2013 Commerce Report, Fort Lauderdale, FL. [ Return to note 3. ]
4 Florida Department of Transportation, District 4 (2015). Port Everglades Petroleum Commodity Flow Pilot Study. Retrieved from http://fdotd4-shrp2c20.com/, last accessed March 7, 2016. [ Return to note 4. ]
5 Florida Department of Transportation (2016), Freight Demand Modeling and Data Improvement Port Everglades Petroleum Commodity Flow Pilot Study, Fort Lauderdale, FL. [ Return to note 5. ]
6 Florida Department of Transportation (2016), Freight Demand Modeling and Data Improvement Port Everglades Petroleum Commodity Flow Pilot Study, Fort Lauderdale, FL. [ Return to note 6. ]
7 Florida Department of Transportation (2016), Freight Demand Modeling and Data Improvement Port Everglades Petroleum Commodity Flow Pilot Study, Fort Lauderdale, FL. [ Return to note 7. ]
8 Florida Department of Transportation (2016), Freight Demand Modeling and Data Improvement Port Everglades Petroleum Commodity Flow Pilot Study, Fort Lauderdale, FL. [ Return to note 8. ]
FOR MORE INFORMATION
Min-Tang Li
Senior Systems Engineer
Florida Department of Transportation, District 4
Phone: 954-777-4652
E-mail: Min-Tang.Li@dot.state.fl.us
Birat Pandey
FHWA-Office of Operations
Phone: 202-366-2842
E-mail: Birat.Pandey@dot.gov
Learn more about the SHRP2 program, its Capacity focus area, and Freight Demand Modeling and Data Improvement (C20) products at www.fhwa.dot.gov/GoSHRP2/
The second Strategic Highway Research Program (SHRP2) is a partnership of the Federal Highway Administration (FHWA), the American Association of State Highway and Transportation Officials (AASHTO), and the Transportation Research Board (TRB). TRB completed the research, and now FHWA and AASHTO are jointly implementing the resulting SHRP2 Solutions that will help the transportation community enhance productivity, boost efficiency, increase safety, and improve the reliability of the Nation's highway system.
STRATEGIC HIGHWAY RESEARCH PROGRAM
U.S. Department of Transportation Federal Highway Administration
American Association of State Highway and Transportation Officials – Transportation Research Board