Farm to Markets: Innovative Data Sources Enhance Agriculture Freight Connectivity - Freight Demand Modeling and Data Improvement Implementation Support
Printable Version [PDF, 4.0 MB]
You may need the Adobe® Reader® to view the PDFs on this page.
Contact Information: Freight Feedback at FreightFeedback@dot.gov

U.S. Department of Transportation
Federal Highway Administration
Office of Operations
1200 New Jersey Avenue, SE
Washington, DC 20590
FHWA-HOP-16-091
August 2017
Table of Contents
Executive Summary
Challenges
The agriculture industry has a $20.9 billion impact on the South Dakota economy. To ensure that agricultural products can be moved efficiently to market, the South Dakota Department of Transportation (SDDOT) routinely makes investment decisions to add and improve transportation infrastructure across the State. While these investment decisions are made based on the needs of the transportation system and are a function of the demand for agricultural products, the SDDOT generally does not use agriculture production data to assist in making these investment decisions.
There are several reasons why agriculture data is not used as an input into the transportation planning process; however, the dynamic nature of the agriculture industry is among the most significant reasons. Many factors play into the dynamics of the agriculture industry. Advancements in technology are allowing crops to grow in a wider range of environments and locations, improving harvest productivity, and improving processing, transportation and storage. External factors such as soil and weather conditions, supply and demand, and profitability influence production and add another layer of complexity in using agriculture data to forecast agriculture-related transportation demand.
Approach
Given the importance of agriculture to the State, SDDOT completed a project to develop and demonstrate a framework to combine agriculture and transportation data with the goal of using agriculture data to inform transportation planning. This project included a literature review and stakeholder interview process to understand agriculture trends and identify agriculture data sources. Data requirements were developed, and available data sources were evaluated to understand how each source met the newly defined requirements. With a prioritized list of new data sources, the project team devised an approach to combine available transportation and agriculture data sources and identified a five-county region in central South Dakota where the project team successfully demonstrated the research approach.
Benefits
The new methodology developed as part of this project will provide SDDOT with greater insight into freight transportation needs at the sub-regional level. Results of the project detailed townships within the five-county demonstration region that had both the highest agriculture-related freight demand and the greatest need for transportation infrastructure improvements.
Outcomes of this project provide increased awareness of the State's highly dynamic agriculture industry and related transportation system demands that support freight forecasting at local and State levels, with applicability at regional and national levels, especially in areas with a large agricultural presence. It is in these areas that the economic importance of rural agricultural freight connectivity is most critical. In addition, this project provided SDDOT with:
- A new process that allows SDDOT to use publicly available, but previously unused, agriculture data so that SDDOT, transportation professionals, and industry groups can use some of the same data for decision-making.
- The ability to estimate impacts of truck traffic directly due to crop production at the sub-regional level.
- A spreadsheet tool that streamlines the process.
- Increased understanding of the linkage between crop production and infrastructure needs allowing SDDOT to better plan, build, and maintain the State's transportation infrastructure.
Integration Into Business Practices
During this project, SDDOT discovered freight data gaps on the local transportation system and is pursuing options to strengthen the data collection at the local level. In addition, SDDOT is looking to identify opportunities to further use the approach and spreadsheet tool on local transportation planning applications.
Introduction
Background
With $20.9 billion in economic impact, agriculture is one of South Dakota's most important industries. Including the related value-added industries, production agriculture employs more than 122,000 people in South Dakota.1 Recent advances in technology and genetically engineered crops have greatly increase agricultural productivity and resulted in both record crop yields as well as the ability to plant crops in areas where crops previously could not flourish.
With increased productivity and increased crop yield, South Dakota is experiencing an increase of truck and rail freight to move agricultural products. Class I rail operators serve approximately 80 percent of the rail system in South Dakota and consolidate truck traffic to large grain elevators. These large grain elevators have forced many smaller elevators out of business causing increased demand for truck traffic in areas not served by railroads. Additionally, many local roads in South Dakota are unpaved. During heavy rains and storms, trucks are often unable to complete trips due to impassable roads. Likewise, many bridges in South Dakota are weight limited and impassable for large trucks. Instances of bridge or road closures can greatly affect farmers in the region, as, with limited transportation options, they may be forced to delay shipments. The effect of these factors on transportation costs may impact producer's and shipper's profits.
Like many other Departments of Transportation, the South Dakota Department of Transportation (SDDOT) uses multiple transportation data sources to forecast traffic volumes and support planning decisions on infrastructure improvements. However, the traditional transportation planning processes typically do not use agriculture data sources such as the National Agricultural Statistics Service. Given the significance of the agriculture industry in the State and corresponding volume of related goods moved throughout the State, it is important to understand the impact of agricultural production and trends on the transportation system. To accomplish this, the SDDOT applied for and received funding under the Strategic Highway Research Program 2 (SHRP2) Implementation Assistance Program to identify new sources of data, beyond conventional, historical traffic counts, to support more reliable predictions of agricultural freight demand in the State.
Table 1 describes the various partners and their roles on this project. When beginning the project, the SDDOT established a technical panel with experts spanning both the transportation and agriculture industries. The wide-ranging areas of expertise of panel members was particularly critical to the success of this project.
Project Team
| Project Partner | Role |
|---|---|
| Technical Panel. | The project's technical panel consisted of 19 experts from both the transportation (e.g., South Dakota Department of Transportation, North Dakota Department of Transportation, and South Dakota Local Transportation Assistance Program) and agriculture industries (e.g., South Dakota Department of Agriculture, South Dakota Association of Cooperatives). The technical panel provided direction, feedback, and oversight to the project. |
| Federal Highway Administration | Provided coordination support as well as technical and administrative guidance. |
Objectives
The project team identified four objectives to demonstrate the feasibility and utility of collecting and combining agriculture with transportation data to inform transportation planning decisions. Key objectives and the work approach are detailed in Table 2.
| Objective | Work Approach | Outcomes |
|---|---|---|
| Document South Dakota agriculture trends. | Conduct literature review. | Understanding of major agriculture trends in South Dakota as well as applicable data sources. |
| Identify data purposes. | Interview agriculture and transportation stakeholders. | Short- and long-term purposes for improved agricultural freight data. |
| Define data needs and sources. | Develop a list of ideal data requirements and a list of available data sources. | List of most promising data sources and an identification of existing data gaps. |
| Demonstrate data acquisition and application. | Synthesize data, identify demonstration area, demonstrate and document work products. | A transferable framework that can be used to support transportation planning questions related to agricultural activities. |
Process
Project Management
To conduct the research under this project, the SDDOT first assembled a multi-disciplinary technical panel to oversee the project. The final panel consisted of 19 members and included members with backgrounds spanning transportation and agriculture. On the transportation side, members represented agencies ranging from the Federal level to the local level. Members representing the agriculture industries included the South Dakota Association of Cooperatives, South Dakota Department of Agriculture, and South Dakota Grain and Feed Association.
To complete the research, SDDOT selected a consultant team with expertise crossing both transportation and agriculture. The team consisted of a transportation consulting firm as well as two universities from the region.
Project Implementation
The SDDOT project team developed an implementation plan that included:
- Understanding agricultural production and trends.
- Identifying purposes for agricultural data.
- Defining data requirements.
- Identifying and assessing data sources.
- Demonstrating and evaluating improved data.
- Describing scale-up.
Agricultural Production and Trends
The project team first conducted a focused review on the agriculture industry in South Dakota to understand current agricultural trends and determine what data sources are available to describe these trends. Understanding agricultural trends in the State was critical for the project team to conduct relevant research on the topic. The project team conducted a literature review that identified a number of key trends and developed a matrix that illustrated how the key trends affected the four-step transportation model.
Identify Purposes for Agricultural Data
With an understanding of key agricultural trends and supporting agricultural data sources, the project team conducted outreach to local, State, and Federal officials as well as industry stakeholders to identify the most significant short- and long-term objectives for which improved agricultural production and transportation data are needed.
The project team identified a list of stakeholder types to target for one-on-one interviews; the list focused on organizations that had interest in the State's freight transportation system and the State's agriculture industry. The project team completed 20 interviews, with approximately half focused on agricultural stakeholders and half on transportation stakeholders. A summary of purposes for agricultural data reported from these interviews are included in Table 3.
| Stakeholder Type | Potential Purposes/Applications | ||||||
|---|---|---|---|---|---|---|---|
| Truck/Rail Demand (current, future) | Assess System Condition, Performance and Local Impacts (e.g., pavement, quality of life) | Determine Maintenance Needs (e.g., pavement mgmt, resurfacing) | Inform Maintenance and Design Standards (e.g., bridge/ pavement design; geometric/ structural considerations) | Determine Large Investment Need (e.g., multimodal, roadway construction) | Prioritize Investments (multimodal, inform STIP) | Grain Elevator and Other Facility Site Selection/ Evaluation | |
| SDDOT | |||||||
| Local Road Agency | |||||||
| Private Sector | |||||||
Stakeholder interviews also identified differences in decision timeframes for the different stakeholders. While both public and private sector stakeholders reported the need to make decisions on the daily, seasonal, and annual timeframes, the public sector also reported the need to focus decisions on both short-term (0 to 4 years) and longer-term (5 to 8 years) whereas the private sector stakeholders generally made decisions related to their business plan (1 to 5 years). The project team combined the decision timeframe with potential applications for data and developed a detailed agricultural and transportation related decision data matrix to assist the development of data requirements.
Define Data Requirements
To support the needs documented in the stakeholder interviews, the project team organized the data requirements first by spatial granularity, temporal granularity, and collection frequency, and second by data types of agricultural data, facility data, and transportation data.
Considering spatial granularity, the project team determined that ideal agricultural data would be at the acre-level and include crop characteristics (e.g., crop type, crop density, yield). Ideal facility data would include point information for different facilities in the State (e.g., commodity mix, capacity). Transportation data would describe the physical and operational characteristics of the State's transportation network (e.g., functional class, roadway material).
The data requirements for temporal granularity ranged widely. In most cases, the project team believed that regular and current data would be ideal (e.g., monthly or quarterly data about crop production). In other cases, data such as facility count or truck count would be most useful for the current year. In all cases, obtaining historical data is also important.
The data requirements for frequency of data collection varied due to the nature of the types of data. For example, many agricultural and facilities data are collected frequently and statistics on these data are regularly produced; however, this data is often proprietary and is not often readily available to transportation agencies. In contrast, transportation data is publicly available data, but inconsistencies in coverage-level and detail can make the use of the data difficult.
Identify and Assess Data Sources
Using information gained during the literature review and stakeholder interviews, the project team identified existing and new, unconventional data sources for use in the project. Data sources were grouped into two categories: transportation data sources and agriculture data sources.
Transportation agencies typically maintained the transportation data sources. SDDOT maintains data on their transportation infrastructure and has a short-term truck counting program that monitors 7,500 locations. The majority of the truck count locations are volume counters, but several hundred record truck classification. The SDDOT also maintains 15 weigh-in-motion locations in the State.
Data sources from local transportation agencies were identified to supplement the State-level transportation data. Unlike the State transportation system, much of the local system in South Dakota is unpaved and difficult for local transportation agencies to collect robust truck data. As such, the project team was not able to collect truck count data on the local transportation system.
Several agriculture data sources were identified through the stakeholder interviews as data sources that stakeholders use and believe to be reliable. These data sources are the United States Department of Agriculture's (USDA) National Agricultural Statistics Service (NASS), Economic Research Service (ERS), and Agricultural Marketing Service (AMS).
The USDA's NASS provides statistics across an array of agricultural topics, such as crops, livestock, related commodities, and processed products. The NASS also offers a geospatial data product, the Cropland Data Layer (CDL), which is generated annually to provide a geo-referenced, crop-specific land data layer. On the whole, the NASS provides fully robust information for common crops. In addition, the USDA's ERS offers a number of data sets and tools focused on crop and livestock production, including forecasts. Finally, the AMS provides access to data on agricultural-related topics such as standards and inspection, prices, volumes, transportation, and weather impacts.
Demonstrate and Evaluate Improved Data
With the applicable data sources identified and collected, the project team began the project demonstration. The purpose of the demonstration was two-fold: (1) to synthesize the various data sources identified throughout the project, and (2) develop information about truck trips resulting from the movement of agricultural freight based on the newly synthesized data. The demonstration area consisted of five counties in central South Dakota and was selected for two reasons: first, the selected demonstration area had the required transportation data available; and, second, there were multiple agricultural activities contained within the selected area (e.g., crop production, livestock production, livestock auction).
To conduct the demonstration project, the project team first synthesized the agriculture and transportation data. The main data sources for this effort were the USDA NASS crop data geographic information systems (GIS) dataset on the land uses made by farmers in a calendar year and State and local transportation infrastructure data. The two data types were overlaid to determine expected crop yield, access to State highways or rail yards, and percentage of paved roadway miles per township within the demonstration area.
Next, the trip calculations were developed to understand the movement of goods within the study area. Crop yields were converted into truck trips using equivalent single axle loads (ESALs) and estimated per township, per quarter for a baseline year of 2014 (shown in Figure 1). The USDA ERS forecast includes crop acres, crop yields, and crop uses up to the year 2024. Together, this information was combined with historical trends available from USDA's NASS to forecast ESALs per township, per quarter in 2024, using three scenarios focusing on truck size and weight restrictions and vehicle fleet mix: status quo and two alternate scenarios. Alternate scenario 1 assumed the use of only single trailer 5-axle trucks with a weight restriction of 80,000 pounds, and alternate scenario 2 assumed the use of only multiple trailer 7-axle trucks with no weight restriction.
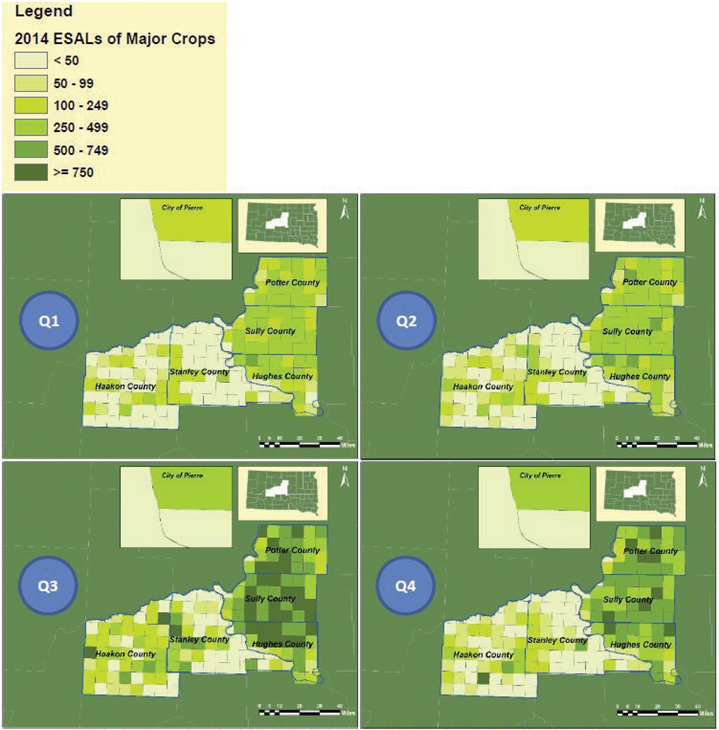
Figure 1. Demonstration Results for the Baseline Year.
Source: USDA National CDL data, USDA NASS data, ESRI and SDDOT GIS data, Agar WIM data, UGPTI, North Dakota Strategic Freight Analysis – Truck Size and Weight Issues in North Dakota, Final Report for North Dakota Department of Transportation, July 2007, David L. Huft, Considerations for Imposing Local Restrictions, SDDOT, Research Note, last updated on Feb 12, 2014, and UGPTI and Cambridge Systematics Analysis.
The second part of the demonstration was to use the new data sources to provide decision support. The combination of transportation and agricultural data allowed the project team to assess each township in the demonstration area for agricultural freight demand and transportation quality. Agricultural freight demand was estimated by identifying townships that had at least one major crop being produced at a rate greater than the 80th percentile for the demonstration area. The transportation network was estimated by of a combination of the percentage of unpaved roads, direct access to State highway and rail lines, roadway cross-section width, and number of bridges with weight restrictions.
As shown in Figure 2, the project team developed a map illustrating the townships with potential for the greatest need or potential for development of agricultural or transportation-related infrastructure, based on the combination of transportation and agricultural data. In addition, the project team identified other factors to consider during facility site selection: demand for additional service, accessibility to markets, cost of transportation, pavement and bridge type and condition, and geometrical constraints.
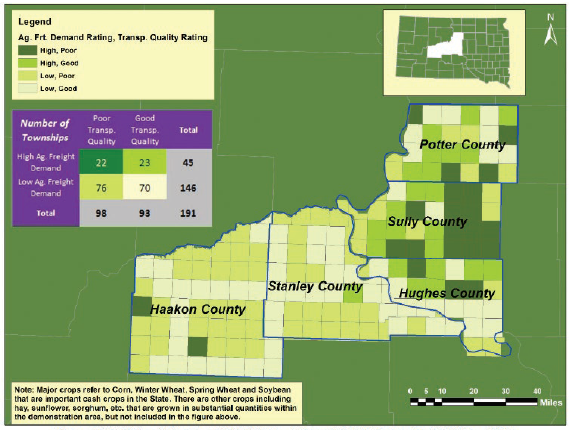
Figure 2. Evaluation of Agricultural Freight Demand and Transportation Quality for Facility Site Location Decision in the Demonstration Area.
Source: USDA National CDL data, USDA NASS data, ESRI and SDDOT GIS data, Agar WIM data, UGPTI, North Dakota Strategic Freight Analysis – Truck Size and Weight Issues in North Dakota, Final Report for North Dakota Department of Transportation, July 2007, David L. Huft, Considerations for Imposing Local Restrictions, SDDOT, Research Note, last updated on Feb 12, 2014, and UGPTI and Cambridge Systematics Analysis.
Describe Scale-Up Process
A final activity for this project was to describe how the newly developed approach could scale up to be used in other, similar scenarios or for different locations. The process for adapting the approach at different geographical scales varies in complexity depending on the geographic scale selected.
To demonstrate the research approach's ability to address other types of agriculture-related scenarios, the project team used the approach to study two other types of agriculture operations: a concentrated animal feeding operation facility and a livestock auction facility. For each of these operations, the project team demonstrated the process of identifying and evaluating potential data sources, collecting data, and fusing agriculture and transportation data to allow planners and practitioners greater insight into agriculture operations and the need and demand for related transportation infrastructure.
Outcomes
Project Benefits
SDDOT realized several benefits from completing this project:
- A new process that allows SDDOT to use publicly available, but previously unused agriculture data so that SDDOT, transportation professionals, and industry groups can use some of the same data for decision-making.
- The ability to estimate impacts of truck traffic directly due to crop production at the sub-regional level.
- A spreadsheet tool that streamlines the process.
- Greater insight into the linkage between crop production and infrastructure needs allowing SDDOT to better plan, build, and maintain the State's transportation infrastructure.
Like many Midwestern States, South Dakota's economy is built on a strong link between agriculture and transportation trends, needs, and issues. This project included a detailed review of the agriculture industry through both existing literature and stakeholder interviews. Together, this effort offers practitioners in States with a similar agricultural industry better insight into current and future agricultural goods movement on the transportation system.
An objective of this project was to identify available data sources that, traditionally, are not used for transportation research or planning and develop approaches or methods to use the data. Meeting this objective, the research identified several national agricultural data sources that are publicly available, current, robust in terms of spatial and temporal granularity, and are frequently used by those in the agriculture industry. Because of this project, a methodology has been developed so that SDDOT, transportation professionals, and industry groups can use some of the same data to aid decision-making.
Before completing this project, SDDOT did not have any reliable means to estimate truck traffic directly due to crop production. The core goal of this project was to combine disparate data sources and determine a method to use agricultural data as an input to estimate freight-related transportation demand. During the course of this project, the project team successfully completed that goal and developed a process to use, among other sources, information on crop production and crop yields to estimate ESALs on the sub-regional level. Further, the project team developed a spreadsheet tool to assist in replicating the methodology developed through this research. This spreadsheet tool allows users to explore what if scenarios using estimates rather than relying on additional data collection and analysis activities. This new process and tool provides SDDOT with greater insight into the linkage between crop production and infrastructure needs allowing SDDOT to better plan, build, and maintain the State's transportation infrastructure.
Transferability of the Project
Although many of the details of this project are specific to South Dakota and the selected demonstration area, the approach and many of the publicly available data sources are scalable and transferable to other areas of the United States. The spreadsheet tool developed as part of this project further facilitates the project's transferability. Other users can re-purpose the existing spreadsheet tool to better understand agricultural goods movement in their jurisdiction. Users interested in adopting this process would need to collect both transportation and agricultural data, aggregated on the same geographic scale, and follow the approach described in the project's technical documentation.2
Lessons Learned
The project team learned several lessons throughout the course of this project, including:
- Several publicly available and national agricultural data sources can be used as inputs into the transportation planning process.
- Additional data regarding truck movement on the local transportation system would further enhance the new methodology.
- It is possible to combine transportation and agriculture datasets to develop a systematic approach that assists in making local transportation investment decisions.
The literature review and stakeholder interview process identified several robust data sources for agricultural data. These data sources are typically available at the Federal level and provide nationwide coverage, but previously had limited, if any, use in the transportation planning process. This project showed that these data sources can be useful to planning for agricultural goods movement and this success could be replicated in other States. It is important to recognize that the agriculture industry is dynamic based on a multitude of factors that can change from season to season. Transportation agencies looking to conduct similar projects should adapt practices to regularly collect and review agricultural data, to help understand current industry trends and improve accuracy in their forecasts.
While this project was successful in identifying, evaluating, collecting, and using a number of data sources, there were several data elements that the project team was not able to collect. Truck counts and roadway condition for the local transportation system were not available preventing the project team from completely understanding truck movement on the local system. The project team was able to overcome this challenge by using the existing data sources and estimating number of trucks per township using ESALs rather than number of trucks per specific roadway. More and better data on the local transportation system would have improved the results of this research demonstration. Likewise more detailed production data, such as better insight into how much production stays on-site or goes off-site and the timing of agricultural movements were not available to the project team and could have improved the project.
Finally, the demonstration in this project has shown that the approach and tool developed can combine transportation and agricultural data from publicly available data sources to assist in making local investment decisions. This methodology and tool provides SDDOT with a systematic approach to more easily prioritize future infrastructure projects based on a combination of crop production estimates and existing infrastructure conditions clearly highlighting areas that are expected to have high agriculture- related freight demand as well as a high need for transportation infrastructure improvements.
Next Steps
The data gaps for the local transportation system identified through this project have spurred future action items for SDDOT. SDDOT is now pursuing options to strengthen the data collection at the local level as well as monitor other innovative data sources that could provide coverage on the local transportation system.
SDDOT is looking to identify opportunities to further use the approach and spreadsheet tool developed during this project on local transportation planning applications. The version of the tool developed under this project successfully demonstrated that agricultural inputs could be used to estimate agricultural- related truck demand. Future efforts using this tool will assist SDDOT and its partners in evaluating the tool's capabilities, identifying tool improvements, and better understanding how the tool's outputs could be used for both day-to-day activities and investment decisions.
Conclusion
This project carefully examined how transportation practitioners could use readily available agriculture data to inform freight transportation planning. Ultimately, SDDOT developed and demonstrated a new methodology to estimate the impact of truck traffic at the sub-regional level based directly on agriculture- related data. Specific activities completed as part of this project included:
- Obtaining an understanding of agricultural trends and issues in South Dakota.
- Obtaining an awareness of existing data sources used in the State's agriculture industry.
- Developing an approach to integrate agricultural and transportation data sources.
- Testing and evaluating the approach in a real-world location.
- Developing a spreadsheet tool to streamline the process.
- Documenting the replicability of the approach to other agriculture scenarios and locations.
In addition to the outcomes of the research, this project identified gaps in existing data that, once filled, could improve the State's understanding of freight movement at the local level. SDDOT has identified several next steps that will close this data gap as well as further use and improve the spreadsheet tool.
Product Information
Product Title: SHRP2 C20: Innovations in Local Freight Data
Agency Name: South Dakota Department of Transportation
Contact Information:Name: David Huft
E-mail: Dave.Huft@state.sd.us
Phone: 605-773-3358
Resources
This section includes resources and related project documentation.
Technical Documentation
South Dakota Department of Transportation (2016), Agricultural Freight Data Improvement (Final Report), Study SD2014-09, Pierre, SD.
Data Sources
Table 4 shows the required data for each of the four steps of the traditional transportation planning process documented by the project team.
| Step | Required Data | Available Data, Source | Does Data Meet Requirements? | Can Data Be Adjusted? | ||
|---|---|---|---|---|---|---|
| Spatial | Temporal | Frequency | ||||
| Step 1 Generation. | Available land for planting (acreage per area). | USDA CropScape. | Yes, as user- defined area. | Yes, Annual. | No. | Further temporal adjustment may not be required as changes in available land are slow. |
| Corn crop yield (bushels per acre). | USDA NASS. | Partially Yes, Projections are national, although historical data exists at state and county level. | Yes, Annual. | No. | Further spatial and temporal adjustment may not be required as GMO improvements are slow and steady; Also, no adjustments being made for climate changes (drought, snow, etc.). | |
| Facility locations (by commodity). | Grain elevators (with/without rail access), Ethanol facilities, Other agricultural businesses. | Mostly Yes, geocoded addresses. | No. | No. | Missing year established data, this can however be determined. | |
| Facility total demand (by commodity). | Private company interviews, USDA NASS. | No. | Partially Yes, quarterly on- and off-farm storage stock levels at state level. | No. | Additional data collection or estimation effort would be needed to reach required spatial and temporal granularity. | |
| Step 2 Distribution. | Vector of bushels of crop produced by area. | Step 1 - Generation. | Not applicable. | Not applicable. | Not applicable. | Not applicable. |
| Vector of demand for bushels of crop by area or facility. | Step 1 - Generation. | Not applicable. | Not applicable. | Not applicable. | Not applicable. | |
| Commodity use (feed, ethanol, export, etc.). | Private company interviews, USDA NASS, FAF3. | Partially Yes, global, domestic & local trade partners. | Partially Yes, likely annual comm. uses at state level. | No. | Additional data collection or estimation effort would be needed to reach required spatial and temporal granularity. | |
| Facility capacity (bushels per facility). | Location capacity of grain elevators in bushels per year; capacity of ethanol facility in million gallons per year. | Mostly Yes, capacity for geocoded address locations. | Yes, annual average month. | Yes. | Further temporal adjustment may not be required as increase in facility capacity or facility closure can be explicitly handled. | |
| Price per crop per facility ($ per bushel). | USDA AMS, SDDOT Agriculture Department Data. | No. | Partially Yes, likely quarterly comm. sold at state level. | Yes. | If public data is insufficient, empirical data or assumptions to be identified. | |
| Cost of transportation between O-Ds ($ per bushel). | May be simplified. | No. | No. | No. | As public data is unavailable, empirical data or assumptions to be identified. | |
| Step 3 Mode Choice. | O-D matrix of bushels moved between locations | Step 2 - Distribute | Not applicable. | Not applicable. | Not applicable. | Not applicable. |
| Available transportation network. | Road network by functional class and rail system and sidings/yards. | Yes. | Static. | Yes. | Temporally may not be required as changes in network can be explicitly handled. | |
| Cost of transportation by mode ($ per mode, by location pairs). | May be simplified. | No. | No. | No. | As public data is unavailable, empirical data or assumptions to be identified. | |
| Vehicle capacity (bushels per truck, bushels per railcar). | Best practice assumption, truck size trends from SDDOT traffic data. | No. | Yes. | Yes. | Spatially may not be required as variance is likely to be small. | |
| Step 4 Assignment. | Matrices of number of trucks between each O-D pair. | Step 3 - Mode Choice | Not applicable. | Not applicable. | Not applicable. | Not applicable. |
| Route between each O-D pair. | Estimate but may be simplified, SDDOT traffic data based truck fleet mix and variations by roadway type and/or by time of year. | Route assignment based on available connections between cropland, facilities and markets while using roadway functional class as impedance. | Timing based on estimated monthly on- and off-farm storage stock levels at local level. | No. | Cropland centroids may need to be identified; Traffic counts to be used for estimation of background truck traffic and validation of agricultural freight truck flows. | |
| Proportion of each road type within an area that is available for truck movements (percent of each road type, by area). | Assigned agricultural freight truck flows by time of year, SDDOT pavement surface roughness index by roadway segment. | Aggregation of truck miles by roadway functional class and pavement type (paved/ unpaved). | Estimated monthly truck miles. | No. | Adjust contribution of agricultural freight trucks to pavement surface roughness by roadway segment. | |
• AMS: Agricultural Marketing Service. • FAF3: Freight Analysis Framework 3. • GMO: genetically modified organism.
• NASS: National Agricultural Statistics Service. • O-D: Origin-destination. • SDDOT: South Dakota Department of Transportation.
• USDA: United States Department of Agriculture.
Interview Questions
This section includes the interview questions developed as part of this project to guide the stakeholder interviews. The questions are organized by stakeholder and by topic.
Agricultural Stakeholder Questions
General Questions
- Describe your organization and your role in the organization.
- Provide a simple description of the various process stages of a typical facility such as yours.
- How important are transportation and storage activities to your business operations?
- What are some of the advantages or disadvantages of your location of business? How can this be improved?
Questions Related to Trade, Transportation and Storage Decisions
- Describe the key commodities shipped and received by your business.
- What are the key markets for commodities shipped from your business, and how do you transport and store?
- What are the key markets for commodities received by your business, and how do you transport and store?
- What portion of your transportation is rail vs truck? Has this changed over time? Why?
- What size of trucks do you use - weight or axle distribution? Has this changed over time? Why?
- What is current grain storage mix - on-site, aggregator site, rail served elevator, etc.? Why do you chose to store in this way? Has this changed over time? Why?
Questions Related to Transportation and Storage Data Resource
- Do you use SDDOT's transportation and storage system GIS data? If yes, do you think it is accurate for your purpose?
- What other types of transportation and storage facilities location data does your business have? Would you be willing to share some of this data with the State?
- What are your key transportation and storage system needs and issues? What data resources do you have to identify and quantify them and apply for local, tribal and state funding? Would you be willing to share some of this data with the State?
- Has your business location collected any traffic counts or storage inventory, or conducted any market assessment and financial feasibility studies in the past decade? Would you be willing to share some of this data with the State?
- Has your organization applied for a conditional use permit at any of its business locations? If yes, what type of traffic volume, route, and pavement and environmental impact restrictions are stipulated in the conditional use permits?
Questions Related to Future Agricultural Production/Attraction
- What factors and data resources do you use for deciding the size and location of a new facility? Would you be willing to share some of this data?
- What are some of the major market, sourcing, mode, productivity and technology changes that you expect to affect your business? How do you measure and monitor their trends?
Concluding General Questions
- Are you aware of any relevant research, study, plan or other documents and websites that can help us with our research?
- Can you suggest any names of relevant people with in-depth knowledge on our research topic that we can speak to?
Transportation Stakeholder Questions
General Questions
- Describe your organization and your role in the organization.
- What are some of your key investment and policy programs and decision processes? What transportation and storage related data do you currently use for these purposes?
- How does your organization use the freight transportation system in South Dakota? Do you actively quantify and monitor this?
- If better information on truck demand (current and future) were available, how would you use it?
Questions Related to Transportation and Storage Decisions
- Can you talk about what transportation data and information your business or agency relies on regularly? Do you currently use any data or information from SDDOT or other public sources in your operations? Do you subscribe to any private data services or use related software?
- Do you use SDDOT's transportation and storage system GIS data? If yes, does it suit your needs?
- Do you maintain your own data regarding transportation and/or agriculture related facilities? If so, would you be willing to share it for the purposes of this project? Do you use third-party data on transportation and/or agriculture related facilities?
- What are your key transportation and storage system needs and issues? What data resources do you have to identify and quantify them to develop projects and programs, plans and grant applications? Would you be willing to share some of this data with the State?
- Has your agency collected any traffic counts or storage inventory or historical and tribal preservation sites inventory, or conducted any freight project related traffic impact or economic feasibility or policy studies in the past decade? Would you be willing to share some of this data with the State?
- If a tribal or local agency, has your organization approved a conditional use permit to any business locations? If yes, what type of traffic volume, route, and pavement?
Questions Related to Future Agricultural Economic Development, Agricultural Freight Investment and Policy Decisions
- Are there data and resources that could benefit your business/agency and support economic development? Can better transportation and storage data resources can be incorporated into your future agricultural economic development, freight investment and policy decision processes?
- Are you aware of business incentives in your jurisdiction? Are there any restrictive policies that inhibit economic growth? What are the taxes and fees that businesses have to pay in your jurisdiction? Can you express these quantitatively, e.g. per square foot of land or facility?
- What are some of the major national and state policy changes and changes in the business atmosphere that you expect to affect future economic development opportunities, agricultural freight program levels and decision processes? How do you measure and monitor their trends?
Concluding General Questions
- Are you aware of any relevant research, study, plan or other documents and websites that can help us with our research?
- Can you suggest any names of relevant people with in-depth knowledge on our research topic that we can speak to?
- How could this project best benefit your organization, if at all?
1 South Dakota Department of Agriculture. "South Dakota Agriculture - Facts & Impact." Pierre, SD. Retrieved from http://sdda.sd.gov/education-outreach/agriculture-industry/, last accessed February 22, 2016. [ Return to note 1. ]
2 South Dakota Department of Transportation (2016), Agricultural Freight Data Improvement (Final Report), Study SD2014-09, Pierre, SD. [ Return to note 2. ]
FOR MORE INFORMATION
David Huft
Research Program Manager & ITS Coordinator
South Dakota Department of Transportation
Phone: 605-773-3358
E-mail: Dave.Huft@state.sd.us
Birat Pandey
FHWA-Office of Operations
Phone: 202-366-2842
E-mail: Birat.Pandey@dot.gov
Learn more about the SHRP2 program, its Capacity focus area, and Freight Demand Modeling and Data Improvement (C20) products at https://www.fhwa.dot.gov/GoSHRP2/

The second Strategic Highway Research Program (SHRP2) is a partnership of the Federal Highway Administration (FHWA), the American Association of State Highway and Transportation Officials (AASHTO), and the Transportation Research Board (TRB). TRB completed the research, and now FHWA and AASHTO are jointly implementing the resulting SHRP2 Solutions that will help the transportation community enhance productivity, boost efficiency, increase safety, and improve the reliability of the Nation's highway system.
STRATEGIC HIGHWAY RESEARCH PROGRAM
U.S. Department of Transportation Federal Highway Administration
American Association of State Highway and Transportation Officials – Transportation Research Board