Farm to Markets: Innovative Data Analysis to Enhance Agricultural Freight Connectivity
Printable Version [PDF, 1.4 MB]
You may need the Adobe® Reader® to view the PDFs on this page.
Contact Information: Freight Feedback at FreightFeedback@dot.gov

U.S. Department of Transportation
Federal Highway Administration
Office of Operations
1200 New Jersey Avenue, SE
Washington, DC 20590
FHWA-HOP-16-090
August 2017
BACKGROUND AND CHALLENGES
Recipient Agency: South Dakota Department of Transportation
Location: South Dakota
Duration of Activity: 2014 to 2016
Budget: $150,000
In South Dakota, freight growth is closely linked to agricultural production. Recent advancements in plant genetics and technology have boosted production of many of the State's key crops.
The South Dakota Department of Transportation (SDDOT) takes the movement of agricultural goods into consideration as it invests in expanding and improving transportation infrastructure across the State. However, the dynamic nature of the industry has complicated the use of agricultural data in transportation system decision-making.
Given the importance of agricultural products to the State, SDDOT sought and received assistance from the SHRP2 C20 program to conduct research on a framework to allow data on agriculture output to better inform transportation planning.
APPROACH
Project goals included:
- Obtain an understanding of agricultural trends and issues in South Dakota.
- Obtain an awareness of existing data sources used in the State's agriculture industry.
- Develop an approach to integrate agricultural and transportation data sources.
- Test and evaluate the approach in a real-world location.
- Document the replicability of the approach for use in other agriculture scenarios and locations.
| Objective | Work Approach | Outcomes |
|---|---|---|
| Document South Dakota agriculture trends. | Conduct literature review. | Better understanding of major agriculture trends in South Dakota as well as applicable data sources. |
| Identify data purposes. | Interview agriculture and transportation stakeholders. | Short- and long-term purposes for improved agricultural freight data. |
| Define data needs and sources. | Develop a list of ideal data requirements and a list of available data sources. | List of most promising data sources and identification of existing data gaps. |
| Develop and test a proof of concept. | Synthesize data, identify study area, test new analytical methods, and document work products. | A transferable framework that can be used to support transportation planning questions related to agricultural activities. |
BENEFITS AND IMPACTS
Key elements that contributed to project outcomes and subsequent impacts include:
- Multi-disciplinary project panel.
- Stakeholders from both the transportation and agriculture industries interested in sharing thoughts and experiences through interviews with the project team.
- Robust, publicly-available agriculture data.
Resources generated by the project include:
- Insight into the State's agricultural trends and potential application to transportation.
- Identification of agriculture data sources that could be used in the transportation planning process.
- Identification of data requirements for using agricultural data in travel demand forecasting.
- Spreadsheet tool to apply the research approach.
- Documentation to be used in scaling and transferring the research approach .
Benefits
Benefits realized from this project include the ongoing use of the resources it created as well as the changes it may influence in stakeholder behavior. Specific outcomes are listed below:
| Outcome | Evidence |
|---|---|
| Consistent "world view" | SDDOT, transportation professionals and industry groups now use some of the same data for decision- making. The research identified several national agricultural data sources that are publicly available, current, robust in terms of spatial and temporal detail, and are frequently used by those in the agriculture industry. |
| Accessibility and insight | A process is now in place through which crop production and crop yields, among other data, can be used by transportation planners to estimate Equivalent Single Axle Loads (ESALs) on the sub-regional level. (See Figure 1). |
| Dialogue | Stakeholder interviews yielded data resources that help agency personnel assess, maintain, invest in and develop the transportation system. Enhanced transparency about agency operations informs truck and rail operations and agricultural industry decisions, such as site selection for grain elevators and other facilities. |
| Mapping data to priorities | A matrix has been developed linking and assessing available agriculture data sources to a 4-step freight transportation framework (i.e., generation, distribution, mode choice, and assignment). |
| Improving local data | Project research identified gaps in truck count and roadway condition data at the local level, increasing SDDOT interest in strengthening local data collection efforts. |
Impacts
Impact measures are the ultimate benefits of using a product. These are longer-term, value-added impacts of the product related to saving time, money, lives.
| Impact | Application |
|---|---|
| Replicable method for integrating dynamic industry data. | The methodology used in this project can be adapted to help agencies in other States leverage existing agricultural data for improved transportation planning. |
| Better support for local movement of agricultural goods. | The new data set and research approach allow SDDOT and local planners to better forecast and plan infrastructure improvements to support agricultural goods movement at the local level. |
| Continuing evolution of research. | Project partners continue to evaluate the research approach, the spreadsheet tool's capabilities and opportunities for improvement, and ways to enhance the use of its outputs in both day-to-day activities and investment decisions. |
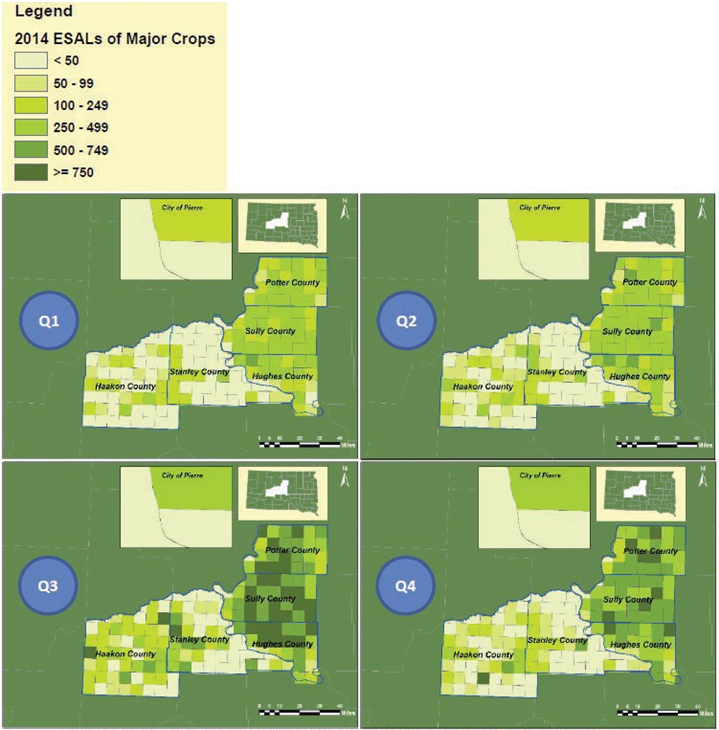
Figure 1. Demonstration Results for the Baseline Year.
Source: USDA National CDL data, USDA NASS data, ESRI and SDDOT GIS data, Agar WIM data, UGPTI, North Dakota Strategic Freight Analysis – Truck Size and Weight Issues in North Dakota, Final Report for North Dakota Department of Transportation, July 2007, David L. Huft, Considerations for Imposing Local Restrictions, SDDOT, Research Note, last updated on Feb 12, 2014, and UGPTI and Cambridge Systematics Analysis.
| Stakeholder Type | Potential Purposes/Applications | ||||||
|---|---|---|---|---|---|---|---|
| Truck/Rail Demand (current, future) | Assess System Condition, Performance and Local Impacts (e.g., pavement, quality of life) | Determine Maintenance Needs (e.g., pavement mgmt, resurfacing) | Inform Maintenance and Design Standards (e.g., bridge/ pavement design; geometric/ structural considerations) | Determine Large Investment Need (e.g., multimodal, roadway construction) | Prioritize Investments (multimodal, inform STIP) | Grain Elevator and Other Facility Site Selection/ Evaluation | |
| SDDOT | |||||||
| Local Road Agency | |||||||
| Private Sector | |||||||
PARTNERSHIPS
North Dakota Department of Transportation (NDDOT) – Technical panel member.
South Dakota Association of Cooperatives – Technical panel member.
South Dakota Department of Agriculture – Technical panel member.
South Dakota Department of Transportation (SDDOT) – Technical panel member.
Federal Highway Administration (FHWA) – Provided coordination support as well as technical and administrative guidance.
FOR MORE INFORMATION
David Huft
Research Program Manager & ITS Coordinator
South Dakota Department of Transportation
Phone: 605-773-3358
E-mail: Dave.Huft@state.sd.us
Birat Pandey
FHWA-Office of Operations
Phone: 202-366-2842
E-mail: Birat.Pandey@dot.gov
Learn more about the SHRP2 program, its Capacity focus area, and Freight Demand Modeling and Data Improvement (C20) products at www.fhwa.dot.gov/GoSHRP2/

The second Strategic Highway Research Program (SHRP2) is a partnership of the Federal Highway Administration (FHWA), the American Association of State Highway and Transportation Officials (AASHTO), and the Transportation Research Board (TRB). TRB completed the research, and now FHWA and AASHTO are jointly implementing the resulting SHRP2 Solutions that will help the transportation community enhance productivity, boost efficiency, increase safety, and improve the reliability of the Nation's highway system.
STRATEGIC HIGHWAY RESEARCH PROGRAM
U.S. Department of Transportation Federal Highway Administration
American Association of State Highway and Transportation Officials – Transportation Research Board