Transportation Systems Management and Operations and Performance Based Practical Design Case Study 5: Demonstrating Performance-Based Practical Design through Analysis of Active Traffic Management
Printable Version [PDF, 1.5 MB]
U.S. Department of Transportation Publication #: FHWA HOP-16-087 September 2016 Purpose of the Transportation Systems Management and Operations Performance-Based Practical Design Case Study Series and Summary of Case Study 5As states and local agencies become increasingly challenged with addressing their system performance, mobility, and safety needs in the current era of financial limitations, Federal Highway Administration (FHWA) is providing guidance, delivering technical assistance, and sharing resources related to performance-based practical design (PBPD). The FHWA Office of Operations is supporting the overall Agency PBPD effort by highlighting the role transportation systems management and operations (TSMO) alternatives and analysis tools can play in supporting PBPD. To illustrate the range of TSMO strategies and tools and how they can be applied by transportation planners and designers in a PBPD context, five case studies were developed. This Case Study 5 illustrates how a PBPD approach be used to analyze and make tradeoffs when examining potential Active Traffic Management (ATM) strategies (as shown in Table 1) along freeways, as was done in developing ATM recommendations, a Concept of Operations and an ATM Implementation Plan for the New Jersey Department of Transportation (NJDOT). Other case studies in this series include implementing of high-occupancy toll (HOT) lanes, urban freeway reconstruction/ modernization, regional performance-based planning, and the use of alternative intersections on arterials. Case Study BackgroundATM strategies have been receiving significant attention of late given the operational benefits that have accrued, coupled with their reduced costs and implementation timeframes relative to more traditional improvements, such as geometric enhancements to the roadway network. Furthermore, ATM operational benefits can help to achieve one or more regional, system, and project goals, such as safety, mobility, reliability, environmental, and accessibility.
The Federal Highway Administration (FHWA) recently developed an Active Traffic Management Feasibility and Screening Guide (the Guide) to assist transportation agencies and planning organizations with making informed investment decisions by determining the feasibility of ATM strategies before committing significant resources towards any subsequent project development and design activities. The Guide presents a recommended process and series of steps for agencies to follow as they consider ATM deployment at the feasibility and screening analyses level. Following are key activities of the Guide:
These activities strongly parallel the various PBPD concepts, including aligning the recommendations with regional and system goals, emphasizing needs and objectives when scoping and developing ATM projects, focusing on performance improvements and associated benefits, and using performance tools and analysis techniques to evaluate alternatives in terms of their value and return on investment (discussed in greater detail below). The Guide was the basis for analyzing potential ATM strategies and identifying segments along NJDOT's limited access roadway network—comprising more than 700 directional miles—that would most likely benefit from the application of ATM strategies, resulting in recommendations and a Concept of Operations for initial ATM implementation projects that would be relatively easy to implement and provide the greatest possible benefits (i.e., "most bang for the buck"), thereby setting the stage for subsequent ATM deployments along other segments in the state. Corridor and System Needs and ObjectivesPBPD strengthens the emphasis on planning-level corridor or system performance needs and objectives when planning, scoping, and developing individual projects.The initial activities of the ATM feasibility and screening process include aligning potential ATM strategies with regional (and statewide) goals and objectives, as well as project-specific performance needs. Table 2 was developed for NJDOT to show how the various ATM strategies addressed in the project would also support the transportation goals, and the associated needs and issues, identified in the Statewide Strategic Transportation Systems Management and Operations (TSMO) Plan. (Note: The ATM strategy of adaptive ramp metering was not included due to potential institutional issues.) DSpL = Dynamic Speed Limits; DLA = Dynamic Lane AssignmentDShL = Dynamic Shoulder Lanes; DJC = Dynamic Junction Control Performance ImprovementsPBPD focuses on performance improvements that benefit both project and systemwide needs. Projects are scoped to achieve the purpose and need.ATM strategies, such as dynamic speed limits, dynamic lane assignment, and queue warning, have demonstrated performance improvements—particularly in terms of reduced crashes—in numerous deployments. Dynamic shoulder lanes and dynamic junction control strategies, by adding temporary capacity, are proven approaches for reducing congestion and may also enhance safety. However, these and other ATM strategies may not be appropriate to all roadway segments. For the New Jersey limited-access roadway network, NJDOT conducted an initial screening to identify specific roadway segments where ATM strategies would likely provide the greatest benefits (and also helping to reduce the number of miles subject to a more detailed analysis). This screening included both quantitative and qualitative assessments using readily available data coupled with the local knowledge of several ATM stakeholders. The project area was first divided into 5- to 20-mile bidirectional segments, with major interchanges generally being the end and start points for each segment. These were evaluated and screened focusing on several performance considerations, including the following:
In addition to segments that had the highest scores for safety or congestion, all scores noted above were summed and identified a few additional segments for more detailed analysis. A more detailed data-based analysis was conducted on roadway segments identified during the initial screening process to define the specific links (i.e., mileposts and interchanges) and associated ATM strategies to be deployed on these links. This was accomplished by analyzing time-space plots of recurring congestions and crash history tables, with the latter focusing on rear-end and sideswipe crashes. The data analyses were supplemented by field reviews (e.g., could the existing roadway footprint accommodate temporary use of the shoulder as a travel lane, sight distance considerations for ATM signage visibility). Greater Return on InvestmentsBy scrutinizing each element of a project's scope relative to value, need, and urgency, a PBPD approach seeks a greater return on infrastructure investments.Implementing ATM strategies can involve significant capital costs—such as frequently spaced gantries and dynamic message signs—followed by ongoing operations and maintenance requirements. As such, some ATM strategies may not be cost effective for certain segments and links of the surface transportation network. A benefit-cost analysis was, therefore, performed for those roadway links and ATM strategies where likely performance improvements had been identified. Several ATM options were analyzed:
Benefits were estimated based on conservative assumptions of the percent decrease in crashes and congestion resulting from implementing ATM strategies. These assumptions were based on the results from other ATM implementations, with the hybrid approaches resulting in slightly less benefits relative to the full gantry approaches. Benefits and costs were calculated using a 15-year life-cycle. While the resulting benefit-cost ratios were an important factor in identifying the optimum segments for initial ATM deployment in New Jersey, other considerations were also addressed, included the following:
The final recommendation for the initial ATM projects in New Jersey were to implement dynamic speed limits, dynamic lane assignment, and queue warning on along I-287, I-80, or both, using a hybrid approach. These segments generally have the highest benefit-cost ratios (Table 3) and positive ratings in other considerations. Dynamic shoulder lanes could be added at a later date.
Design Standards and Regulatory RequirementsPBPD can be implemented within the Federal-aid Highway Program regulatory environment using existing flexibility.Figure 1 shows the recommended gantry layout for New Jersey, incorporating dynamic speed limits (actually advisories rather than legal limits), dynamic lane assignment, and queue warning strategies—a full span over one direction of the roadway, with speed and lane control displays situated over each travel lane. Another display can be added over the shoulder if and when using the shoulder as a travel lane is implemented. Speed displays are also installed on the gantry support poles on both sides of the roadway. 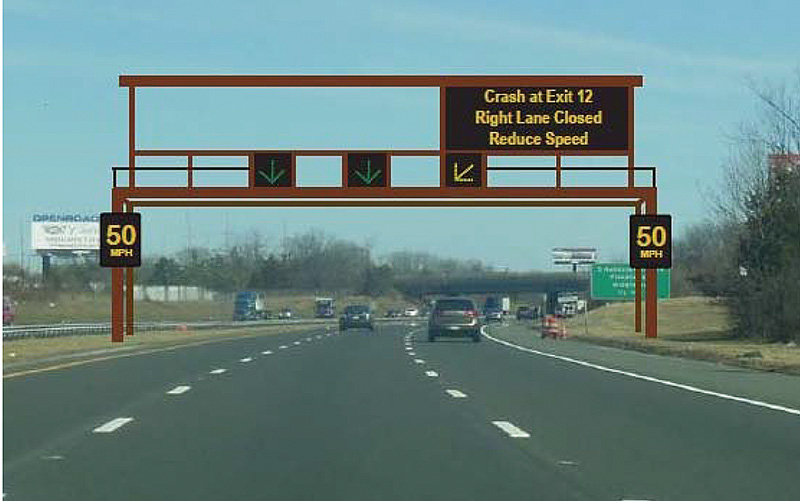
Figure 1. Graphic: Recommended Active Traffic Management Gantry Layout for New Jersey. As the speed advisory and lane assignment displays (specifically the yellow diagonal arrow shown in Figure 1) do not conform to the Manual on Uniform Traffic Control Devices (MUTCD), it will be necessary for NJDOT to request approval from FHWA of an "experiment" to use the nonstandard sign displays. According to the MUTCD, "a successful experiment is one where the research results show that the public understands the new device or application, the device or application generally performs as intended, and the device does not cause adverse conditions." Other Design ConsiderationsATM strategies, and TSMO in general, may be used to support other PBPD-related activities. One example is the "design exception" process whenever a recommended design—identified as part of a PBPD approach—deviates from nationally recognized criteria such as the American Association of State Highway and Transportation Officials (AASHTO) "Green Book3." When the minimum (or maximum) values of any controlling criteria are not met, the recommended alternative must be documented as a "design exception" and evaluated for formal approval by FHWA. For example, a design exception will likely be required if the PBPD- based analysis results in a recommendation that involves adding capacity by narrowing freeway lanes to less than 12 feet in width and/or narrowing shoulders to less than 10 feet in width. Under these circumstances, ATM strategies such as dynamic speed limits and queue warning may be included in the recommendation (and in the design exception documentation) as a means to reduce speeds and provide warnings in advance of freeway segments with narrow lanes, limited shoulder widths, or reduced sight distance. Another potential example is including dynamic lane assignment when designing and operating part-time (or full-time) shoulder use. The signs can be used to dynamically close the shoulder under several scenarios, such as debris or disabled vehicle in the shoulder or a closed shoulder (and perhaps other lanes) to permit emergency vehicles to more quickly reach a crash scene (from either direction) and subsequently to support on-scene operations. Performance-Based Practical DesignPBPD encourages evaluating the performance impacts of highway design decisions relative to the cost of providing various design features. PBPD can be articulated as modifying a traditional design approach from a "top-down," standards-first approach to a "design-up" approach where transportation decision- makers exercise engineering judgment to build up the improvements from existing conditions to meet both project and system objectives. Following a PBPD approach can help make more efficient use of scarce resources so that a greater number of improvements can be made. Notable attributes of PBPD include the following:
ContactsGeorge Merritt
Jim Hunt
Robert Mooney
1Including ATM infrastructure during a roadway reconstruction effort can help reduce overall costs. Additionally, ATM strategies may also effectively provide work zone traffic control benefits on the segment undergoing reconstruction as well as alternate routes.
| ||||||||||||||||||||
|
United States Department of Transportation - Federal Highway Administration |
||