Developing PhillyFreightFinder: Regional Data Clearinghouse and Online Mapping Application
Printable Version [PDF 747 KB]
You may need the Adobe® Reader® to view the PDFs on this page.
Contact Information: Operations Feedback at OperationsFeedback@dot.gov

U.S. Department of Transportation
Federal Highway Administration
Office of Operations
1200 New Jersey Avenue, SE
Washington, DC 20590
FHWA-HOP-16-079
August 2017
BACKGROUND AND CHALLENGES
Recipient Agency: Delaware Valley Regional Planning Commission
Location: Pennsylvania and New Jersey
Duration of Activity: 2014 to 2016
Budget: $150,000
When the Delaware Valley Regional Planning Commission (DVRPC) launched the PhillyFreightFinder application in 2013, it established a structured program to collect and integrate freight-related data into a single location. The launch of PhillyFreightFinder represented the first step in DVRPC's undertaking to develop a centralized data clearinghouse and online mapping application.
DVRPC, which serves as the metropolitan planning organization (MPO) for the nine counties surrounding Philadelphia, Pennsylvania, then sought to enhance and expand PhillyFreight- Finder for internal planning purposes as well as to help meet the needs of public and private sector freight partners. DVRPC sought and received funding from the Strategic Highway Research Program 2 (SHRP2) C20 Implementation Assistance Program to do so, updating its underlying data, developing new processes for importing data, refining the mapping application, and adding options for data visualization.
APPROACH
This project's goals include:
- Update and expand freight datasets and refine procedures for data integration.
- Improve online data visualization capabilities to enhance stakeholder understanding and engagement.
- Create documentation to make the platform accessible as an open source tool for use and customization by other organizations.
| Objective | Work Approach | Outcomes |
|---|---|---|
| Identify and assess available data sources. | Conduct a scan of available data sources and evaluate data sources with support of the project steering committee. | A prioritized list of data sources for data collection. |
| Collect data and update freight database. | Work with project partners and other stakeholders to collect, parse, and add data to database. | Comprehensive and detailed database. |
| Enhance data visualization. | Prioritize and implement data visualization tools. | Ability to more easily communicate freight-related trends in the region. |
| Share experience. | Develop open source documentation. | Publicly available open source freight data mapping tool. |
BENEFITS AND IMPACTS
Key elements that contributed to project outcomes and subsequent impacts include:
- Successful recent experience with collaboration between public and private freight stakeholders in the region, including support of the Delaware Valley Goods Movement Task Force (DVGMTF).
- A committed and active project steering committee.
- A well-vetted collection plan, including five key data types: (1) freight network supply, (2) freight activity, (3) freight economic data, (4) commodity, and (5) freight performance measures.
Resources generated by the project include:
- A more reliable, single-source database housing various freight-related datasets.
- A comprehensive assessment of available data sources.
- A detailed plan and improved methods for continued collection and updating of MPO data.
- Updated processes and tools for using and sharing the data.
- A well-documented, open source version of the application for use by peer MPOs.
Benefits
Benefits realized from this project include the ongoing use of the resources it created as well as the changes it may influence in stakeholder behaviors. Specific outcomes are listed below:
| Outcome | Evidence |
|---|---|
| Updates to the PhillyFreightFinder application | As a result of this project, three new tools were added to the application:
|
| OpenFreightApp | An open source version of PhillyFreightFinder was developed, with documented integration and use options.
|
| Data Visualization Tools | Data display options to more effectively educate and engage all audiences in the need for freight transportation-related planning and projects. |
Impacts
Impact measures are the ultimate benefits of using a product. These are longer-term, value-added impacts of the product related to saving time, money, and lives.
| Impact | Application |
|---|---|
| Better understanding of goods movement in the region. | Better plan, model, and prioritize projects; identify freight and land use considerations. |
| Insight into freight's role in the region's economic development. | Ability to collect and include freight economic data in regional analysis and decision-making. |
| Establishment of freight performance measures. | Identify freight-specific bottlenecks and problem locations for select commodities and industries. |
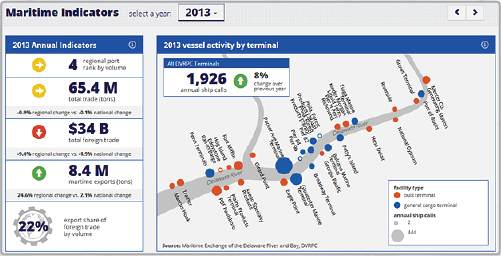
Source: Delaware Valley Regional Planning Commission (2016). PhillyFreightFinder – Maritime Indicators. Philadelphia, PA. Retrieved from http://www.dvrpc.org/webmaps/phillyfreightfinder/#maritime-indicators, last accessed October 19, 2016.
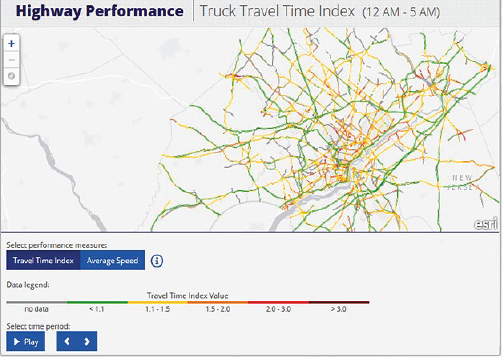
Source: Delaware Valley Regional Planning Commission (2016). PhillyFreightFinder – Highway Performance. Philadelphia, PA. Retrieved from http://www.dvrpc.org/webmaps/phillyfreightfinder/#highway-performance, last accessed October 19, 2016.
PARTNERSHIPS
Delaware Valley Goods Movement Task Force – Served as freight advisory committee. (Led by DVRPC. Gives private sector freight stakeholders input into transportation planning process.)
Maritime Exchange for the Delaware River and Bay – Data provider.
New Jersey Department of Transportation – Data provider.
Pennsylvania Department of Transportation – Data provider.
Select Greater Philadelphia – Data provider.
Federal Highway Administration (FHWA) – Provided coordination support as well as technical and administrative guidance.
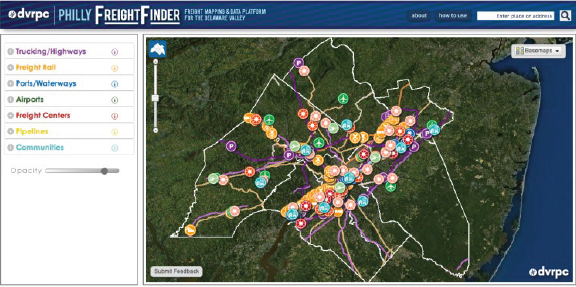
Source: Delaware Valley Regional Planning Commission (2016). PhillyFreightFinder – Network Map. Philadelphia, PA. Retrieved from http://www.dvrpc.org/webmaps/phillyfreightfinder/#map, last accessed October 19, 2016.
FOR MORE INFORMATION
Fang Yuan
Principal Transportation Engineer
Office of Freight and Aviation Planning
Phone: 215-238-2885
E-mail: fyuan@dvrpc.org
Michael Ruane
Transportation Planner
Office of Freight and Aviation Planning
Phone: 215-238-2888
E-mail: mruane@dvrpc.org
Birat Pandey
SHRP2 Freight Implementation Specialist
FHWA - Office of Freight Management and Operations
Phone: 202-366-2842
E-mail: Birat.Pandey@dot.gov
Learn more about the SHRP2 program, its Capacity focus area, and Freight Demand Modeling and Data Improvement (C20) products at www.fhwa.dot.gov/GoSHRP2/
The second Strategic Highway Research Program (SHRP2) is a partnership of the Federal Highway Administration (FHWA), the American Association of State Highway and Transportation Officials (AASHTO), and the Transportation Research Board (TRB). TRB completed the research, and now FHWA and AASHTO are jointly implementing the resulting SHRP2 Solutions that will help the transportation community enhance productivity, boost efficiency, increase safety, and improve the reliability of the Nation's highway system.
STRATEGIC HIGHWAY RESEARCH PROGRAM
U.S. Department of Transportation Federal Highway Administration
American Association of State Highway and Transportation Officials – Transportation Research Board