PDF
Version of This Report [133KB] ![]()
PDF Files may be viewed with Adobe
Acrobat Reader

Measuring Travel Time in Freight-Significant Corridors
American businesses and households depend on the reliable movement of goods. U.S. freight carriers moved over 15 billion tons worth more than $9 trillion in 1998. Trucks carried about 70 percent of the tonnage and nearly 80 percent of the value. In 2020, the volume of freight moved on the U.S. transportation system is expected to increase to 25 billion tons, worth about $30 trillion.
As the demand for goods and services increases, so does the amount of truck traffic on the nation's highways. Vehicle miles traveled by truck are expected to increase over 3 percent per year through 2020, compared with 2.5 percent for passenger vehicles. Peak-period congestion affected 28 percent of urban portions of the National Highway System in 1998 and is expected to affect 46 percent in 2020. Congestion is likely to spread from urban areas to intercity routes such as I-5 between Southern California and the San Francisco Bay Area, I-95 in the Northeast, I-70 across Missouri, and I-10 between San Antonio and Houston.
Reduced cycle times and shifts by manufacturers and distributors to just-in-time management of those goods magnify the importance of a reliable transportation system. Research on the trucking industry shows that shippers and carriers value transit time at $25 to $200 per hour, depending on the product being carried. Unexpected delays can increase that value by 50 to 250 percent. Timely, reliable goods movement allows businesses to reduce manufacturing and inventory costs and to improve responsiveness to rapidly changing markets and consumer desires.
The Federal Highway Administration (FHWA) recognizes that the timely and reliable movement of trucks is critical to the economy and a key element of the Department of Transportation's goal to support global connectivity. To better understand how the surface transportation network is accommodating this demand, FHWA launched the Freight Performance Measurement initiative to monitor travel times in freight-significant corridors and delays at major border crossings.
In 2002, FHWA established a partnership with the American Transportation Research Institute (ATRI) to determine whether and how information derived from communications technologies used by the freight industry could provide FHWA with data to support the measurement of freight performance on the surface transportation system. During the initial two phases of the Performance Measurement initiative, ATRI worked with technology vendors and commercial carriers to demonstrate that location data from communications technologies can be used to derive measures of travel time and reliability.
After removing all information except time and location from the technology vendor's satellite data stream, ATRI measured average travel rates for five freight-significant corridors—I-5, I-10, I-45, I-65, and I-70 (Table 1). The data were used to derive average travel rates and two additional measures, a Travel Time Index (TTI) and a Buffer Index (BI). TTI, a measure of mobility, is the ratio of observed average speed to free flow travel time (estimated at 60 miles per hour). BI, a measure of reliability and variability, measures how much extra time one should allow to account for variations in the system. Table 2 summarizes three months of preliminary data for the five corridors. Applying BI data to a freight flow scenario, a commercial vehicle operator moving goods from one end of I-5 (San Diego, CA) to the other end (Blaine, WA) would have to add approximately 6 hours of buffer time to ensure, with 95 percent confidence, that the driver would arrive on time.
Phase III, now underway, focuses on continuing data collection and analysis for the initial five corridors. FHWA expects to have one full year of data for the five corridors by January 2006. Phase III also explores the use of other technologies, such as electronic toll collection and weigh-in-motion equipment to supplement GPS measurement, expands travel time measurement to other freight-significant corridors, and initiates the border delay measurement component of the project.
FHWA believes this initiative will provide key information on transportation system performance and, when used in conjunction with urban congestion measures, can paint a clearer picture of system-wide performance.
| Interstate Corridor | States on Route | Major Cities on Route | Total Miles |
|---|---|---|---|
| I-5 | California, Oregon, Washington | San Diego, Los Angeles, Portland, Tacoma, Bellingham, Olympia, Seattle | 1,381 |
| I-10 | California, Arizona, New Mexico, Texas, Louisiana, Mississippi, Alabama, Florida | Los Angeles, Phoenix, Las Cruces, El Paso, Houston, Beaumont, San Antonio, New Orleans, Gulfport, Mobile, Pensacola, Tallahassee, Jacksonville | 2,460 |
| I-45 | Texas | Galveston, Houston, Dallas | 285 |
| I-65 | Alabama, Tennessee, Kentucky, Indiana | Indianapolis, Louisville, Nashville, Birmingham, Montgomery, Mobile | 887 |
| I-70 | Utah, Colorado, Kansas, Missouri, Illinois, Indiana, Ohio, W. Virginia, Pennsylvania, Maryland | Cove Fort, Denver, Topeka, Kansas City, St. Louis, Indianapolis, Springfield, Wheeling, Breezewood, Hagerstown, Frederick, Baltimore | 2,153 |
| Corridor | Average Speed (miles per hour) | Travel Time Index (TTI) | Buffer Index (BI) |
|---|---|---|---|
| I-5 | 48.43 | 1.24 | 19.89 |
| I-10 | 54.00 | 1.11 | 24.85 |
| I-45 | 54.46 | 1.10 | 4.48 |
| I-65 | 55.71 | 1.08 | 5.69 |
| I-70 | 52.75 | 1.14 | 16.16 |
BI=(95th percentile travel rate—average travel rate)/average travel rate x 100%.
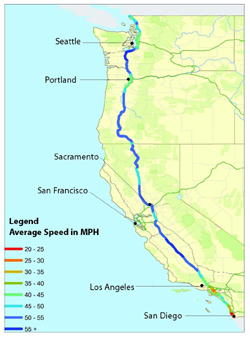
Interstate 5
Average Speed for Trucks
10 Mile Segments, April-June 2004, 3PM - 7PM
|
For More Information, Please Contact Jeff Purdy Federal Highway Administration Office of Freight Management and Operations 202-366-6993 Jeff.Purdy@dot.gov April 2005 FHWA-HOP-05-036 EDL 14126 |
U.S. Department of Transportation Federal Highway Administration 
|
|
Office of Freight Management and Operations, 400 7th Street, SW, Room 3401, Washington, D.C. 20590
http://www.ops.fhwa.dot.gov/freight/, Toll-free help-line 866-367-7487 |
|