Comprehensive Truck Size and Weight Limits Study: Pavement Comparative Analysis Technical Report
Appendix M: Impacts of Scenarios on Predicted Life Factors
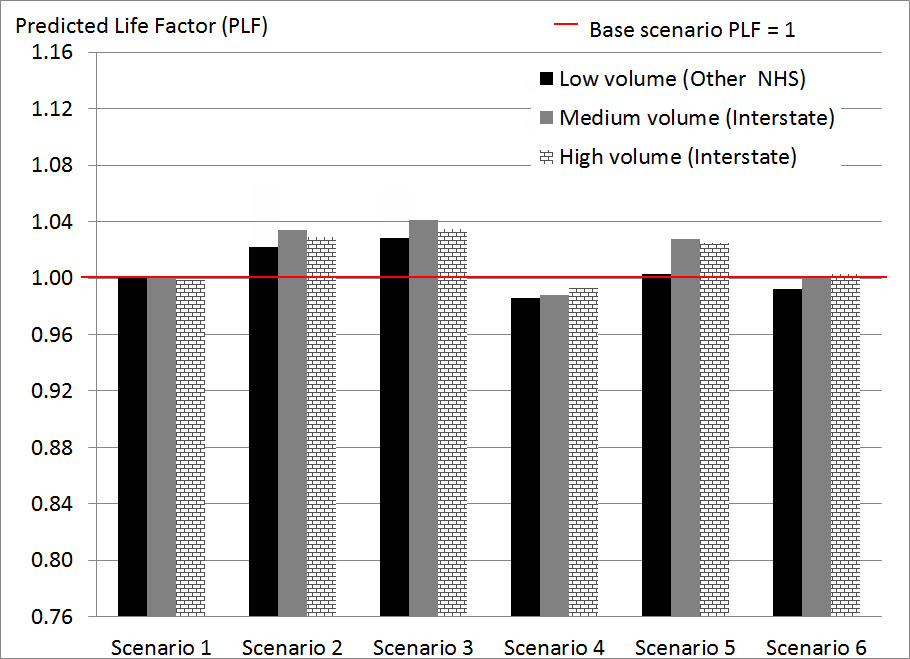
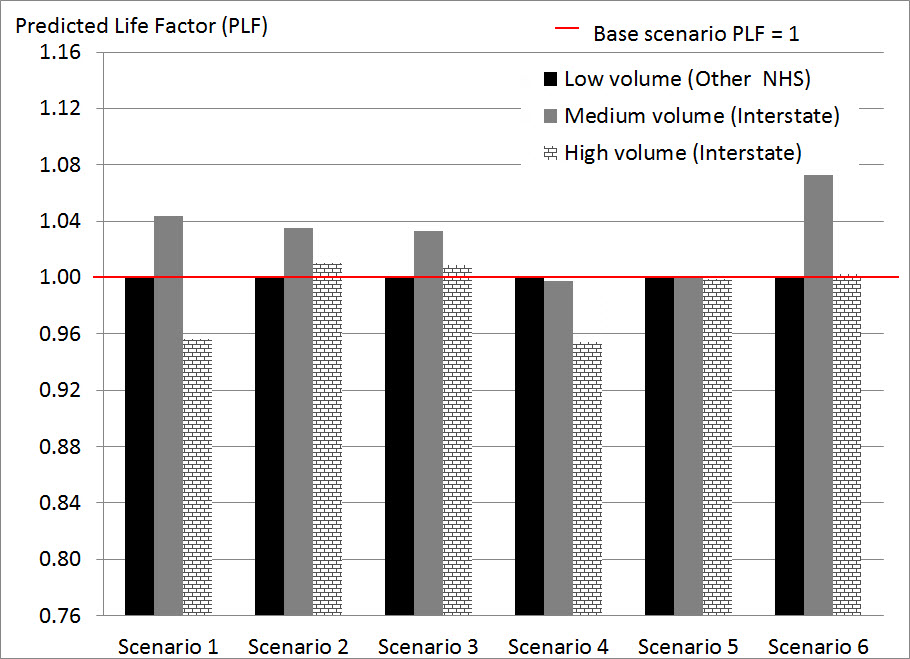
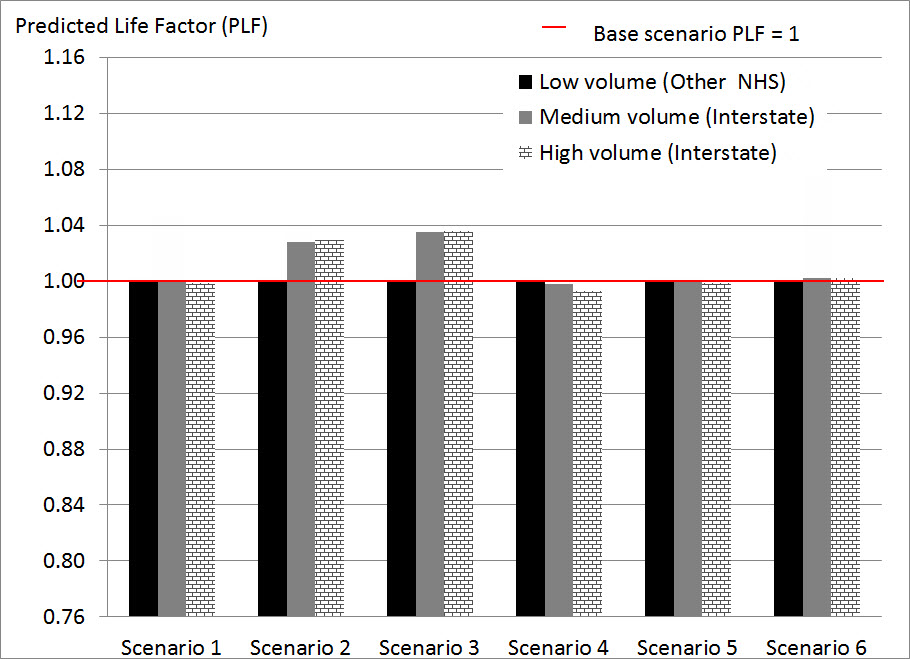
This appendix presents the predicted life factors for the flexible and rigid pavements in each geographic location. The observed differences in the impacts of the different scenarios among the four geographic locations reflect the differing combinations of pavement cross-section, climatic conditions, and traffic-loading estimates.
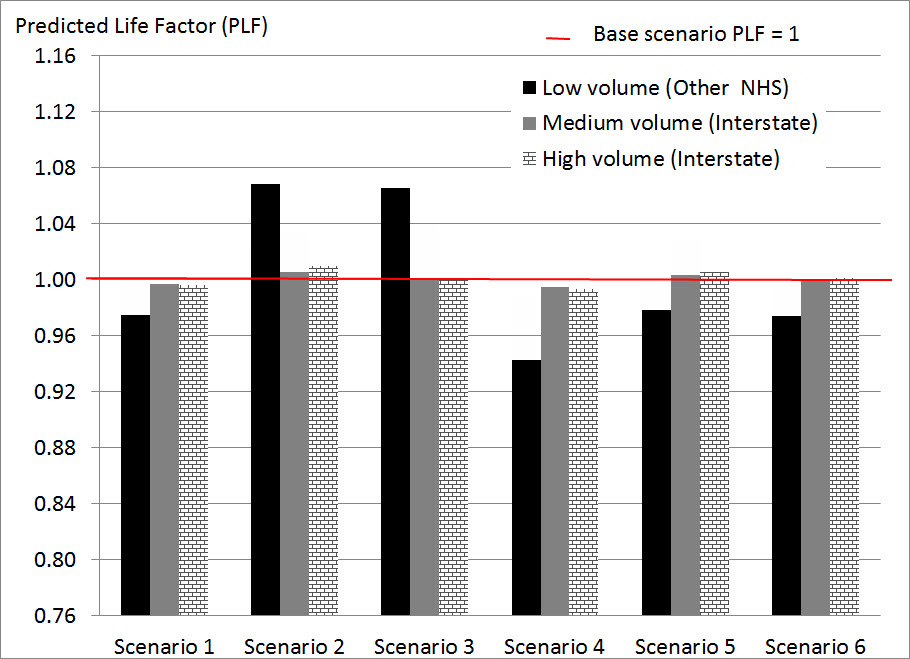
Impacts of Scenarios on Predicted Life Factor for Flexible Pavements in Geographic Location #1

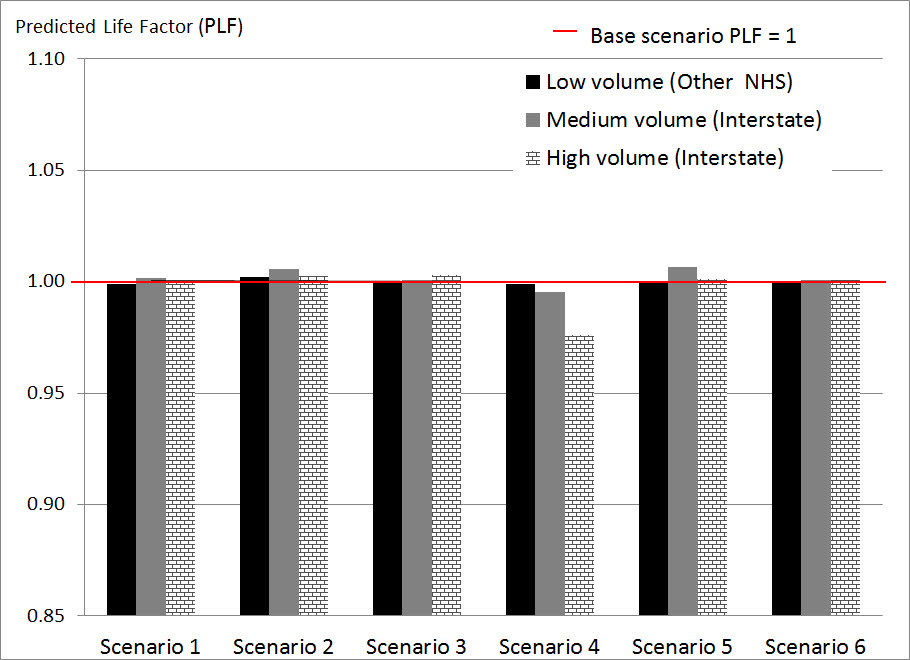
Impacts of Scenarios on Predicted Life Factor for Rigid Pavements in Geographic Location #1
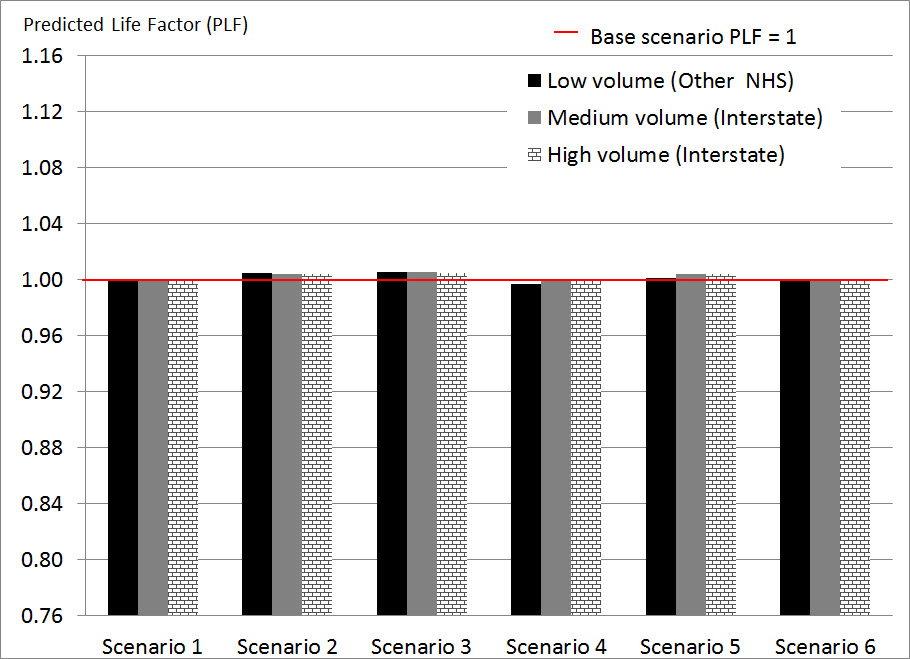
Impacts of Scenarios on Predicted Life Factor for Flexible Pavements in Geographic Location #2
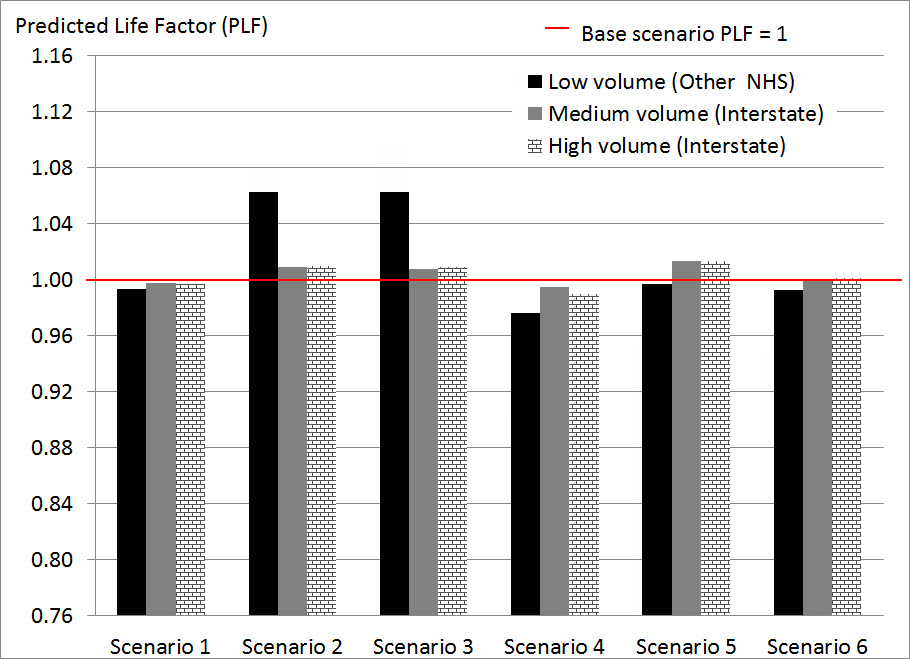
Impacts of Scenarios on Predicted Life Factor for Rigid Pavements in Geographic Location #2
Impacts of Scenarios on Predicted Life Factor for Flexible Pavements in Geographic Location #3
Impacts of Scenarios on Predicted Life Factor for Rigid Pavements in Geographic Location #3
Impacts of Scenarios on Predicted Life Factor for Flexible Pavements in Geographic Location #4
Impacts of Scenarios on Predicted Life Factor for Rigid Pavements in Geographic Location #4