Comprehensive Truck Size and Weight Limits Study - Bridge Structure Comparative Analysis Technical Report
Appendix B: Bridge Project Plan/Schedule
This Plan lays out a detailed project plan specific to the bridge task for the Comprehensive Truck Size and Weight Limits Study (Study). The plan includes an overview of the methodology that will be used and detailed step by step procedures and chronological descriptions of the various subtasks. This task also includes a detailed Critical Path Method (CPM) type schedule chart showing durations, dependencies and milestones.
Summary - Bridge Task Plan, General Approach
There are two main objectives to the Bridge Task Plan; the first objective is the determination and assessment of the implications of the structural demands on US bridges due to the current truck fleet (base case, Gross Vehicle Weight ? 80,000 lbs.), vs. those due to the 'modal shift' fleet to be anticipated in the event that the proposed alternative vehicles (truck configurations with GVW > 80,000 lbs. and twin thirty-three foot trailer combinations at 80,000 lbs.). The second objective is to determine the bridge related cost impacts for the current truck fleet (base case) vs. those to be anticipated as a result of the 'modal shift' with the proposed alternative vehicles. Both of these studies will be conducted with respect to bridges located on three 'highway scenarios': 1) the Interstate system; 2) Primary Arterials; and 3) all other highways comprising the NHS and/or the National Truck Network.
The following related sub-tasks will also be investigated and assessed with respect to the degree to which they may be affected by the legalization of the proposed alternative vehicles on a national basis:
- Estimate Relative Damage Risk Levels to Bridges Due to Inelastic Deformation
- Fatigue Related Effects - Research and summarize the effects of overweight trucks on the fatigue life of bridges
- Posting Assessment - Estimate the number of additional bridges requiring posting, retrofitting or replacement
- Bridge Deck Repair & Replacement Costs - Study & assess the effects of proposed alternative vehicles (truck configurations) on bridge decks and the resulting rehabilitation and replacement costs
- Bridge Deck Preservation & Maintenance Costs
These reports will appear as independent sections in the final report and will most likely be an assessment, resulting from the findings of the Study main objectives listed above and augmented with research of available literature.
Schedule
- The Preliminary Project Plan (consisting of the structural report and the cost allocation report for the base case) will be submitted on February 28, 2014.
- The Final Draft Report (including all the sub studies) will be submitted on April 30, 2014.
1.3 Detailed Project Plan for V.C.3 - Comparative Analysis of Truck Weight Impacts on Bridges
Investigate and Assess the Structural Demands of Legal and Overweight Trucks on Bridges: A group of 500 bridges representing the 20 +/- most common bridge types will be selected from four regions throughout the contiguous United States. Hawaii and Alaska combined have only 2143 bridges, so their numbers will be rolled into reasonably similar climatic regions. The AASHTOWare Bridge Rating® (ABrR) program will be used to analyze the 500 bridges for legal trucks (base case, GVW ? 80,000 lbs.) and for the proposed alternative vehicles (alternative scenario, GVW >80,000 lbs.).
The truck classifications for the base case and for the alternative scenario used for this Study consist of the following 3 configurations:
- Five axle (3-S2) tractor semitrailer (53'), GVW < 80,000 pounds (base case)
- Five axle (3-S2) tractor semitrailer (53'), GVW < 88,000 pounds (alternative scenario)
- Six axle (3-S3) tractor semitrailer (53'), GVW < 97,000 pounds (alternative scenario)
And Longer Configuration Vehicles (LCV) as determined following the May 29, 2013 Outreach Meeting:
- Surface Transportation Assistance Act (STAA) Tractor-Semitrailer-Trailer combination with twin 28.5 foot trailers (alternative scenario)
- Tractor-Semitrailer-Trailer (Twin 33' tractor-semitrailer-trailer configuration complying with current Federal weight limits)
- Tractor-Semitrailer-Trailer-Trailer (Triple tractor-semitrailer-trailer-trailer with three 28.5' trailer units)
The five steps required to achieve this objective are:
- Determination of the regions, for bridge purposes
- Selection of the 500 representative bridges
- Obtaining the ABrR bridge models in LRFR (& LFD) capable format
- Analyzing the bridges for the various truck configurations and obtaining demand moments and rating factors
- Presenting the results of the structural analysis, including in tabular and graphical form.
Determination of Regions: The States will be subdivided into four climatic regions (not necessarily coincident with the Pavement Subtask Climatic Regions). The rationale for the subdivision would also reflect, to the degree possible, truck classifications that are unique to a State or area.
Due to the inherent limitations imposed by the scope and duration of this Study, the analysis to be performed has been limited to studying 4 regions. For the Washington D.C. DOT Study of the effects of overweight trucks (2011), a bridge deterioration model was developed that reflected a primary deterioration mechanism and path for cold weather states that apply winter salts to control ice and snow. It is preferable to study a region inclusive of Northern States where environmental factors can be said to be generally similar to the Northeast, but where there is a history of the acceptance of heavier trucks. This region would include Michigan, Ohio and Indiana, and would present some interesting potentials for cost comparisons. The Southwest is interesting in offering a base condition area where climatological factors may be minimal. If the modal fleet analysis cannot accommodate this regional segregation of data over and above that being used in other areas of the Study; it is envisioned that the common regional definitions will be worked with as those definitions may be uniformly defined across all areas of the Study.
Bridge Selection Criteria: 500 bridges will be selected that will represent the States within each of the 4 regions, and the 20+/- most common bridge types (based on superstructure material, design type and continuity) as defined by the National Bridge Inventory and Appraisal Coding Guide (FHWA-PD-96-001).
Table 33 is a representation of various bridge types that might be considered for study. The number in each cell in the table is not a numerical count, but rather an address in the bridge type coding matrix. For example, '104' represents Concrete Tee-Beams. The NBIS data base will be sorted to first determine the number of bridges of each 'bridge type', in each region, on each of the three 'highway scenarios'. In this example the white colored cells might be chosen as the statistically most prevalent bridge types in that region, and by design would collectively represent at least 90 percent of the bridges in the region. To the extent possible, and as may be limited by the availability of ABrR LRFR bridge analysis models, bridges will be chosen for analysis in accord with the proportion of their bridge types throughout that region.
| Design | Slab | Stringer | Girder/FB | Tee Beam | Box Multiple | Box Single | Frame | Orthotropic | Truss Deck | Truss Thru | Arch Deck | Arch Thru |
|---|---|---|---|---|---|---|---|---|---|---|---|---|
| Material/construction | ||||||||||||
| Concrete | 101W | 102W | 103G | 104W | 105Y | 106Y | 107Y | - B | 109G | 110G | 111Y | 112G |
| Concrete continuous | 201W | 201W | 203G | 204W | 205 | 206 | 207 | - B | 209G | 210G | 211Y | 212G |
| Steel | - B | 302W | 303W | 304G | 305G | 306G | 307G | 308G | 309W | 310W | 311Y | 312Y |
| Steel continuous | 401G | 402W | 403W | 404G | 405G | 406G | 407G | 408G | 409W | 410W | 411Y | 412G |
| Prestressed Concrete | 501W | 502W | 503G | 504W | 505Y | 506Y | 507Y | - B | - B | - B | - B | - B |
| Prestressed Concrete Continuous | 601W | 602W | 603G | 604W | 605Y | 606Y | 607Y | - B | - B | - B | - B | - B |
| Wood or timber | 701G | 702G | 703G | 704G | -G | -G | 705G | -G | -G | -G | -G | -G |
| Masonry | - B | - B | - B | - B | - B | - B | - B | - B | - B | - B | 811G | - B |
| Aluminum, Wrought Iron | - B | - B | - B | - B | - B | - B | - B | - B | - B | - B | - B | - B |
| Other | - B | - B | - B | - B | - B | - B | - B | - B | - B | - B | - B | - B |
| W | Most Likely to be found on highway scenario under consideration. Return to table text |
|---|---|
| G | May be found on highway scenario. Return to table text |
| Y | Bridge Type is not statistically representative. Return to table text |
| B | Bridge Type - material/structure combination not likely to used together. Return to table text |
From Table 33, we compiled a list of the 22 Bridge Types (Material and Design Type) that would likely be included in the Study. See Table 34 Representative bridge types.
The intent here is to select bridges that are statistically representative of each region by bridge type, span(s) length and by deck area proportionately in each region. This will aid in drawing conclusions and applying inferred knowledge consistently.)
| Bridge Type No. | Mater./Design Code | Material Design | On Interstate / Arterial ? | On NHS ? | ABrR® Model Available ? |
|---|---|---|---|---|---|
| 1 | 101 | Concrete Slab | □ | □ | LRFR |
| 2 | 201 | Concrete Continuous Slab | □ | □ | LRFR |
| 3 | 501 | Pre-stressed Concrete Slab | □ | □ | LRFR |
| 4 | 601 | Pre-stressed Concrete Slab Continuous | □ | □ | LRFR |
| 5 | 102 | Concrete Stringer | □ | □ | LRFR |
| 6 | 202 | Concrete Continuous Stringer | □ | □ | LRFR |
| 7 | 302 | Steel Stringer | □ | □ | LRFR |
| 8 | 402 | Steel Continuous Stringer | □ | □ | LRFR |
| 9 | 502 | Pre-stressed Concrete Stringer | □ | □ | LRFR |
| 10 | 602 | Pre-stressed Concrete Stringer Cont. | □ | □ | LRFR |
| 11 | 303 | Steel Girder / floor-beam | □ | □ | LFD |
| 12 | 403 | Steel Girder / floor-beam Cont. | □ | □ | LFD |
| 13 | 104 | Concrete Tee Beam | □ | □ | LRFR |
| 14 | 204 | Concrete Tee Beam Cont. | □ | □ | LRFR |
| 15 | 504 | Pre-stressed Concrete Tee Beam | □ | □ | LRFR |
| 16 | 604 | Pre-stressed Concrete Tee Beam Cont. | □ | □ | LRFR |
| 17 | 309 | Steel Truss Deck | □ | □ | LFD |
| 18 | 409 | Steel Truss Deck Continuous | □ | □ | LFD |
| 19 | 310 | Steel Truss Thru | □ | □ | LFD |
| 20 | 119 | Concrete Culvert | □ | □ | - |
| 21 | 219 | Concrete Culvert Continuous | □ | □ | - |
| 22 | 319 | Steel Culvert | □ | □ | - |
Obtaining the ABrR Bridge Models in Load and Resistance Factor Rating (LRFR) Capable Format:
The primary early use of this data segregation will be to determine how many ABrR bridge models will be needed for each bridge type, on each highway scenario, in each region. As of this writing, approximately 38 States use the AASHTO ABrR load rating program. A search for the appropriate bridge models from the various States in representative quantities will be conducted as part of this effort.
Running the AASHTO Bridge Rating Program (ABrR®):
Bridge models for the selected bridges in the various regions as described above will be obtained. As previously referenced, the 500 bridges will be analyzed in ABrR utilizing the LRFR rating method for the 80k lb. 'base case' vehicle' and for the rating vehicle, as well as for the five (5) alternative scenario vehicles listed above. The controlling moments, and load rating factors will be extracted for each bridge and tabulated.
Present the Results of the Structural Study:
For each bridge type an assessment and comparison will be performed:
- The structural demands (expressed as moment) imposed on the specific bridges by each alternative vehicle (truck configuration), compared to those imposed by the 80k lb. 'base case' vehicle and by the rating vehicle (generally the H-20, HS-20 or the H25, HS25)
- The rating factors derived for each alternative vehicle
- Whether any indicated increase is structurally significant
In addition we will:
- Determine the number of those of the 500 representative bridges that would appear to require posting, rehabilitation or replacement
- Extrapolate proportionally & statistically to bridges nationwide, and comment on the reasonableness of that extrapolation
- Plot scatter diagram to infer and establish trends for discussion and explanation
The findings will be presented in tabular and graphic form and will provide detailed explanation with respect to the overall structural impact on these representative bridges, both due to the 'alternative vehicles' as a group and as may be the case, individually. For instance, it may be that certain of the alternate vehicles have serious structural implications for certain bridge types of spans greater or less than a threshold value.
Bridge Task Cost Allocation
The base bridge costs for this Study will be derived from the Financial Management Information System (FMIS) summaries for the States. FMIS contains project cost information at the project phase level and will be useful in estimating typical structural repair and replacement costs required in this analysis.
Cost Responsibility Process: The goal of the cost responsibility process is to assign bridge cost responsibility to the broad vehicle groupings relevant to this Study, including those of the proposed alternative vehicles. While not a full cost allocation study, per se, the is a need to understand the cost responsibilities of various truck groupings (ie: trucks operating at and below current Federal size and weight limits as opposed to trucks that operate above those limits). At the end of this section, the a concise discussion of other methods used in Cost Allocation Studies in the US, Europe and Australia is found which were found helpful in framing the work in this area of the Study.
In a number of States as well as in some other countries, axle load based allocations have been used for bridge costs. These agencies have used various and diverse allocators and exponents to develop expressions of incremental damage. As reported in prior studies, 59 percent to 70 percent of all bridge capital costs are non-load-related, or in other words, attributable to environmental factors and light weight vehicle use, etc. In the Northeast, we would attribute about 60 percent of all bridge capital costs to these non-load-related factors; and perhaps in the southwest (cold-dry region) it would be closer to 70 percent. The 2000 FHWA funded "Guidelines for Conducting a State Highway (and bridge) Cost Allocation Study" included examples with as much as 79 percent assumed to be non-load related. An additional factor to be studied on a regional basis with respect to this issue is the percent of bridge capital costs attributable to new construction, driven by development, population growth and investment.
The five steps (sub tasks) in the allocation of the remaining 35 percent ± of Bridge Costs are listed below: (Also see Figure 37 for a work flow summary)
- Collect statewide WIM data. (provided by other task leads)
- Summarize the WIM data by region and normalize it based on the number of WIM stations by highway scenario and by the total square footage of deck of each State in the region. This will produce 12 sets of working WIM data: three sets of data for each region. The data will consist of recorded counts of axle weights in increments of 1,000 lb. for single axles, 2000 lb. increments for tandems, etc. for each vehicle class.
- Compute the standardized axle weight ratio for each axle weight increment
-
Development of Load Related, Relative Damage Shares (RDS): Overall bridge 'damage' has been judged in various studies to relate to axle load by varying exponents, ranging from 1.5 to as much as 3.0 (in Finland they used 4.0).
- Some direct load induced effects, as well as progressive micro-cracking and long-term concrete fatigue in decks appear to be essentially linear with respect to load.
- A significant component of bridge deterioration in the North is driven by joint failure and localized shear plain failure at joints and cracks, and is induced by axle weight impacts. This initiates a deterioration mechanism that progressively affects bearings, pedestals, caps and the substructure. It is grossly accelerated by the application of chlorides to control snow and ice in Northern States.
- One of the primary areas that has been identified is the research and development of the composite exponential relationship between: 1) bridge damage costs and that portion of cumulative bridge damage, to 2) the composite axle loading as represented by the normalized WIM data. Reflecting the varying environmental conditions by region, the net or composite exponent can be seen to vary somewhat by region.
- In addition to the cited literature search, a preliminary statistical sensitivity analysis has been conducted and it appears to confirm that a composite exponent of between 1.5 and 3.0 is appropriate.
- Load Related, Relative Damage Shares (RDS) -Using a spread sheet application, the standard axle weight ratio for each axle weight increment is first raised to the power of the composite exponent derived above and then is multiplied by the number of axles recorded at that weight increment for each vehicle class. This is the RDS.
- All RDS are summed for each vehicle grouping. This sum effectively comprises the share of all 'damage' attributable to that vehicle grouping. The share of costs (damage) attributable to that vehicle grouping is determined by the ratio of its sum of RDS's divided by the collective sum total of all RDS's for all truck classes. That ratio is applied to the portion of all bridge capital costs (approximately 35 percent) attributable to truck loads. See Table 35.
Table 35 is a depiction of the spread sheet based allocation of damage related costs by vehicle class for a particular exponential relationship between bridge damage costs and axle weights by vehicle class.
Table 36 shows the percent of total bridge costs allocated by vehicle category for the WIM data listed in Table 35. It shows the percent for the existing fleet and for the future, 'modal shift' fleet. An important benefit of this approach is the capture of damage related costs attributable to each truck class. A second major benefit is that we can directly establish the relative total bridge capital costs attributable to the introduction of alternative proposed vehicles.
| District of Columbia | WIM Observations (1st Column = Axle Counts, 2nd Column = RDS (Damage) Single Axles Counts ➢ |
||||||
|---|---|---|---|---|---|---|---|
| Single Axle (kips) | Standardized Axle Wt. Factor | Bus | SU2 | SU3 | |||
| 3 | 0.00554 | 348 | 1.927 | 855982 | 4740.520 | 1030 | 5.704 |
| 4 | 0.01276 | 520 | 6.633 | 447790 | 5711.604 | 660 | 8.418 |
| 5 | 0.02436 | 802 | 19.539 | 240866 | 5868.110 | 901 | 21.951 |
| 6 | 0.04134 | 2052 | 84.825 | 185063 | 7650.115 | 1777 | 73.457 |
| 38 | 8.73137 | 54 | 471.494 | 209 | 1824.855 | 2 | 17.463 |
| 39 | 9.41450 | 46 | 433.067 | 255 | 2400.697 | 1 | 9.414 |
| 40 | 10.13173 | 81 | 820.670 | 1135 | 11499.516 | 7 | 70.922 |
| Σ of Axles ; Σ Factor ➢ | 695785 | 699918.133 | 2478515 | 305028.990 | 284016 | 169652.679 | |
| Σ Legal Axles; Σ RDSs | 535110 | 238312.571 | 2449175 | 203817.892 | 268345 | 130036.396 | |
| Σ Overweight Axles; Σ RDSs | 160675 | 461605.561 | 29340 | 101211.097 | 15671 | 39616.283 | |
| Vehicle Class | Allocation (%) | |
|---|---|---|
| Pres. Flt. | Fut. Flt. | |
| Passenger Cars & Light Trucks < 26K GVW | 65.0 | 65.0 |
| 26K Trucks to < 80 K Trucks | 15.6 | 12.7 |
| 80K Trucks (5 axle, 3-S2) | 18.2 | 9.3 |
| 88K Trucks (5 axle, 3-S2) | 0 | 5.5 |
| 97K Trucks (6 axle, 3-S3) | 0 | 2.7 |
| STAA Tractor-SemiTrailer-Trailer (Twin 28.5’ Trailers) | 0.5 | 2.1 |
| Tractor-SemiTrailer-Trailer (Twin 33’ Trailers) | 0.35 | 1.9 |
| Tractor-SemiTrailer-Trailer-Trailer (Triple Trailer Units) | 0.35 | 0.8 |
| Totals | 100.0 | |
Figure 37: Bridge Cost Allocation Work Flow
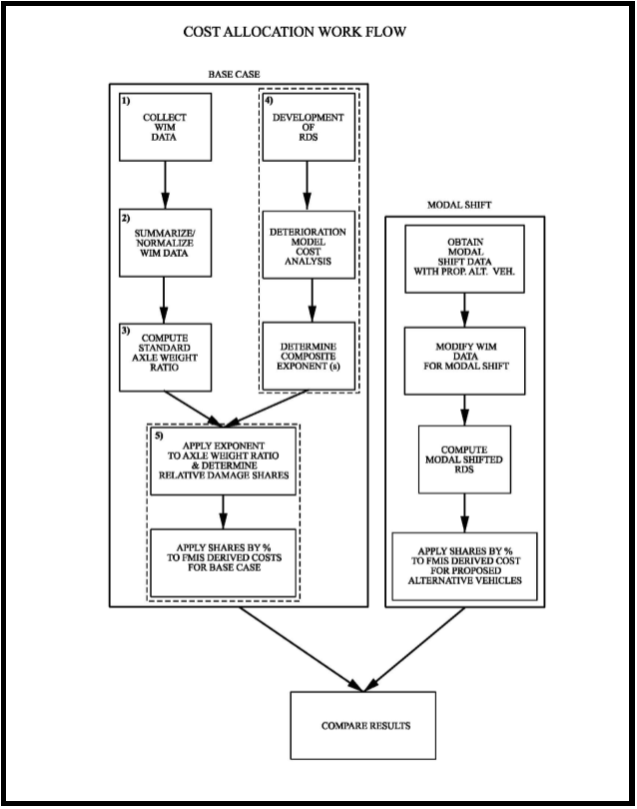
Modal Shift - Effect of Alternative Vehicle Scenario on Bridge Costs: The process here is essentially the same as for the Base Case, except that the WIM data will be modified to reflect the number of trucks of various vehicle classes in the proposed Alternative Vehicle Fleet. The modal shift data will be developed in by the Modal Shift analysis work of the Study in terms of percentage increase in number of axles for each truck classification. As before the standard axle rate ratios will be raised to the exponent value determined in Step 4 above and the RDS for the modal shift will be computed. The results will be applied to the FMIS cost data.
Having sets of results for both the existing truck fleet and the proposed truck fleet in hand, a comparative analysis can be made, answering in relative terms what is the cost impact of the proposed fleet of vehicles.
Other Cost Allocation Methods: A number of different cost allocation methodologies were reviewed. The most prevalent method used in the United States in the past decade (1997 - 2012) has been the Federal Method, as described in the NCHRP Report 495, which is derived from the 1997 FHWA Highway Cost Allocation Study. Both of these documents are a refinement of the previous Incremental methods developed in the 70's and 80's. The Federal method has been developed for use by individual States and/or local highway network authorities and has not yet been adapted to any national or even regional studies. To implement the Federal method on a national scale would require a level of detail not available in the NBIS and potentially not available at all. The information required would include: detailed structural data for each bridge; bridge specific condition data; and detailed cost/expenditure data for each State. The project schedule is not conducive to undertaking this effort. States have used the Federal method in modified formats to allocate bridge costs along with varied allocators (Vehicle Miles of Travel-VMT, Passenger Care Equivalents-PCE or Equivalent Single Axle Loads-ESALs) for different bridge elements or for other bridge related costs. It should be stressed that there is no uniformity or consensus in regard to what is included in a bridge allocation study. Perhaps most importantly, the States have designed the methodologies used in those studies to answer different questions.
The 'Federal Method' may not be capable of generating the cost allocation estimates at the level of detail envisioned under this Study or with a similar degree of transparency as would be desirable to have for a study of this national scale. However, some aspects of the Federal method (as set forth in NCHRP Report 495, "Effect of Truck Weights on Bridge Network Costs") could augment the explanation and approach being applied in this work area. This is particularly true of the emphasis on shear stress in concrete decks.
Methodologies used in Europe and Australia were also reviewed. The E.U. Cost Allocation of Transport Infrastructure (CATRIN) synthesis document of 2008 is a summary of methods of cost allocations used in the transportation industry (including roadways, railway, air transport and maritime) in Europe. They approach the allocation of roadway costs (including bridges) from an 'econometric' or top-down approach as well as from an 'engineering' or bottom-up approach. What is clear from this document is that there is a huge disparity of approaches between these countries due to: data availability, cost categories, elements, etc. In the end the document does not sum up the cost responsibilities from each country, but rather summarizes the 'approaches' in tabular form. It can be surmised from this tabular matrix is that load based allocators were used for highway (roads and bridges) cost allocation. The Netherlands, the Dutch and the Swiss used them on their roadways and then broke out bridges as a percentage of overall costs. The Finnish used them directly in their bridge cost allocation. No new engineering methods were introduced as part of this work.
The Australian Method, as reported in the National Transport Commission's 'Third Heavy Vehicle Road Pricing Determination Technical Report' (October 2005), uses a number of allocators to determine shares of vehicle cost responsibility. The study lumps all costs under "roadway" costs and then breaks out pavement and bridge costs. Bridge costs are compiled from the various State and Territory transport industries and are categorized as Attributable and Non-attributable Costs. Original and new construction costs of bridges are considered as Non-attributable costs, and are allocated by vehicle usage or Vehicle Kilometers Travelled (VKT). These costs were estimated at 85 percent of all bridge costs. The Attributable Costs includes preservation and maintenance, repairs and rehabilitation. The Attributable bridge cost, estimated at 15 percent of all costs, was allocated based on Passenger Car Equivalent Units (PCEUs). The Australian report acknowledged that there was a relationship between load based allocators and bridge deterioration, but it stopped short of suggesting a method other than using Passenger Car (Equivalent) Units. The report states "For other non-pavement expenditure (i.e., bridge) categories, there is little international consensus, and little information on which to judge to what extent alternative approaches might be applicable to Australia." In other words, the Australian Report does not endorse any other method for allocating bridges. The Australian Report, however, does present some apparent advantages that could be considered for implementation in this Study. The Australian Bureau of Statistics (ABS) conducts a comprehensive, national Survey of Motor Vehicle Use - SMVU, which includes statistics on an annual basis on the number of vehicles, Vehicle Kilometers Traveled (VKT), fuel consumption and average gross mass (AGM) of all vehicles. It collects this data on 35 vehicle classifications (from motorcycles to passenger cars to busses and trucks), by roadway classification (main highway, arterial, local etc.) and on a State by State basis. Something like this would greatly facilitate any future Truck Size and Weight Study.
Studies & Assessments:
In addition to the main objectives of this report, the Bridge Task includes additional sub-task (studies) that are designed to address specific questions or issues related to the overall Study. In each of these studies listed below, the results of the main study objectives will be used to answer the questions and/or will augment those findings with additional research of relevant existing literature.
Estimate Relative Damage Risk Levels Due to Inelastic Deformation: The difference between the damage risk levels that would be attributable to trucks that comply with current Federal legal limits compared to those resulting from non-compliant trucks will be assessed, described and estimated. This would recognize that key risk factors are often site-specific, including local industry and/or use patterns; but would also include regional load posting compliance behaviors which are statistically verifiable. Structural risk factors associated with the proposed alternative vehicles will be addressed through a detailed review of the results of the LRFR analysis. The limitations imposed by the analysis to be undertaken under this Study will be identified and described in detail in support of any future study that might become advisable.
Fatigue Related Effects: The effects of heavier trucks will be assessed and reported in general and effects of the proposed alternative vehicles (truck configurations) will be assessed and reported in particular on the fatigue life of bridges.This area of the Study will focus on three categories of fatigue: load induced and distortion induced fatigue in steel members; and concrete fatigue in bridge decks. The process includes a research/desk scan phase and a consolidation of the formulaic tools used to determine the safe life of bridge elements in response to these three categories of fatigue. General expressions of the relative effects of increasing truck weight and volume on fatigue life consumption in bridges will be developed. Reflecting on the Desk Scan, related positions and conclusions by others will be identified. Sources such as NCHRP Report 495 (2003) will be relied on to do this. Holding as many factors constant as possible to enable the comparison between the existing truck fleet and the proposed modal shift fleet, the differences in fatigue life consumption in relative terms will be assessed. The scope and, in particular, schedule for this Study will not support exhaustive fatigue analysis of numerous actual bridges, and it is felt that the analysis of only a handful of bridges would not be definitive. Consequently, the character of this important sub-study area will be to adhere to a generalized assessment of fatigue effects. A recommendation for further study on a much larger scale, including perhaps the analysis of a more detailed analysis of a large number of specific, real bridges.
Steel Fatigue (Load and Distortion Induced)
Fatigue damage to steel bridge elements can result from load induced fatigue effects or from distortion induced fatigue. Traditionally bridge engineers focused their studies of load induced fatigue on un-cracked members, first on the 'infinite-life check' process and secondarily on the 'finite-life check'. Programs for the analysis of Category D, E and E' details have been readily available for decades. Practical tools and processes are in place and are common practice, most importantly with regard to bridges built prior to 1978. These include regular, periodic inspections; repair of identified or suspected welds and/or material incongruities; retro-fitting, etc. Distortion-induced fatigue is due to secondary stresses in the steel plates that comprise bridge member cross-sections. These stresses and strains can only be calculated with very refined methods of analysis or with instrumentation, and is far beyond the scope of this Study. On newer bridges, the steels are 'tougher' or more fatigue resistant; fatigue sensitive details are typically avoided; and improvements of lateral member connections are implemented, for instance: connecting transverse connection plates to both the compression and tension flanges of girders, or coping of connection plates at the web to provide sufficient flexibility in the web itself. The intent is to provide a summary of current understanding with regard to distortion-induced fatigue and its implications for the increased utilization of heavier trucks.
Concrete Fatigue
The general assessment of concrete fatigue for the existing fleet will be compared to that for the modal shift fleet, based on the formulaic approach set forth in NCHRP Report 495. It infers a great dependence on the ultimate shear capacity of the deck, and states "the useful service life of a bridge deck is a random variable that is a function of a number of other variables: load magnitudes, number of load cycles, and decision as to when it should be renewed." There is considerable uncertainty with respect to the selection of numerous other parameters, including the Dynamic Impact Factor and the assumed number of axles for the average truck; yet they can have a significant effect on even the calculated "Probability of Deck Life Exhausted in (the) Next 20 Years". This all serves to show what a difficult process it is to make generalizations about concrete fatigue in decks. However, as noted above, as many parameters as possible will be held constant in order to facilitate an assessment of the effects of an increase in the number of heavier trucks under the modal shift fleet. To facilitate this process, we will develop the 'Average Truck' for the two fleet cases, based on a truck weight histogram derived from 'normalized' WIM data.
Posting Assessment: Those bridges among the 500 to be studied that can be expected to require posting, retro-fitting or rehabilitation in order to accommodate the addition of the heavier 'alternative' vehicles to the legal fleet will be assessed. Concurrently, the cost to post, operate and enforce additional postings with regard to bridges that cannot accommodate the alternative configurations and, also, trucks currently operating in excess of Federal limits will be identified as part of the work being conducted in the Enforcement and Compliance area of the Study. This would be based on a survey of costs from representative bridge owning agencies or departments, and on a statistical analysis of all of the bridges on each highway scenario (Interstate, Principal Arterial System or other roadways on the National Highway System or National Network). This cost analysis will consider both: the implications to the national bridge inventory (by extrapolation) of the findings of the structural analysis of the 500 representative bridges; and the effects of increasing Federal weight limits on the number of posted bridges and the effects of these additional postings on the usable truck network. This will include a statistical assessment of the number of bridges on each highway scenario that would require new postings as a result of increased Federal weight limits. For instance, older bridges on the Interstate system were designed to carry the H-20 (40,000 lb.) truck and the HS-20 (72,000 lb.) truck and were designed using ASD or LFD analysis. The LRFR method tends to yield different results relative to ASD and LFD, depending on span length, etc.; but is considered to be more consistently 'reliable' in terms of risk assessment. However the implementation of a greater standard weight limit would necessitate the posting of some bridges that may now barely meet the current standard. As an alternate to posting, bridge strengthening options will be investigated and the associated costs will be estimated.
Bridge Decks - Repair and Replacement Costs: The intent of this part of the Study is to consider both the change in the frequency and the associated costs for deck rehabilitation or deck replacement that would result from the introduction of the proposed alternative vehicles to the legal fleet. The results of the concrete fatigue study will help to ground the estimate of any change in the estimated deck life of the average bridge. The estimate of additional costs associated with rehabilitating or replacing decks will incorporate unit costs data from various States.
Preservation & Maintenance of Bridge Decks: The investigation into the cost impact that the proposed alternate vehicles will have on bridge decks will be addressed in this part of the Study. With respect to maintenance and preservation costs, a search of available literature on current bridge deck preservation efforts that are in place in various States which may have published cost data will be conducted. To augment the study, direct contact with bridge maintenance officials of State agencies will be initiated and information on their bridge maintenance and preservation policies and programs will be pursued. Annual cost data, and will attempt to contact States in all climatic regions. In particular, like Michigan that routinely allow heavier than the 'base case' vehicles (80,000 lbs. GVW) on their bridges and other nearby States that do not allow heavier than the 'base case' vehicle will be contacted, and information on maintenance cost data will be pursued. These costs by deck square footage will be prorated to determine a 'cost per square foot of deck'. Distinctions as to what the various States include by definition under the categories of preservation and maintenance will be accounted for or identified. The goal will be to determine what conclusions may be drawn with respect to these costs in States that already allow the heavier vehicles vs. those nearby States that do not. Detailed recommendations for further study of this issue will be made, if appropriate, as they may become clear through the course of this work to be conducted in this area.
Reports:
Preliminary Report: The Preliminary Report will include the findings of the initial study objective, namely the results of the Bridge Structural Analysis and Cost Allocation for the Current Fleet of Legal Trucks in use today.
Final Report: The Final Report will include results of produced through the technical assessments and a Comparative Analysis of the effects of a Future Legalized Fleet of Vehicles which includes the proposed alternative vehicles and the result of both the inter and intra-modal shift.
In addition, the Final Report will include the five sub-studies defined above, namely:
- Estimate Relative Damage Risk Levels Due to Inelastic Deformation
- Fatigue Related Effects
- Posting Assessment
- Bridge Decks - Repair and Replacement Costs
- Preservation & Maintenance of Bridge Decks
Data Needs
These are the databases to be used in the bridge project plan:
NBIS Bridge Data: latest update (2012 data)
WIM Data Format: (MS Excel)
- Axle weights in 2000 lb. (1 Ton) Increments for Single, 2 Tons for Tandem & and 3 Tons for Tridem Configurations
- Count of Axles at each 1 Ton increment by Vehicle Class
- Configuration of each Truck Classification (axle loads and spacing)
- State summaries of all WIM sites in each of the States
- Quantity - A total of 12 normalized WIM Data sets representative of the cross section of highway types (scenarios) and regions.
- Truck weight histograms for one data set
ABrR (VIRTIS) Bridge Models:
- Format - Tested or proven and working models of real bridges in LRFR
- Pre-screened to allow for further screening, distributed over the regions and highway types
- Must be statistically representative of the 20 bridge types
ABrR (VIRTIS) Trucks: (for the Alternative Vehicles)
- Obtain (or if necessary create) the xml file for each of the alternative vehicles (trucks)
- Exact truck wheel spacing and load distribution needed
Truck Traffic Data: Modal Shift
- In terms of percentages for each truck classification
- Modal shift results - tabulated by vehicle class for regions and for: 1) interstate, 2) primary arterials, or 3) other highway scenarios (other arterials or segments of the NHS and national truck network not on the interstate system nor on primary arterials)
- Modal shift results - for intra-modal and inter-modal shift
Bridge Cost Data:
- FMIS cost data - State summary totals showing bridge portion, etc.
State Data:
- Regulations (Legal Load Charts)
- Unit Costs for capital improvements to bridges (generally available on the internet)