Comprehensive Truck Size and Weight Limits Study - Bridge Structure Comparative Analysis Technical Report
Chapter 5: Assessment of Bridge Fatigue and Investigation into Bridge Deck Wear
This section presents the methodology that the USDOT study team implemented to estimate fatigue implications associated with trucks operating above current Federal size and weight limits compared to trucks operating at and below those limits. The chapter also discusses the implications associated with each of the scenarios. The study team’s extensive investigation into a generally accepted approach for modeling bridge deck wear is presented in this chapter as well. It should be noted that no such generally accepted approach was found and, as a result, the cost implications that the scenarios have on bridge deck wear were not calculated and so are not included in the Study.
The objective of this area of the study is to compare the impacts on bridge fatigue that trucks operating above current Federal truck size and weight limits have compared to the impacts resulting from trucks operating at and below those limits. A parallel objective is to evaluate the effects of alternative truck configurations in each of the six scenarios on the fatigue life of steel bridges through a comparative analysis. This will include both a general review of fatigue effects on steel superstructures and a study of the effects of the alternative configurations versus those of the control vehicles on four typical steel bridges.
5.1 Fatigue-related Effects
Types of Fatigue
This part of the study is focused on evaluating the effect of primary load-induced fatigue in steel bridges.
Fatigue damage in steel bridges is generally categorized as either load-induced or distortion-induced. Load-induced fatigue is due to in-plane stresses in the steel plates that comprise bridge member cross sections. Distortion-induced fatigue is due to secondary stresses in the steel plates that comprise bridge member cross sections. Typically, the effects of secondary stresses are seen at connections to primary members. This type of fatigue is usually associated with unintended fixity, the state of being stable or fixed, or distortion at these connections and can only be evaluated through a very sophisticated level of analysis that, as such, is beyond the scope of this study. The fatigue process can take place at stress levels that are substantially less than those associated with failure under static loading conditions. Fatigue damage originates from microscopic discontinuities in the material under cyclic loading. Discontinuities are typically a result of weldments with incomplete penetration, porosity, incomplete fusion, or trapped slag at a connection. Fatigue can also be focused at a simple weld termination, or it can occur at any stress concentrator; for example, at locations affected by impact or construction-related damage. These discontinuities can cause stress concentrations that are much higher than that which the member is designed to withstand. Fatigue life depends not on the basic strength of the structural element, but on the actual stresses at these discrete points at attachments or at points of abrupt change in section. Thus, the current method for estimating fatigue life in steel is based on three factors:
- The number of cycles of loading to which the member is subjected,
- The type of detail at the area of concern, and
- The stress range at the location of the detail.
Factors Impacting Steel Fatigue
Load-induced fatigue has been observed in steel components for more than 140 years. The modern approach to fatigue design of fabricated steel structures was primarily developed during the 1960s and early 1970s. This research identified the following major factors impacting fatigue life:
Residual Stress
Tensile residual stresses related to welded details are induced into the connected parts during the weld cooling process. As the weld cools and in order to maintain equilibrium, a relatively small portion of the connected part goes into tension. The actual distribution and magnitude of the tensile stress depends upon several factors such as material strength, sequencing of the welds, geometry of the connected parts, and size of the weld. The magnitude of this tensile residual stress can reach the yield strength of the material.
As per AASHTO, residual stresses due to welding are implicitly incorporated into the assumption of allowable stress range limits with the specification of stress range as the sole stress parameter.
Stress Range
It is generally agreed that stress range is the dominant factor impacting steel fatigue life. Experimental data and fracture mechanics principals have shown that fatigue damage is proportional to the cube of the stress range amplitude (from “Fatigue Impacts on Bridge Cost Allocation,” 1998, Laman et al., 1998). This means that if the stress range is doubled the fatigue damage will increase by a factor of eight. Two limit states of stress range (infinite life vs. finite life) must be considered when evaluating fatigue life. The constant amplitude fatigue threshold (CAFT) is a stress range or limit state below which an applied, constant stress range will not create fatigue damage and the detail will theoretically have infinite life.
A structure rarely experiences a constant stress range; therefore, the calculated stress ranges due to site-specific data must be considered to be below half of the CAFT or the variable amplitude fatigue threshold (VAFT) to achieve no fatigue damage and to theoretically experience infinite fatigue life. If the particular detail of concern fails to achieve these thresholds, a more complex finite life fatigue evaluation is required.
Stress Cycles
The number of stress cycles in a structure is proportional to the number of trucks that cross the bridge during its service life. Fatigue life evaluation is performed based on the assumptions that each truck loading cycle causes some damage. The damage caused by each truck depends on the weight, the bridge’s span length, and member section properties. Researchers and structural engineers primarily use Miner’s Rule to determine the fatigue life considering this cumulative effect of stress cycles. This method assumes that the damage in just one stress cycle is 1/Ni if Ni cycles of a specific stress range Si are needed to cause a structural detail to fail.
Figure 32: Region of Concern for Fatigue in Highway Bridges
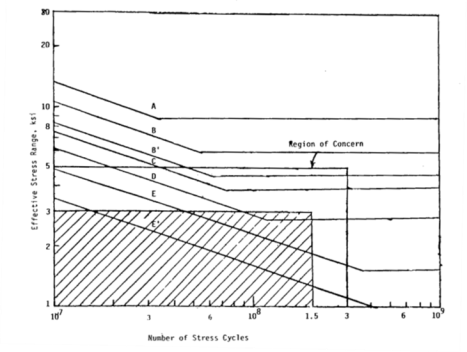
(Source: NCHRP Report 299: Fatigue Evaluation Procedures for Steel Bridges, 1987)
Steel Fatigue Details
Bridge connection details are grouped into categories labeled A to E’ (E-prime) based on their level of fatigue strength. This strength is for load induced fatigue caused by in-plane bending stress. The details in each category have approximately the same level of stress concentrations and comparable fatigue lives. S-N curves, which show the number of cycles to failure, N, for a given constant stress range, S (See Figure 32 above), have been developed for each fatigue detail category. These curves are based on extensive laboratory data by Fisher et al. (1970) and Fisher et al. (1974). Because of the scatter in test data, the curves represent the lower bound of predicted fatigue life with a 95 percent confidence level for a 95 percent possibility of survival. With regard to the S-N curves in Figure 32, an inner region of concern is enclosed within an area bounded by a stress range of 5 kilo-pounds per square inch (ksi) and by 10 million and 300 million stress cycles. The 5-ksi stress range represents an approximate upper bound observed on actual bridges. The majority of the stress ranges observed on actual bridges have been between 1 and 3 ksi. The expected stress cycles on most bridges are between 10 million and 150 million. This produces the cross hatched area of greater concern bounded by stress ranges of 3 and 1 ksi, and cycles of 10 million and 150 million.
The S-N curves for fatigue detail categories D through E’ are within this area of greater concern. This observation is consistent with experience in that fatigue failure has not been reported for categories A through C, but has occurred in categories D, E and E’. Also from the AASHTO LRFD Design Specifications C6.6.1.2.3, “Experience indicates that in the design process the fatigue considerations for Detail Categories A through B’ rarely, if ever, govern.” And from NCHRP Report 299, 1987, the situation where the maximum stress range in tension falls below the fatigue limit for a particular detail “applies primarily to higher detail categories (C and above).”
Axle Weights vs. Truck Weights
The 72,000-lb. HL93 fatigue truck[2] is used to represent the large variety of actual trucks of different configurations and weights. The fatigue truck has a constant dimension of 30’ between main axles with a maximum axle weight of 32,000 lbs. This arrangement approximates the four- and 5-axle trucks that do most of the fatigue damage to bridges.
From the “Influence of Heavy Trucks on Highway Bridges,” (Wang et al., 2005), it was observed that traffic-induced flexural stress does not necessarily increase with gross vehicle weight (GVW), but is highly related to axle weights and configurations. Also, from “Fatigue of Older Bridges in Northern Indiana due to Overweight and Oversized Loads – Volume 1: Bridge and Weigh-In-Motion Measurements,” (Reisert et al., 2006) it was noted that:
...shorter spans show little GVW to moment effect correlation. However, the correlation improves as the span length increases. When comparing truck induced moment on spans shorter than 60 feet there is very little difference in the moments induced by 5 axle and 11 axle trucks. However, for spans greater than 60 feet, as the span length increases the moments induced by 11 axle trucks are significantly higher than those induced by 5 axle trucks.
By evaluating the strain data from a bridge that was instrumented for a 2005 study, Wang and Liu found that there was very little difference in maximum strain (and stress) ranges induced by a 5-axle, 80,000-lb. trucks and the 9- and 11-axle 134,000-lb. trucks. The five-axle 80,000 lb. truck did, however, produce the largest maximum strain range. In “Fatigue Impacts on Bridge Cost Allocation” (Laman et al., 1997), researchers found that factors influencing the level of fatigue damage caused by a given vehicle are axle weights and spacing.
Current Code Approach to Steel Fatigue
Current code approach[3] is based upon Miner’s linear damage rule concerning the cumulative process of fatigue and the determination of stress range as it relates to the stress-life approach. The fatigue evaluation procedure requires calculating the effective stress range at the un-cracked detail of concern. This can be performed by using the fatigue truck, site-specific data, or stress measurements. From the effective stress range, a maximum stress range is calculated and compared to a constant amplitude fatigue threshold for infinite life. If this maximum stress is greater than the threshold, the effective stress is then used to determine finite fatigue life.
Summary of Research Findings and Positions on the Subject:
The following recent research findings and positions on the subject are in chronological order:
- “Effects of Increasing Truck Weight on Steel and Pre-stressed Bridges,” (Altay et al., 2003). This study evaluated the effects of increasing the legal truck weight by 10 or 20 percent on five steel girder bridges and three pre-stressed I-girder bridges that were instrumented. It was discovered that all modern steel girders and most bridge decks could tolerate a 20 percent increase with no reduction in fatigue life. Older steel bridges designed in the 1970s and 1980s would experience a reduction in remaining life of up to 42 percent for a 20 percent increase in truck weight and a 25 percent reduction for a 10 percent increase in truck weight.
- “Truck Loading and Fatigue Damage Analysis for Girder Bridges Based on Weigh-in-Motion Data,” (Wang et al., 2005). Based on data collected by WIM measurements, this study evaluated the effects of heavy truck traffic on six steel bridges. The heaviest trucks observed were almost twice the weight of the HS20-44, 72,000-lb. vehicle; however, all the axle weights were less than the 32,000-lb. axles of the HS20-44 vehicle. Through the damage accumulation analysis, it was found that the actual truck traffic closely correlates the effects of the fatigue design truck and that the heavy traffic will not cause severe fatigue problems on steel girders with fatigue details of categories A, B and C.
- “Fatigue of Older Bridges in Northern Indiana due to Overweight and Oversized Loads – Volume 1: Bridge and Weigh-In-Motion Measurements,” (Reisert et al., 2006). This study evaluated the effects of truck traffic along an extra heavy weight corridor on one steel bridge. The trucks ranged in GVW from 54,400 lbs. for the Class 9 vehicles to 119,500 lbs. for the Class 13 vehicles. The Fatigue Categories C and D were investigated. Based on the results of the study, the structure was shown not to be susceptible to fatigue failure.
Assessment of Fatigue Formulas and Their Implications with Respect to the Alternative Truck Configurations Being Considered
Fatigue life is inversely proportional to the cube of the effective stress range and will therefore be sensitive to small changes in loading for the limit state of the finite life cycle. Depending on the CAFT limit of AASHTO fatigue prone details, differences in the axle weight and spacing of the vehicle classes and weight groups may result in significantly different fatigue damage to the bridge inventory. The potential effects on the Nation’s bridges from the increased sizes and weights associated with the alternative truck configurations in each of the six scenarios were investigated. Inherent in the following assessment is the reality that the widespread use of any of the proposed alternative truck configurations would likely only constitute a modest increase (relative to the sheer size of the present truck fleet and truck traffic stream) in total loading cycles for any given bridge. This does not negate the possibility of a significantly larger contribution of incremental fatigue damage that could be attributed to an alternative truck configuration for its loading cycles. It does however put the issue into perspective. Any significant difference in the fatigue affects attributable to a particular alternative truck configuration must be considered in light of the relative percent of loading cycles assumed to be attributable to that scenario. For greater insight into the projected increase in scenario vehicles due to mode shift, see the Mode Shift Comparative Analysis segment of the 2014 CTSW Study.
To illustrate the fatigue damage potential of these proposed alternative truck configurations in each of the six scenarios, four typical existing steel bridges were selected for comparative analysis. Two of them are simply supported steel girder bridges and the other two are continuous steel girder bridges. The steel girders on these bridges comprise either rolled shape beams with partial length cover plates or plate girders with horizontal lateral bracings welded to the bottom flanges of the girders. The USDOT study team conducted the analysis in accordance with the AASHTO Manual of Bridge Evaluation (2nd Edition) with 2014 interim revisions and the AASHTO LRFD Bridge Design Specifications (6th Edition). All of the four chosen bridges have finite fatigue life cycles per the analysis.
Given that fatigue life is inversely proportional to the cube of the effective stress range and assuming that the stress cycles for each truck configuration in the new fleet of trucks is constant, a baseline can be established for the two 80,000-lb. control vehicle truck configurations using the following equation:
Baseline Fatigue (Value A) = ![]() (Control Vehicle)
(Control Vehicle)
Where ![]() = the calculated effective stress range at the locations of concern
= the calculated effective stress range at the locations of concern
Using this same equation, a similar calculation can be performed for the effective stress range for each alternative truck configuration.
Alternative Truck Configuration Fatigue (Value B) = ![]()
By comparing this value to the control vehicle fatigue value, an order of magnitude change in the fatigue life attributable to each scenario vehicle can be determined using the following equation:
Change (percent) = (B/A)-1
The following truck data, including two 80,000-lb. control vehicles and six alternative truck configurations, were used for modeling purposes (See Figure 33).
Figure 33: Control Vehicles and Alternative Truck Configurations in Each of the Six Scenarios
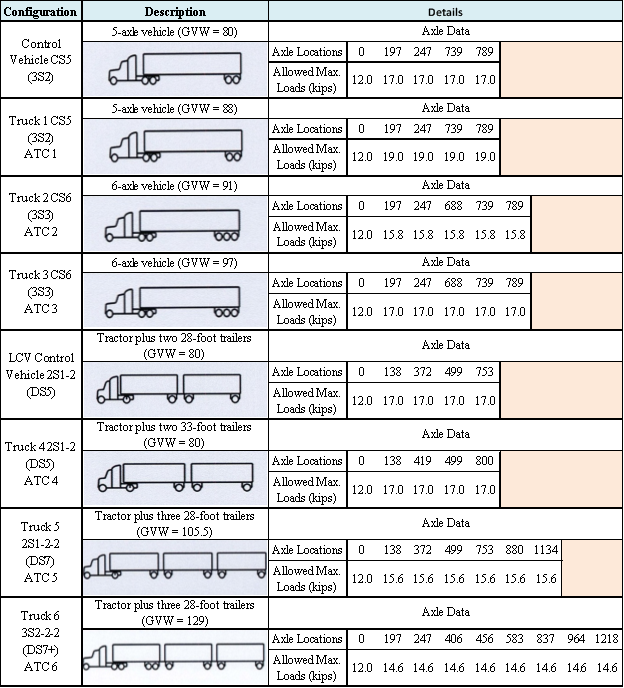
Note: Axle locations are measured in inches from the steering axle.
Gross vehicle weight and axle loads are expressed in units of 1000 lb. or "kips".
Bridge #1: 42’-9" Simply Supported Rolled Girder Bridge with Welded Cover Plates
The existing bridge consists of six simply supported spans located at Lake Katrine Rd. (County Route 90), spans over Interstate 87 in New York, and was built in the1950s. Span 4 of the bridge was chosen for the analysis. The superstructure of Span 4 is composed of W24 rolled girders with welded cover plates terminated at 8’-4” from the supports. The span is skewed at 30°. The fatigue detail category of the welded cover plate is 'E' (E-prime). The reinforced concrete deck is composite and the structural deck is 6 ½” thick. A line girder analysis was performed for an interior girder.
The results of the comparative analysis are shown as follows:
Bridge #2: 133’ Simply Supported Welded Plate Girder Bridge with Welded Lateral Bracing
The existing bridge consists of 20 simply supported spans located at the Empire State Plaza Artery Westbound over Ramp I-787 NB to the South Mall in Albany, New York and built in 1967. Span 20 of the bridge was chosen for the analysis. The superstructure of span 20 is composed of welded steel plate girders with a welded gusset plate that connects the lateral bracing at mid-span. The fatigue detail category of the detail is 'E'. The reinforced concrete deck is composite and the structural deck is 7-1/2” thick. A line girder analysis was performed for an interior girder.
The results of the comparative analysis are shown as follow:
Bridge #3: 361’-4” Three Span Continuous Rolled Girder Steel Bridge with Welded Cover Plates
The existing bridge is located in Knoxville, Tennessee on Interstate I-40. It spans over Norfolk Southern Railroad and a cross street. It was originally constructed in the 1960s and widened in the 1980s. The bridge consists of three continuous spans of approximately 128’, 132’ and 101’. The superstructure is composed of W36 rolled girders with welded cover plates in the both positive and negative moment regions. The fatigue detail category of the welded cover plate is 'E' due to the thickness of the bottom flange. The reinforced concrete deck is composite in the positive moment regions and is 8 ½” thick. The bridge supports three lanes of traffic west bound and four lanes east bound. A line girder analysis was performed to determine the stress ranges at the termination of the cover plates on the bottom flange in the positive moment regions. The results of the comparative analysis are as follows:
Note: A positive value indicates a decrease in the alternative truck configuration’s incremental effect on the bridge’s fatigue life relative to the control vehicle and a negative value indicates an increase in the alternative truck configuration’s incremental effect on the bridge’s fatigue life relative to the control vehicle.
Through this analysis it was discovered that the stress ranges at the bottom cover plate terminations in span 2 did not exceed ½ of the un-factored permanent dead load compressive stress. Therefore, the bottom flange cover plate terminations in span 2 are always in compression, and therefore, the results for this span were not reported in the table above.
Bridge #4: Five-span, continuous welded plate girder steel bridge with welded lateral bracing
The existing bridge is a five-span, multi-girder bridge located in New York, on Northern Boulevard over Interstate Route 90 and NYC railroad. The bridge was originally built in 1971 and is skewed 7 degrees 40 minutes at Piers 3 and 4. The interior girder (G2) was chosen for the analysis. The span lengths for G2 are 142’, 185’, 139’-3”, 122’, and 106’. The welded steel plate girder is composite with a 7-1/2” thick concrete deck. Lateral bracings are located at the center of the spans welded to the bottom flange of the girders. The fatigue detail category is E. A line girder analysis was performed for girder G2.
The result of the comparative analysis for Bridge #4 follows:
Note: A positive value indicates a decrease in the alternative truck configuration’s incremental effect on the bridge’s fatigue life relative to the control vehicle and a negative value indicates an increase in the alternative truck configuration’s incremental effect on the bridge’s fatigue life relative to the control vehicle.
As stated earlier, the above results demonstrate the incremental effects of alternative truck configurations for each scenario on these real-world bridges as compared to the incremental effects of truck usage by the more common control vehicle configurations in terms of percentage change in fatigue life, assuming that the stress cycles for each of the vehicles is constant. To determine the changes in the absolute fatigue life of the bridge resulting from alternative configurations, further study is required based on the percentage of each ATC in the fleet, ADTT for a particular corridor, and the number of stress range cycles.
Conclusions:
The results of this comparative analysis indicate that relatively higher axle loads or more closely spaced axles negatively impact fatigue life when compared to the two 80 kip control vehicles. For instance, Scenario 1 has the same axle spacing as the single control vehicle, but has 12 percent higher main axle weights, resulting in an incremental 25 to 27 percent negative effect on fatigue life for Bridges #1 through #4. Scenario 2 and Scenario 3 both result in significant incremental negative effects on fatigue life when compared to the single control vehicle due to their closely spaced tri-axle configurations. This confirms that the addition of the third axle to the rear axle grouping results in a negative effect on fatigue life on the order of 29 to 54 percent for Bridges #1 through #4.
The axle spacing effect is also evident when comparing Scenario 6 with the double control vehicle. Scenario 6 will have a negative incremental effect on fatigue life of up to 66 percent due to the addition of closely spaced axles even though each individual axle weight is less than that of the double control vehicle.
Notably, all details analyzed for bridges above are for the limit state of finite fatigue life. Depending on bridge span length, fatigue details, and the ratio of partial welded cover plate length to span length, some bridge details may have infinite fatigue life regardless of use by the control vehicle or an alternative configuration.
As stated earlier, this comparative analysis with the fatigue truck shows the relative effect on fatigue life of each scenario vehicle compared with the two control vehicles. The absolute effect of the general acceptance of any one of the scenario vehicles can only be measured in terms of changes in Years of Remaining Life. Due to unknown factors such as AADT, percentage of alternatively configured vehicles relative to the entire fleet, etc., the study team is unable to make a clear prediction of the absolute remaining fatigue life change. However, it is worthwhile to keep in mind that alternatively configured vehicles are a relatively small percentage of an entire fleet of trucks and that the bridge repair cost for steel fatigue damage is small compared to the total bridge program cost.
5.2 Bridge Deck Deterioration, Service Life, and Preventative Maintenance
Introduction
Scope & Purpose:
Bridge decks are the most visible component of the bridge to the traveling public and one of the most costly elements of bridges in terms of maintenance repairs, rehabilitation, and replacement. In the United States, bridge decks have an effective service life ranging between 35 and 50 years, depending on truck traffic, the environment (climate and use of chlorides) and the bridge owner’s bridge preservation practices. Transportation agency strategies to prolong deck life are often driven by budget, truck traffic, and environmental factors, and research has shown that these factors are intimately linked. The purpose of this effort is to explore the effect that trucks have on bridge decks and specifically the projected effects that the six scenario configurations, which are above the current Federal GVW limits, have on bridge decks.
The scope involved two efforts related to bridge decks. The first effort focused on bridge deck preservation and preventative maintenance, and the second addressed bridge deck repairs and replacement. Over the course of the research conducted, it became apparent that the two subtasks could not be independently explored and were related topics dealing with bridge deck service life.
With regard to the bridge owner’s practice, expenses and costs are driven by agency goals and level of effort involved in keeping bridge decks in a serviceable condition, regardless of the forces and environmental factors that drive the deterioration. However, a distinction (or assumption) should be made at the onset of this discussion regarding operations and maintenance (O&M costs) vs. capital costs. O&M costs are on-going expenses usually borne internally by the owner agency, whereas capital costs are one-time costs for deck repairs and replacement that are typically beyond the direct maintenance capacity or capability of the owner agency.
This discussion will be limited to reinforced concrete (RC) bridge decks. These decks represent 95 percent of all bridge decks on the highway networks under study. Other bridge deck types such as orthotropic, steel gratings, Exodermic® bridge deck systems, etc. are outside the scope of this document and behave differently under load.
An extensive literature search was conducted on reinforced concrete bridge decks as an initial step. The team reviewed the AASHTO LRFD Bridge Design Specification, 6th Edition, to rehearse the current assumptions for the design philosophy for bridge decks with references that were followed up and recorded. The Transportation Research Board’s (TRB) vast resources were investigated, leading to the identification of numerous research papers and TRB publications on the subject. The team investigated the activities and policies of the various departments of transportation (DOTs) throughout the United States and reviewed several international sources, including the Japanese Public Works Research Institute (PWRI), which is noteworthy in producing research documentation on concrete fatigue deterioration mechanisms. All the various documentation and resources are listed in Appendix A.
The Effect of Trucks on Bridge Decks
During the course of this investigation, the study team determined the following:
- Truck axle weights are the cause of primary damage to bridge decks, (Matsui, 1991, Perdikaris et. al., 1993, Tanaka et al., 2009)
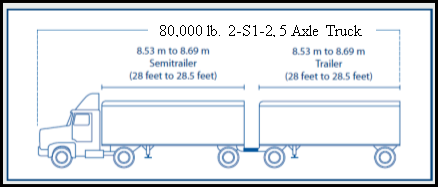
- The majority of trucks driven on the highway networks are Class 9, 3-S2 (CS5, five-axle trucks). This truck configuration is the single control vehicle for this study, as shown in Figure 34. The double control vehicle is an STAA 28.5’ double, also a five-axle 80,000 lb. truck, shown in Figure 35.
Figure 34: STAA 53’ (max) Semitrailer Single Control Vehicle
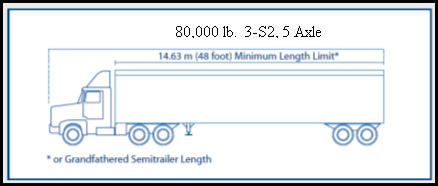
Figure 35: STAA 28’ Double Control Vehicle
Research Approach
The USDOT study team examined owner-agency practices and policies regarding bridge deck preservation and preventative maintenance from a variety of sources. The main resources were the transportation agency web sites and the Transportation Research Board (TRB) publications and synthesis documents (NCHRP Report 397, 2009 and NCHRP Report 668, 2010, whereby other researchers conducted State surveys on a variety of related topics). The research by Dr. George Hearn, (Hearn, 2012), “Deterioration and Cost Information for Bridge Management,” was found to be particularly useful in this area. This document also points out that State DOTs use a variety of tools such as the AASHTO bridge management tool formerly known as PONTIS® (now called AASHTOWare Bridge Management). Some State DOTs use the PONTIS® output in conjunction with a deterioration modeling software that determines the rate of deterioration of a specified bridge asset and when action is needed by State DOTs to prolong the bridge element (such as the structural deck) life.
Data Collection
Unit Cost Data was collected from the following States:
Alabama, Arkansas, California, Colorado, Connecticut, Delaware, Florida, Georgia, Indiana, Louisiana, Missouri, Nebraska, New York, Ohio, Virginia, Pennsylvania, Tennessee, Washington DC, and Wisconsin.
Assumptions / Limitations
- When the owner agency takes action (or if the owner agency does not take action), in combination with the materials specified for use in preserving the deck all have a direct bearing on the service life of the RC bridge deck.
- Bridge deck repair and replacement costs are considered relative to the introduction of each of the six scenario configurations. They are the primary capital cost contributors to the overall load-induced costs analyzed in Chapter 4. As such they represent “damage costs.” The total damage that accumulates in the bridge deck over time is the result of both environmental factors (including ice, snow and resulting use of de-icing chlorides) and traffic factors (or load-induced).
- The load-induced damage in the early- to mid-service life of concrete decks is primarily the result of internal cracking and crack propagation due to stresses and strains. Likely causes of cracking are concrete shrinkage (Krauss and Rogalla, 1996), truck overloads (Kostem 1978, Fu et al., 1992, 1994), and the lack of full consolidation during construction. Wheel loads have been shown as the catalyst, if not the initiator, of fatigue damage during the early life cycles of the deck. Wheel overloads accelerate fatigue damage because of the resulting stress concentration at the tip of the cracks. Cracks then propagate under wheel load cycles and cause further deterioration. This damage accelerates as the wheel load moving across the crack causes the two concrete surfaces to rub on each other during the mid to late service life phase.
- In the mid- to late-service life of decks, where de-icing chlorides are applied, the resulting corrosion and the expansion of the reinforcing bars accelerates the deterioration of the deck.
Bridge Deck Deterioration Mechanisms
The mechanisms of deck deterioration resulting from the various sources, such as trucks and the environment, will be described in this sub-section.
AASHTO LRFD Bridge Design Specifications and Commentary on Concrete Deck Behavior
Research has shown that primary structural resistance [toward the end of deck life] is not by flexural behavior, [but] rather by a complex internal membrane stress state referred to as internal arching or dome behavior. As the concrete cracks develop in the positive moment region of the slab, the neutral axis shifts upward and in-plane membrane forces develop as a result of lateral confinement provided by the surrounding concrete slab, and by the rigid primary members. The arching creates an internal compressive dome [more like a membrane, with the arching effect arising secondarily]. The failure occurs as a result of over-straining around the perimeter of the wheel footprint. The ultimate failure mode is that of punching shear. The arching action cannot resist the full wheel load; therefore, a small residual stress is resisted by flexure which is taken up by the steel reinforcing bars. The reinforcing bars also provide global confinement which is necessary for the membrane action and arching action to develop (Fang, 1985; Howleka et al, 1980) near the end of service life of the deck. All available data and tests indicate that the resistance to the wheel load using traditional design methods provides for a factor of safety that is at least 8-10 times the applied wheel load.
As noted above, bridge decks exhibit the arching behavior during late stage service life. However, early on, the deck crack sizes are of a microscopic scale and are not yet interconnected. During the early phase, the primary mode of deck deterioration is related to flexure. It is only after numerous cyclic loadings of the deck that these micro-cracks begin to grow in size and number to the macroscopic scale needed to develop the arching action. It is difficult to determine when the deck transitions from the flexural to the so-called arching behavior.
Reinforced Concrete Deck Serviceability Issues and Crack Induced Deterioration Mechanisms
While AASHTO considers the strength limit state of bridges, bridge owners or managers need also consider the serviceability limit states as well. These include deflection, vibration, crack growth and spalling on the structural deck surface.
The primary contributing factors with respect to deflection and vibration are axle loads and deck thickness. If the deck is too thin, excessive deflection can lead to extensive cracking and vibration. Vibration is also a function of the overall flexibility of the bridge deck and primary member system as well as the dynamic effects. Excessive vibration and movement can also be a cause of human discomfort, which is a serviceability issue.
Several research papers and one case study out of California illustrate the concepts from the AASHTO Design Specifications:
- Alabama DOT in conjunction with Auburn University conducted an investigation on the premature cracking of RC bridge decks on Alabama Highways. The paper, “Assessing the Cost/Benefits of Employing Thicker Bridge Decks” (Ramey et al., 2000), determined that Alabama highway bridge deck thicknesses were typically found to be 6” to 6.5”, and were 1.0” to 1.5” thinner than comparable bridge decks in other States. The cracking was found to be predominantly caused by truck axle weights, even though the decks were designed to carry the full weight of the design trucks. The Auburn research team also found through contractor interviews and cost data that the bridge decks could be replaced with thicker decks with only 2 percent to 3 percent in added costs compared to the cost of the 6” thick bridge decks. Furthermore, it was determined that the extra thickness could increase the bridge deck life by 10 percent to 50 percent. So, a minor increase in construction cost was shown to provide considerable long-term benefit in extending bridge deck service life.
- Research into the deterioration of RC decks has been advanced through the efforts of Shigeyuki Matsui (1999) in Japan and P. Perdikaris et al., (1993) at Case Western Reserve University. More recently, Yoshiki Tanaka et al., (2009) from Japan’s Public Works Research Institute (PWRI, Japan) conducted studies on the fatigue mechanism in concrete decks combined with the effects of de-icing salts.
These independent groups studied both the effect of static and dynamic wheel loads on RC decks. As stated earlier, the ultimate RC failure in decks is predominately due to shear failure. Deterioration starts with the presence of micro-cracks in the concrete caused by concrete shrinkage and other factors and the growth of these cracks is triggered by axle load cycles.
When transverse cracks are present, wheel loads cause differential movement of the deck from one side of the crack relative to the other side, causing the crack surfaces to rub against each other, both widening the crack and advancing the crack growth at the tip of the crack. A similar deflection occurs relative to longitudinal cracks; however, the stress range on one side of the crack would be higher than the other side. In each case the cracks develop in a pattern which is similar to the steel reinforcement grids present in the deck. The research by Yoshiki Tanaka, (et al., (2009) Public Works Research Institute (PWRI), Japan) clearly shows this grid-like crack pattern in the reinforced deck. In extreme cases the RC deck cracks turn from the vertical orientation to a horizontal orientation within the deck and arching action or membrane behavior takes over in resisting wheel loads.
The initial research (Tanaka et al., (2009) PWRI) showed that in early cycles (up to 16 percent of total service life) the slab resisted wheel loads in flexural mode. From about 16 percent of total service life to 84 percent of total service life (main life of span) the slab was exhibiting or transitioning to arching behavior. Beyond 84 percent of total service life the reinforcement provided increased tensile resistance and the slab/beam was acting as a “tied arch” or in membrane mode until failure. Also, after approximately 55 percent of total service life, the depth of the neutral axis relative to the center of the slab started to decrease dramatically, with an associated decrease in the elastic modulus.
Dynamic wheel load cycles cause the growth of grid like crack patterns on the bridge deck resulting in loss of strength and eventual punching shear failure. The presence of de-icing salts interacts with and accelerates the deterioration process.
- California Interstate Highway Bridge Case History, (Taken from NCHRP Report 495, 2003). This is a case history of two bridges in California. The first, the I-880 Nimitz Highway Bridge 33-0198 in Alameda County, which carries trucks, has worn at a much faster rate than the I-580 MacArthur Expressway Bridge (33-0324), which only carries passenger car and light truck traffic on a parallel highway. In the 37-year history of both bridges (recorded in the referenced document), the I-880 bridge deck was repaired and rehabilitated in the 29th year and continued to deteriorate, whereas the MacArthur Expressway bridge continues to operate with minor defects (transverse cracks and minor shallow spalls of 4” diameter or less).
Although the Nimitz Highway bridge deck was 1” thicker and had one major rehabilitation project, it exhibited more damage (e.g., spalls and large transverse cracks) than the thinner MacArthur Expressway Bridge that only allowed passenger vehicles and light trucks up to five tons at the end of the 37 year period.
Chloride-Induced Deck Deterioration
Contamination due to de-icing salts in cold, wet climate areas is a known accelerator of RC deck deterioration. Two similar studies by Virginia DOT (Williams et al., 2008) and Michigan DOT (Hu et al., 2011) have created deterioration models that predict the End of Functional Service Life (EFSL) in bridge decks due to de-icing salts.
The chloride contamination model asserts that the progressive corrosive effects of chlorides in concrete decks occur in 3 Phases:
Phase 1 - Diffusion: Chlorides migrate through the porous concrete surface through gravity and capillary action. The rate of migration of chloride salts into the concrete follows Fick’s Second Law, which is a linear approximation with respect to time. The chloride concentration levels must reach a certain threshold at the steel reinforcement bar level to induce corrosion in the steel. During this phase the corrosion process has not yet began. This time, T1 is estimated to be between 5 to 10 years.
Phase 2 - Rust Permeation & Accumulation: Corrosive products such as chlorides begin to change the chemical makeup of the concrete around the reinforcing bars and start the formation of expansive rust oxidation products such as Fe3O4, β-FeO (OH) and Fe3O3. Depending on the bar type time, T2 is estimated to initiate at 16 Years for bare steel and approximately 20 years for epoxy coated or galvanized steel. This is the period prior to corrosion-driven crack propagation and growth.
Phase 3 - Crack Propagation: Corrosion by product formation around the steel reinforcement bars has grown and expanded the concrete, exceeding the concrete’s rupture strength. Cracks begin to propagate within the concrete and then reach the surface. Freeze-thaw action and axle loads potentially transform these cracks to delaminations and then to surface spalls. This time, T3 can be estimated to occur at between 25 and 35 years.
The predictive models use the parameters of time and the likelihood that a deck is in one of the deterioration phases described above. Both the VDOT (Williams et al., 2008) and MDOT (Hu et al., 2013) models use a “Monte Carlo” statistical approach to predict the remaining life of a bridge deck. In addition, Virginia uses the density of defects (cracks, delaminations and spalls) per square foot of bridge deck to measure the stage of deterioration and Maryland tends to use the deck condition ratings from bridge inspections.
Combined Effect of Axle Loads and Chloride Contamination:
Both the Virginia and Michigan DOT studies acknowledge that truck axle loads are the primary driver of deck deterioration, but neither can quantitatively model the effect of dynamic wheel loads with their chloride-induced deck deterioration models.
Tanaka et al. (2009 PWRI Japan) attempted to account for the effect of chlorides used to melt ice and snow in cold wet climates in conjunction with dynamic axle loads. The concrete fatigue mechanism and the chloride-induced deck deterioration mechanism are two separate processes; however, at some point in the life of the bridge deck, these two processes begin to interact with one another and serve to accelerate deck deterioration. The relationship and interaction of the two mechanisms are still not well understood. Additional research is needed in this area. Tanaka et al. (2009) found that asphalt overlays on highway bridge decks served to delay chloride contamination in the concrete deck and hence delay additional crack growth and propagation. However, no clear relationship was established. This finding would appear to be verifiable only in the late stage of the deck’s service life.
Owner-Agency Policies on Repair, Replacement and Preservation
Owner agencies have policies in place that use a variety of tools to assist in their efforts to maintain the service life of bridge decks. A popular tool among many agencies is the AASHTO PONTIS® software. The software allows the user to store bridge inspection condition ratings and inventory data which is used to predict future condition ratings and recommend optimal preservation actions. This software is currently in use by 45 States and agencies. At least several State agencies have chosen to use PONTIS® supplemented by their own life-cycle analysis tools.
Virginia DOT uses the chloride contamination model described above along with a life cycle cost analysis to preserve and prolong bridge deck life. It is not clear if Michigan DOT has incorporated the model in its strategies, but they have employed “the mix of fix” philosophy as outlined in their Capital Scheduled Maintenance Manual.
The Nebraska Department of Roads, (NDOR) (Morcous, 2011) uses a life cycle cost assessment software using bridge condition rating and a stochastic approach to predict bridge and bridge deck service life, 2011, Project SPR-P1 (11) M302. The life cycle cost stochastic method “uses transition probability matrices for predicting the deterioration of bridge elements over a given analysis period.” In other words it tries to predict the transition of the bridge element from one condition rating to a lower rating based on existing condition rating data derived from empirical data and the AASHTO PONTIS® software. While the system is analyzing all bridge elements, here we are specifically looking at bridge deck deterioration. The rating system follows the Federal condition rating system (9 = Excellent Condition to 0 = Failed Condition).
Linear prediction models are most reliable when applied to short time spans. The stochastic approach is based on Markov chain theory. The Markov decision process (MDP) is used to develop stochastic (random) methods that treat the facility deterioration process with one or more random variables that capture the uncertainty that influences the deterioration process. Models based on a Markov chain approach can be state-based or time-based.
The NDOR approach is state-based (Markov chains) and can be described by the 9 condition rating Levels (9 – 1, 0 excluded). This is a measure of the probability that the bridge deck rating transits to a lower condition rating. A transition probability matrix is developed and guided from a historic bridge element rating database such as PONTIS® and/or an expert engineering decision making process. The probability matrix tables are further refined by taking into account environmental factors such as ADT and ADTT, cold or wet climatic conditions that may dictate the usage of chlorides, materials used (black rebar vs epoxy coated), etc.
It should be noted that the stochastic method is limited in that it can only predict general trends and costs. It can tell you that for higher (truck) traffic volumes deterioration rates will increase, but it cannot predict which trucks cause more damage. So, while it can inform a life cycle cost analysis and recommend a repair strategy, it is not directly applicable to the goals of this study.
NCHRP Project 20-24 (11), Phase 1, 2002 – “Synthesis of Asset Management Practices” studied programs in Arizona, California, Colorado, Michigan, New York, Pennsylvania and Washington State. Project researchers also looked at programs in Australia, New Zealand and Canada. The study concluded that, while this is an evolving field, many DOTs currently have stand-alone databases and methodologies that do not interact with other inter-agency databases. For example, bridge maintenance databases don’t necessarily interact with highway maintenance databases, although many of them are using similar tools and approaches. As a result, the effectiveness of their efforts is diminished.
Another NCHRP Project (14-15) resulted in NCHRP Report 668 – Framework for a National Database System for Maintenance Actions on Highway Bridges. In this project, researchers worked with the objective of developing a framework for a national database system for collecting and archiving bridge maintenance actions, materials, methods, and assessments of their effectiveness. The research included a review of current practices relevant to reporting bridge maintenance programs and developed the framework for a data system for collecting, storing, and reporting information on the contexts, actions, and outcomes of bridge maintenance. The establishment of the National Bridge Management Database (NBMD) would be a major step in establishing a data sharing culture among State DOTs. This effort supports the development of FHWA’s Long Term Bridge Performance program and is anticipated to provide the working data for predictive models.
Comparison of State Unit-Cost Data
As discussed above, owner agencies do not always define operations and maintenance (O&M) costs and capital rehabilitation and replacement costs in the same manner. In addition, State unit bid prices include dissimilar cost categories. This may be due to many factors:
- Climate – Some States, such as those in the southeast (e.g., Florida), rarely deal with ice or snow while others, such as those in the northeast, must deal with it regularly (e.g., New York or Vermont).
- Materials – For example, some States disallow the use of asphalt-based overlays (California Department of Transportation – as per Maintenance Policy Manual Chapter H, page H-16 and Indiana Department of Transportation as per 1999 internal memorandum, found in Frosch et al., 2013, Appendix A). These policies may be due to the fact that some repair materials just do not work well with their infrastructure, and the overlays tend to hide defects and trap water between the overlay and bridge deck, thus accelerating deterioration. On the other hand asphalt overlays are used in the New England States and in other countries with relative success (Frosch et al., 2013).
- Policy & Strategy– States develop policies and procedures to best suit their conditions. Some States have a complete replacement program in place, while others focus primarily on a preservation strategy.
The combination of all these factors leads to a wide array of options available to each owner agency for a given deck. There is some agreement among agencies. As stated in NCHRP Report 668,
[State] DOTs recognize maintenance as distinct from new construction, replacement of structures, and major rehabilitation of structures. Cleaning, painting, and minor repairs are always maintenance. Replacement or modification of portions of bridges may be maintenance if projects are small and have a short duration.” Emergency work, usually in response to accidents or extreme events, is classified as maintenance and can entail significant, temporary modifications of bridges.
In comparing State unit-cost data, the USDOT study team looked at the effects that trucks that the six scenario configurations have on bridge decks. One approach was to look at States that allowed overweight trucks and compare their bridge deck wear experience with States that do not allow overweight trucks. This exercise was found to be futile, in part due to the reasons stated above with regard to variations in State definitions and because all States do allow heavier legal trucks with permits. Furthermore, bridge deck thickness, girder or floor-beam spacing, and other general characteristics are different from one bridge deck to another.
One other approach was to compare car-only lanes with truck lanes on the same bridge. On this task we contacted several State agencies, including the New York State Bridge Authority (NYSBA), which owns and maintains five Hudson River bridge crossings in the Mid-Hudson Valley area. Of these, the Newburgh-Beacon Bridge (I-84) east bound span was considered to be a good candidate for comparison.
The east-bound span can carry up to four lanes of traffic and the bridge is posted for 55 tons. Lane 1 (right most lane) is closed to traffic most of the time and is used by maintenance vehicles and as a shoulder. The two center lanes, Lanes 2 and 3, allow trucks, and the far left lane, Lane 4, allows passenger vehicles only. The difference in physical appearance of the two center lanes vs. the car-only lane is dramatic. Potholes and repair patches in the two center lanes occur at least an order of magnitude greater than in the car-only lane and shoulder.
Figure 36: Photo of Newburgh-Beacon Bridge (I-84) Eastbound
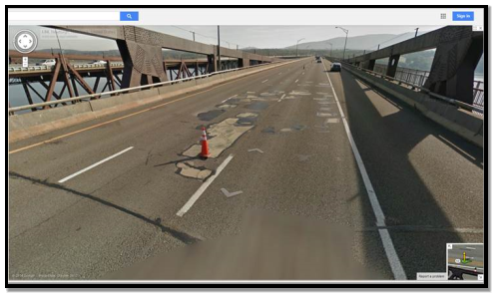
Photo provided by Google Maps
Indiana DOT was contacted to enquire about their heavy trucking corridor in the northern tier of the State (from Ohio & Michigan to Illinois) along the I-90 and US Route 20 corridor along with the Fort Wayne spur. Trucks less than 134,000 lbs. (67 tons) are allowed without a permit on US Route 20. Trucks less than 45 tons are allowed without permits on portions of I-94. Indiana DOT stated that currently the agency does not track maintenance, repair, or rehabilitation of the bridge decks on and off the heavy trucking corridor separately, and no quantifiable data is available. However, bridge superstructure and decks on the toll roads and within 15 miles of a toll gate are designed for the heavier Michigan Train Truck Loading.
In addition, Indiana DOT and Purdue University are conducting a joint study to:
- Determine stresses in Indiana bridges due to realistic over-weight truck loadings from WIM data,
- Calculate the damage and deterioration caused by overweight trucks to Indiana Bridges,
- Determine the reduction in service-life of bridges due to this damage, and
- Determine the lifecycle costs of this damage in conjunction with the INDOT JTRP Report SPR-3502 (not yet released).
This joint study will provide estimates of damage and reduction in service-life by conducting a number of detailed, finite-element analyses of certain representative bridge models of different types under different realistic loading conditions based on WIM data. The results from these analyses will be compiled into empirical formulas and encoded into a software tool for use by INDOT.
In Vermont, the DOT conducted a 1-year pilot study (resulting in the Vermont Pilot Program Report, 2012) to allow 99,000-lb. trucks to travel on the Interstate System portion of the State’s highways from 2009 to 2010. At the end of the study, the agency concluded:
Bridge decks and deck wearing surfaces may be affected by heavier loads, but the costs to address these impacts are likely to be small in comparison to overall State highway expenditures. Other bridge components such as deck joints, bearings, piers, and abutments also may be affected, but these impacts cannot be quantified with currently available analytical tools. Long-term infrastructure costs will likely be less than for other States, especially given the relatively small truck volumes on those bridges.
It is important to note, however, that Vermont has employed a design standard for its bridges that is based on a heavier design truck, and this may limit the applicability of lessons learned there to bridges in other States.
Bridge Deck Preservation and Preventative Maintenance
As part of this effort, the study team obtained unit costs for certain maintenance or construction activities. The purpose was not to seek unit cost bid data such as the cost of a cubic yard of Class C concrete that is routinely published in DOT databases for construction estimating, but rather to gather those project costs that would be necessary to complete a task such as bridge deck replacement and compare them with those costs that would be needed for bridge deck rehabilitation. These costs were in part derived from online data provided at websites maintained by State DOTs; however, it was very difficult to discern what was included in the cost records. For example, there are cases where substantial amounts of highway realignment work at the bridge approaches is included, but this cost often includes other cost components such as work zone traffic control, construction inspection, and engineering oversight. In many cases, prices may have included one of these additional cost components but not the others, or included costs for non-standard items. As a result, the USDOT study team was able only to establish a range of unit costs and representative averages for any of the cost categories at best.
In addition to State DOT web sites, sources for unit cost data included direct State DOT contacts and unit cost published reports. The average costs were intended to support the average project costs derived for the Bridge Damage Deterioration Model. The findings, outlined below, are divided into a region that uses de-icing agents and one that does not (i.e., all other states).
Region 1 (Northern States, De-icing agent users): the study team found a large range of variability between the low and high costs.
- Deck repair costs ranged from a low of $30.00/ft2 to $45.00/ft2 with an average of $36.00/ft2. Repairs could include crack sealing, spall patching, or overlays.
- Deck rehabilitation costs ranged from a low of $42.00/ft2 to $125.00/ft2 with an average of $60.00/ft2. Rehabilitation could include partial depth hydro demolition & overlay or some other mode of removal. The price also includes incidentals such as removal and replacement of the bridge railings, pavement grooving, and striping.
- Deck replacement costs ranged from a low of $65.00/ft2 to $147.00/ft2 with an average of $93.00/ft2. These costs included work zone traffic control, bridge railings, deck joint work, and construction inspection.
Region 2 (All other States):
- Deck repair costs ranged from a low of $21.00/ft2 to $67.00/ft2 with an average of $33.00/ft2. Repairs could include crack sealing, spall patching or overlays.
- Deck rehabilitation costs ranged from a low of $32.00/ft2 to $58.00/ft2 with an average of $42.50/ft2. Rehabilitation could include partial depth hydro demolition & overlay or some other mode of removal. The price also includes incidentals such as removal and replacement of the bridge railings, pavement grooving, and striping.
- Deck replacement costs ranged from a low of $39.00/ft2 to $114.00/ft2 with an average of $66.00/ft2. These costs included work zone traffic control, bridge railings, deck joint work, and construction inspection.
See Table 32 for a breakout of deck repair, rehabilitation and replacement unit costs by region and State.
Observations
- According to AASHTO, bridge decks have 8 to 10 times more ultimate strength capacity than necessary to carry trucks up to a maximum GVW of 80,000 lbs., a strength-based limit state. Accordingly, bridge owner agencies will not have to replace bridge decks if any of the study scenarios are implemented.
- Although current bridge decks appear to have adequate ultimate strength to accommodate any of the scenarios, serviceability issues must be considered separately and may warrant thicker decks to reduce overall deck costs.
- Both short-term repair cycles and long-term deck replacement intervals are difficult to determine precisely since predictive models are either based on chloride contamination models, load-based (fatigue stress-cycle) models, or condition-based stochastic models alone.
- In the long term, bridge deck service life is driven by wheel and axle loads; however, the effect may be mitigated by low-cost preservation actions. Different States have adopted various tools, models and software programs to assist in the decision-making process. While these tools are not standardized, there is an ongoing effort to develop a national database, the National Bridge Management Database (NBMD) to support FHWA’s Long Term Bridge Performance program.
- Testing and research in bridge deck service life—which must include more than one deterioration mechanism (e.g., load-based testing in a dry vs wet environment)—has yet to be undertaken. Some long-term testing of bridge decks is underway, most notably in Indiana, to understand the long-term effects of heavy trucks on bridge decks and superstructures.
Consideration of Impacts to Local Bridges
An assessment of structural impacts that the six scenario vehicles would have on bridges located on non-Interstate NHS roadways would not differ from the results produced and presented in this study. Generally, local bridges feature shorter span lengths than bridges located on roadway networks with higher functional classifications. The design, construction, and management of local bridges vary greatly considering that there are thousands of independent local owners across the Nation with differing practices, and it is difficult to draw detailed conclusions about impacts. Although the USDOT study team did not use a sample of local bridges in this study, the majority of local bridges are short, simple (single) spans. Thus, we can look at the relative magnitudes of shears and moments generated by the scenario trucks for this span range and draw very broad conclusions. Figures 26 and 27 indicate that for short simple spans (20-40 ft.) Scenarios 2, 3, and 4 show an increase, Scenarios 5 an 6 show a decrease, and Scenario 1 is flat, related to flexural load effects as compared to control.
References
Altay, K.A., Arabbo, D.S, Corwin, E.B., Dexter, R.J., French, C.E. (2003). “Effects of Increasing Truck Weights on Steel and Pre-stressed Bridges”. University of Minnesota. Minnesota Department of Transportation.
American Association of Highway and Transportation Officials (2011). Load Resistance Factor Design Specifications, 6th Edition, Washington DC.
American Association of Highway and Transportation Officials (2002). Standard Specifications for Highway Bridges, 17th Edition, Washington DC.
American Association of Highway and Transportation Officials (2013). The Manual for Bridge Evaluation, 2nd Edition with interim updates, Washington DC.
California Department of Transportation (CalTrans) (2006). Highway Maintenance Manual, Volume 1, Chapter H. http://www.dot.ca.gov/hq/maint/manual/maintman.htm
Cohen, H., Fu, G., Dekelbab, W., Moses, F. (2003). “Predicting Truck Load Spectra Under Weight Limit Changes and Its Application to Steel Bridge Fatigue Assessment”. American Society of Civil Engineering, Journal of Bridge Engineering, Vol. 8, No. 5, pp 312 – 322.
Engineering News Record, Published City Cost Indices, February 2014.
European Transport Sector (2008). Cost Allocation for Transportation Infrastructure Sector (CATRIN) Cost Allocation Practices in the European Transport Infrastructure Sector. European Union.
Fang, K.I., (1985). “Behavior of Ontario Type Bridge Deck on Steel Girders”. PhD. Dissertation University of Texas
Fisher, J.W., (1977). “Bridge Fatigue Guide Design & Detail”. American Institute of Steel Construction.
Frosch, R. J., M. E. Kreger, and B. Strandquist (2013). Implementation of Performance-Based Bridge Deck Protective Systems. Publication FHWA/IN/JTRP-2013/12. Joint Transportation Research Program, Indiana Department of Transportation and Purdue University, doi: 10.5703/ 1288284315214.
FHWA (2000). “Guidelines for Conducting A State Highway Cost Allocation Study Using the State HCAS Tool”.
FHWA (2001). Analysis of the Vehicle Inventory and Use Survey for Trucks with Five-Axles or More. Office of Transportation Policy Studies
FHWA (2014), MAP-21 Comprehensive Truck Size and Weight Limits Study Website.
Fu, G., Alampalli, S. and Pezze, F. P. (1992) “Long-term Serviceability of Isotropically Reinforced Concrete Bridge Deck Slabs”, TRB Transportation Research Record 1371, 1992
Fu, G., Alampalli, S., Pezze, F. P. (1994) "Lightly Reinforced Concrete Bridge Deck Slabs on Steel Stringers: A Summary of Field Experience", Final Report on R142 to FHWA, FHWA/NY/RR- 94/161, Engineering Research and Development Bureau, New York State Department of Transportation, June 1994
Hearn, G. (2012). “Deterioration and Cost Information for Bridge Management”. University of Colorado.
Holowka, M.R.A., Dorton, R.A., Csagoly, P.F. (1980). “Punching Shear Strength of Restrained Circular Slabs”. Ministry of Transportation and Communication, Ontario Canada
Hu, N., Haider, S., Bugueno, R., (2013). “Development and Validation of Deterioration Models for Concrete Bridge Decks: Phase 2: Mechanics Based Degradation Models” Michigan State University. Michigan Department of Transportation.
KLS Engineering & Wilbur Smith Associates (2010). “District Wide Truck Size & Weight Study” for the District Department of Transportation, Washington, DC.
Kostem, C.N. (1978). “Overloading Of Highway Bridges--Initiation of Deck Damage” Transportation Research Record No. 664, Bridge Engineering, Volume 1. Proceedings of the Transportation Research Board Conference.
Krauss, P.D., Rogalla, E.A. (1996). “Transverse Cracking in Newly Constructed Bridge Decks – United States”. National Research Council (U.S.), American Association of State Highway and Transportation Officials, National Cooperative Highway Research Program.
Laman, J.A., Ashbaugh, J.R., (1997). “Fatigue Impacts on Bridge Cost Allocation”. Paper 98-0417
Laman, J.A., Ashbaugh, J.R., (2000). “Highway Network Bridge Fatigue Damage Potential of Special Truck Configurations”, International Bridge Engineering Conference, National Research Council. TRB 1696.
Matsui, S., (1991). “Fatigue Deterioration Mechanism and Durability of Highway Bridge RC Slabs”. Report to Hanshin Expressway Public Corporation (in Japanese).
Morcous, G., (2011). “Developing Deterioration Models for Nebraska Bridges”, University of Nebraska, Nebraska Department of Roads
National Transportation Commission (NTC) (2005). Third Heavy Vehicle Road Pricing Determination Technical Report. Australia
Ohio Department of Transportation (2009). Impacts of Permitted Trucking on Ohio’s Transportation System and Economy, Final Report.
Pavement Interactive, link: http://www.pavementinteractive.org/article/equivalent-single-axle-load/
Perdikaris, P.C., Petrou, M.F., Wang A., (1993). “Fatigue Strength and Stiffness of Reinforced Concrete Bridge Decks”, Final Report to ODOT, FHWA/OH-93/016, Case Western Reserve University.
Reisert, J. A., and M. D. Bowman (2005). Fatigue of Older Bridges in Northern Indiana due to Overweight and Oversized Loads, Volume 1: Bridge and Weigh-In-Motion Measurements. Publication FHWA/IN/ JTRP-2005/16-1. Joint Transportation Research Program, Indiana Department of Transportation and Purdue University, doi: 10.5703/1288284313378.
Ramey, G.E., Balmer, D.M., (2000). “Assessing the Cost/Benefits of Employing Thicker Bridge Decks in Alabama” Final Report. Highway Research Center, Auburn University.
Satoh. T., Mitamura, H., Adachi, Y., Nishi, H., Ishikawa H., Matsui, S. (2008). “Fatigue Durability of a Reinforced Concrete Deck Slab in a Cold Snowy Region”. Public Works Research Institute (PWRI), Civil Engineering Research Institute for Cold Region (CERI), Japan.
Tanaka, Y., Murakoshi, J., Nagaya, Y., (2009). “Fatigue and Corrosion in Concrete Decks with Asphalt Surfacing”. Public Works Research Institute (PWRI), Japan. Proceedings of the 25th US-Japan Bridge Engineering Workshop.
Transportation Research Board (1987). Fatigue Evaluation Procedures for Steel Bridges. NCHRP Report 299. Washington, DC.
Transportation Research Board (2000). Manual for Condition Evaluation and Load Rating of Highway Bridges Using Load and Resistance Factor Philosophy. NCHRP Project 12-46, Washington, DC.
Transportation Research Board (2003). Effect of Truck Weight on Bridge Network Costs. NCHRP Report 495. Washington, DC.
Transportation Research Board (2006). Legal Truck Loads and AASHTO Legal Loads for Posting. NCHRP Report 575. Washington, DC.
Transportation Research Board (2008). State Highway Cost Allocation Studies; A Synthesis of Highway Practice. NCHRP Synthesis 378. Washington, DC.
Transportation Research Board (2009). Bridge Management Systems for Transportation Agency Decision Making. NCHRP Report 397. Washington DC.
Transportation Research Board (2010). Framework for a National Database System for Maintenance Actions on Highway Bridges. NCHRP Report 668. Washington, DC.
Transportation Research Board (2011). Directory of Significant Truck Size and Weight Research. NCHRP Project 20-07, Task 303. Washington, DC.
Transportation Research Board (2002). Task 1 of 3: Synthesis of Asset Management Practice NCHRP Project 20-24(11), Phase 1. Washington, DC.
Transportation Research Board (2012). Evaluation of Load Rating by Load and Resistance Factor Rating. NCHRP Report 700. Washington, DC.
Transportation Research Board (2012). Fatigue Evaluation of Steel Bridges. NCHRP Report 721. Washington, DC.
Vermont Pilot Program Report - a Truck Size and Weight Study (2012). Report No. VT_Pilot_2012. Federal Highway Administration (FHWA), Office of Freight Management and Operations. Washington, DC.
Vehicle Information Use Survey, VIUS (1997). US Census Bureau. “The Analysis of the Vehicle Inventory and Use Survey for Trucks with Five-Axles or More”, 2000.
Wang, Liu, Huang, Shahawy (2005) “Truck Loading and Fatigue Damage Analysis for Grider Bridges Based on Weigh-in-Motion Data” American Society of Civil Engineers, Journal of Bridge Engineering, Vol. 10 p. 1- 12.
Williams, G., Weyers, R., Brown, M., Sprinkel, M. (2008). “Bridge Deck Service Life Prediction and Costs”. Virginia Polytechnic Institute, Virginia Transportation Research Council. Virginia Department of Transportation.
[2] Fatigue truck intended for fatigue loading, the magnitude and configuration of which is based on AASHTO LRFD 2007, Article 3.6.1.4.1. Return to Footnote 2
[3] “Current code approach” for structural design is a member-based approach where the safety of individual members contributes to a cumulative safety effect for the entire structure. Return to Footnote 3