Comprehensive Truck Size and Weight Limits Study - Bridge Structure Comparative Analysis Technical Report
Chapter 1: Bridge Task Desk Scan and Research
1.1 Introduction
The bridge desk scan was initially conducted to find relevant information and data with respect to the bridge structural analysis, cost responsibility, and fatigue studies. It was then expanded to address the general issues of the bridge deterioration mechanisms and bridge deck deterioration modeling.
With respect to the bridge structural analysis and the load rating subtask, the most relevant guiding documents are a series of American Association of State Highway and Transportation Officials (AASHTO) manuals – the Standard Specifications for Highway Bridges, 17th Edition, 2002; the Load and Resistance Factor Design (LRFD) Bridge Design Specifications; and the Manual for Bridge Evaluation, 2nd Edition 2013; which covers both bridge inspection requirements and LRFR load rating procedures.
The prevailing sense of the research was that the subject area of the bridge structural analysis methods are proscribed and regulated by AASHTO and the statutes of the governing State transportation agencies.
With respect to the Bridge Cost Responsibility work, there has not been one accepted and proven methodology for allocating bridge damage cost responsibility.
The study team reviewed numerous State-sponsored studies as well as those conducted in other countries. An unpublished 2010 District Wide Truck Safety Study for Washington DC was evaluated for applicability to the work being undertaken in this part of the study. Concepts and information from the NCHRP Report 495, Effect of Truck Weight on Bridge Network Costs (2004) were also considered for use in developing a methodology to estimate bridge costs and needs. Numerous permutations of the Federal/ Incremental Method (FHWA HCAS Guidelines, 2000) have been applied in various ways, and load-based allocations continue to be employed in part or in combination with other approaches. No method has been successfully applied on the scale of a U.S. Federal study. See Section 1.3 below for a review of this history.
Following a further review of this work by FHWA bridge program experts, the study team decided not to include this work in the Study since it does not represent a generally accepted methodology or approach that is widely used and understood by the larger bridge community.
The FHWA is engaged in the development process for the Long Term Bridge Performance (LTBP) program, which is intended to provide a more detailed and timely picture of bridge health, improve knowledge of bridge performance, and lead to better bridge management tools. The National Bridge Management Database (NBMD), currently under development, will be a resource for the LTBP to better understand the impact of changing truck configurations on bridge performance.
1.2 Structural Analysis Methodology
The AASHTO LRFD Bridge Design Specifications (LRFD Specifications) introduced a limit state design philosophy, based on structural reliability methods, to achieve a more uniform level of safety (reliability) in bridge design. Limit state design (LSD), also known as load and resistance factor design (LRFD), refers to a design method used in structural engineering. A limit state is a condition of a structure beyond which it no longer fulfills the relevant design criteria. The condition may refer to a degree of loading or other actions on the structure, while the criteria refer to structural integrity, fitness for use, durability or other design requirements. A structure designed by LSD is proportioned to sustain all actions likely to occur during its design life, and to remain fit for use, with an appropriate level of reliability for each limit state. A National Cooperative Highway Research Program project (NCHRP Project No. 12-46, 2000) was initiated in March 1997 to develop a new AASHTO Load and Resistance Factor Rating Manual for Highway Bridges. The objective of the project was to develop a manual with supporting commentary and illustrative examples for the evaluation of highway bridges by the load and resistance factor method. The final draft of the Manual for Condition Evaluation and Load and Resistance Factor Rating of Highway Bridges (LRFR Manual) was completed in March 2000 and was adopted as a Guide Manual by the AASHTO Subcommittee on Bridges and Structures at the 2002 AASHTO Bridge Conference. In the following years, the LRFR Manual was revised, expanded, and renamed as the AASHTO Manual for Bridge Evaluation (AASHTO MBE, 2013). At the time of this writing, the AASHTO MBE, 2nd Edition with 2014 Interim Revisions is the most current edition of the manual. Load and resistance factor rating (LRFR) and load factor rating (LFR) are the current national standards for load ratings. Unlike LFR, in LRFR, only a single load rating is derived for legal and permit loads; this load rating reflects the safe load capacity of the bridge for a particular truck.
Compared to the load factor rating (LFR) and the allowable stress rating (ASR) methodologies, the LRFR methodology provides a systematic and more comprehensive approach to bridge load rating that is reliability-based and provides a more realistic assessment of the safe load capacity of existing bridges. Unlike past load rating methods (ASR and LFR), LRFR provides uniform reliability in load ratings and postings across varying span lengths and bridge span configurations. The LRFR methodology adopts a tiered approach to load rating for design, legal, and permit loads that provides an efficient approach to bridge evaluation and the flexibility to perform more detailed evaluations when necessary to avoid load restrictions or bridge strengthening. Acceptable minimum reliability indices for evaluation have been determined by calibrating to past load rating practice. An appropriate increased reliability index is maintained for deteriorated and non-redundant bridges by using condition and system factors in the load rating equation. The influence of truck traffic volume, characterized by Average Daily Truck Traffic (ADTT), on the probability of high-load events and simultaneous truck crossings were considered in the calibration process and incorporated in legal and permit live load factors. Detailed procedures for bridge fatigue evaluation and load testing consistent with the LRFD philosophy have been included in the methodology to encourage more widespread use of these technologies.
The load rating is generally expressed as a rating factor for a particular live load model. The following general expression is used in determining the load rating of each component and connection subjected to a single force effect (i.e. axial force, flexure or shear):
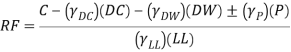
For the Strength Limit States:
![]()
where:
RF = Rating factor
C = Capacity
Φc = Condition factor
Φs = System factor
Φ = Resistance factor
Rn = Nominal member resistance (as inspected)
DC = Dead load effect due to structural components and attachments
DW = Dead load effect due to wearing surface and utilities
P = Permanent loads other than dead loads
LL = Live load effect
IM = Dynamic load allowance
γDC = LRFD load factor for structural components and attachments
γDW = LRFD load factor for wearing surfaces and utilities
γp = LRFD load factor for permanent loads other than dead loads
γLL = Evaluation live load factor
A normalized rating factor can also be computed to make comparisons of rating results from two different live load models. The normalized rating factor is determined by dividing the rating factor computed for a live load model by the rating factor computed for a baseline vehicle.
Bridge posting involves a consideration of safety, economy, and the public interest. Statutory law governs the maximum weight of vehicles legally allowed on bridges without special overload permits. Weight limits are required for bridges that are found to be structurally inadequate. The National Bridge Inspection Standards (NBIS Section 23 of Code of Federal Regulation Part 650) require that every bridge be rated for its safe load-carrying capacity in accordance with the AASHTO (MBE, 2013). According to the NBIS:
If it is determined under this rating procedure that the maximum legal load under State law exceeds the load permitted under the Operating Rating, the bridge must be posted in conformity with the AASHTO Manual or in accordance with the State law.
Posting regulations, including the criteria for initiating a posting action, methodology for setting the allowable truck weight limit, and techniques for how the limits should be represented on highway signage vary widely among agencies. The NBIS provides limited guidance on evaluating and posting weight limits on bridges. In this regard, State department of transportation (DOT) posting policies will usually take precedence.
A Rating Factor (RF) of 1.0 was set as the acceptance criteria when making load posting decisions or determining bridge improvement needs. The choice of load posting or strengthening versus replacement is mostly based on the available funding, importance of the structure, as well as the availability of alternate travel routes. The results of this study are based solely on analytical methods and do not consider State policies with regard to postings.
The data-driven study described in this report provides an objective comparison of posting impacts across the various jurisdictions and provides a uniform basis for decision making that is driven by bridge safety considerations. Being data-driven, this approach is entirely transparent and is applied consistently over the entire database. Additionally, the most current national standards for bridge load rating were used as the basis for posting evaluations to maximize reliability and confidence in the results.
1.3 Cost Allocation Methodology
A Short History of Truck Size and Weight Studies
Over the years there has been a large volume of studies and research related to truck size and weight as well as attempts by agencies, university academics, and consultants to determine means and methods to assign cost responsibility for infrastructure investments to a diverse set of roadway users. The breadth of these studies, diverse interests, and funding levels by the supporting agencies make them a challenge to conduct. Alack of consensus on methodologies and elements of study to be included has had contributed to inconsistency among the results and conclusions. Various studies were employed to answer fundamentally different questions. Another factor that has presented a further challenge is the data gap issue. Quality and quantity of viable information in the format desired are inconsistent. The data can be “mined” and “scrubbed” and often must be reconfigured to address the needs of a particular study. Given these challenges, it is still possible to identify the most applicable of the existing approaches and build on them.
Research
Existing literature references that were found in an unpublished District of Columbia Department of Transportation report (the “District-wide Truck Safety Enforcement Plan,” May 2010) was used as a starting point to guide research in this area. The bibliographies found in this report pointed toward additional sources of information. In addition, various search engines were used to search the internet for other work available. The study team perused Web sites for domestic and foreign universities and transportation agencies to obtain more data and identify the information available in the academic community. Journals available through the American Society of Civil Engineers and the Knovel Online Library enabled access to archived or proprietary studies. A few other resources were identified as part of the research to develop Desk Scan references for the other technical areas included under the Study.
The result of these efforts was a comprehensive list of references with summary descriptions of each study and a commentary on its relevance to this study in the Bridge Task Desk Scan Document (Appendix A). As new and other relevant documents were identified during the course of completing the study, they have been added to the desk scan document.
The purpose and result of the literature search was to provide a starting point and a framework for the work required to complete this area of the study. The following sections provide a brief history of the most relevant documents found that pertain to the major topics and issues addressed in this bridge structure comparative analysis.
Other Cost Methodologies
The USDOT study team reviewed a number of different cost allocation methodologies. The most prevalent method used in the United States in the past decade (1997 – 2012) has been the “Federal Method,” as described in the 2003 NCHRP Report 495– Effect of Truck Weight on Bridge Network Costs, which was derived from the 1997 FHWA Highway Cost Allocation Study. Both of these documents are a refinement of the previous incremental methods developed in the 70s and 80s. The Federal Method has been developed for use by individual States and local highway network authorities and has not been adapted to any national or even regional studies. To implement the Federal Method on a national scale would require a level of detail not available in a consistent format in the National Bridge Inventory System (NBIS) and potentially not available at all. The required information includes detailed structural data for each bridge, bridge-specific condition data, current detailed cost and expenditure data, and weigh-in-motion (WIM) data specifically applicable to bridges. It should be noted that States have different policies and procedures as they relate to bridge posting, rehabilitation, and preservation. It would be extremely difficult to reflect all of those policy differences in a national study.
States have used the Federal Method in modified formats to allocate bridge costs. They have also used varied allocators (vehicle miles traveled (VMT), passenger car equivalent (PCE), passenger car units (PCU), average gross mass (AGM) or equivalent single axle load (ESAL)) for different bridge elements and for various other bridge-related costs. It should be stressed that there has been no uniformity or consensus in regard to what should be included in a “bridge allocation study.” Perhaps most importantly, States have designed the methodologies used in those prior studies to answer different questions. As noted above, the Federal Method cannot generate cost allocation at the level of detail envisioned under this current Study, or with a similar degree of transparency as one would hope to have for a study on a national scale. However, some aspects of the Federal Method, as set forth in NCHRP Report 495 (2003), can augment the application of any approach developed in the future.
Two reports chronicle the previous research related to cost responsibility in the United States. NCHRP Synthesis 378 (2008) provides a detailed history of U.S. cost allocation studies by State from the early 1940s through 2008. NCHRP 20-07 Task 303 (2011), “Directory of Significant Truck Size and Weight Research” is similar to the Synthesis 378 report but adds additional studies through 2011. Both documents provide summary conclusions drawn from the various studies regarding bridge costs and the effect of overweight trucks.
One notable study conducted in the United States was conducted in Vermont and resulted in the Vermont Pilot Program Study (2012). Under the Consolidated Appropriations Act of 2010(PL 111-117), the State of Vermont raised truck size and weight limits on its Interstate System for a period of 1 year, beginning December 2009. The State allowed the six-axle trucks with a maximum of 99,000 lbs. GVW that were operating on Vermont’s State Highway System to operate on the State’s 280 miles of Interstate and 265 bridges. The Pilot Study Team investigated the effects of these higher weight trucks on bridge safety (structural demands) and durability (service life). The structural demands were assessed by conducting load rating analysis of a select number (about 10 percent) of the most vulnerable bridges. The Vermont study team evaluated the service lives of the bridges using a fatigue limit state. Twenty-five bridges (23 steel and 2 concrete) were selected, which represented the mix of bridge types, age, condition, lengths and material on the Vermont Interstate Highway System. According to the study, “The fatigue limit states… are based on the probabilities of failure on the member resistance. Estimating the remaining fatigue life with this limit state can provide a measure of the loss of service life. Since the majority of the bridges are steel, the fatigue limit states can be used to estimate the effects of increased gross vehicle weight (GVW) on service life.”
The method involved estimating the fatigue lives of the 23 steel bridges for a baseline control loading with trucks in the existing fleet and then comparing it to the fleet of trucks (including the 99,000 lb. pilot study truck) operating during the pilot study year (December 2009 to December 2010). WIM and VMT data were used to determine the mix of trucks prior to 2009 and the mix during the pilot study year. AASHTO Category C fatigue details (such as shear studs, diaphragm connection plates, and stiffeners) were used. The Category C welds are widely used on steel bridges and the Vermont study team assumed that these common fatigue details would occur at the points of maximum stress. The measure of the fatigue life was assumed to be a broad indicator and “meaningful” measure of the impact of the 99,000 lb. truck on the bridge superstructure service life. The results indicated that 19 of the 23 steel bridges had an infinite fatigue life and would not be affected by the introduction of the 99-Kip[1] truck. The remaining 4 of the 23 bridges had a fatigue life that exceeded the 75-year design life of the bridges. Notably, a similar study of longer duration with a calibration of the limit state to the recognized service life of the bridges might yield another cost allocation approach. It is important to note that this pilot study may not be applicable to other States’ bridges because Vermont has employed a design standard for its bridges that is based on use by heavier trucks than those authorized under the STAA.
Methodologies used in Europe and Australia were also reviewed. The European Union (E.U.) Cost Allocation of Transport Infrastructure (CATRIN, 2008) synthesis document of 2008 is a summary of methods of cost allocations used in the transportation industry (including roadways, railway, air transport and maritime) in Europe. Countries submitting studies included Austria, the UK, Belgium, Denmark, Finland, Germany, Poland, the Netherlands, Sweden and Switzerland. The methodologies these countries use to assess the allocation of roadway costs (including bridges) range from an econometric or “top-down” approach as well as an engineering or “bottom-up” approach. What is clear from this document is that there is a huge disparity of approaches between these countries due to data availability, cost categories, etc. In the end the document does not sum up the cost responsibilities from each country, but rather summarizes the approaches used by each in a tabular format. So, all that can be surmised from this tabular matrix is that in some cases load-based allocators were used for highway cost allocation, including for bridges (either directly or in-directly). The Netherlands and Switzerland used them on their roadways and then broke out bridges as a percentage of overall costs. In Finland they used bridges directly in their cost allocation study. No new engineering methods were introduced; except for in Germany (The Maut Study) where researchers applied PCEs. Another observation is that the number of vehicle classes used in the cost responsibility procedures shows a great variance among the countries, ranging from 6 to as many as 27 (Netherlands), 30 (Switzerland), and 37 (United Kingdom) vehicle classes.
The Australian Method, as reported in the National Transport Commission’s Third Heavy Vehicle Road Pricing Determination Technical Report (October 2005), uses a number of allocators to determine shares of vehicle cost responsibility. The study lumps all costs under “roadway” costs and then breaks out pavement and bridge costs. Bridge costs are compiled from the various regional transport industries and are categorized as Attributable and Non-attributable Costs. Original and new bridge construction costs are considered Non-attributable costs and are allocated by vehicle usage or vehicle kilometers traveled (VKT). These costs were estimated at 85 percent of all bridge costs. The Attributable Costs include preservation and maintenance, repairs and rehabilitation, and were estimated at 15 percent of all costs, with allocation based on PCUs. The Australian report acknowledged that there was a relationship between load-based allocators and bridge deterioration, but it stopped short of suggesting a method other than using PCUs. The report states “For other non-pavement expenditure (i.e., bridge) categories, there is little international consensus, and little information on which to judge to what extent alternative approaches might be applicable to Australia.” In other words the Australian report does not endorse any othermethod for allocating bridge costs.
The Australian report, however, does present some apparent advantages. The Australian Bureau of Statistics (ABS) conducts a comprehensive, national Survey of Motor Vehicle Use (SMVU), which includes statistics on an annual basis on the number of vehicles, VKT, fuel consumption and AGM of all vehicles. It collects these data on 35 vehicle classifications (from motorcycles to passenger cars to busses and trucks) by roadway classification (main highway, arterial, local etc.) and on a State by State basis. Data collection in this manner would greatly facilitate any future study. A document similar to the Australian SMVU was found in the United States: the 1997 Vehicle Inventory Use Survey (VIUS, 1997, by the US Census Bureau) which was then published and analyzed in The Analysis of the Vehicle Inventory and Use Survey for Trucks with Five-Axles or More (2000). However, this document represents the last census data collection effort of this kind in the United States and was discontinued after 2000. It was collected by the FHWA Office of Transportation Policy Studies (2002).
In summary, the USDOT study team found the following:
- In the United States, no nationwide studies have been purely of bridge costs have been conducted to date that use a load-induced cost responsibility allocator.
- Internationally, there has been little consistency of data across states or other political boundaries.
- In part due to the lack of uniform data collection policies, there has also been little consistency in the methodologies used by the various agencies for assigning cost responsibilities across states (or provinces) and other political boundaries.
- These studies have used various metrics to help apportion, allocate or assign costs to the various truck classifications. The advantages and disadvantages of these metrics can be described as follows:
- Weigh-in-motion (WIM) Data: Data records include station description, traffic volume and count, speed data, vehicle classification based on FHWA’s Traffic Monitoring Guidelines (TMG), and weight data.
Advantage: The data provides axle load estimates and counts – including the frequency and magnitude of axle weight measurements. Every State, through FHWA’s Traffic Monitoring Program, monitors and reports vehicle volumes by type of vehicle, which makes the data current and readily available. Data is also reported to the FHWA in a standardized format.
Disadvantage: However, there are drawbacks to using WIM data to estimate system-level loading. The most critical challenge in using WIM data is system coverage. WIM sites are expensive to install and maintain, which affects the coverage of the system that WIM readings represent. As stated above, the initial raw data provides much of the basic information needed. However it cannot be used in its raw form since the data is highly fragmented—being collected at the vehicle axle level—and must be processed by scrubbing, aggregating, and weighting (by other parameters such as VMT) and then translated into usable format. In this final format much of the original detail may have been altered. For example, truck counts are collected at individual stations. However, these are only a snapshot of the data for a given day and hour of data collection. Different stations in the State may collect these data at different times, so as the data is aggregated, there will be gaps and overlaps. In order to compensate for these inconsistencies, the data are processed with subroutines to derive a sub-data set that represents the truck traffic stream in a given State.
- Vehicle miles traveled (VMT): VMT is an indicator of the travel levels on the roadway system by motor vehicle class. VMT is estimated for the given time period that is based upon traffic volume counts and roadway length. This metric is one of many allocator types used to estimate consumption of wearing surfaces on pavements and bridge decks.
Cons: The problem with using VMT as an allocator by itself is that it assumes equal consumption based on the relative miles traveled and does not account for the vehicle axle weight. For example, in applying VMT, it is assumed that a 3,500 pound car consumes the same stretch of pavement as an 80,000-lb., five-axle (3-S2) tractor semitrailer for the same distance traveled. Another problem with VMT is more specific to bridges: using VMT as a sole allocator presumes that bridges are distributed proportionally to the number of highway miles. However, bridge density (length of bridges and their count) per mile of highway varies geographically based on rural and urban environments, number of water crossings, and overpasses of intersecting roadways. Further, bridges are neither uniformly or proportionally located in relation to highway miles (for example, a bridge is not located at a constant rate across the highway miles).
- Passenger car equivalents (PCE): PCE equates any of the TMG vehicle classes to a PCE or a passenger car unit (PCE or PCU) and is essentially the impact that a mode of transport has on traffic variables (such as headway, speed, density) compared to a single car. It is derived from taking a certain mixed traffic stream and heuristically or statistically converting it into a hypothetical passenger-car stream.
Disadvantage: Similar to VMTs, PCEs do not take into account axles loads. As an allocator it might be more useful to estimate delays and backups that may occur at a certain location (such as a bridge under construction). But the PCE is more of a capacity-based allocator and cannot provide a suitable estimate of the physical load impacts those trucks would have on the bridge itself.
- Equivalent single axle load (ESAL), load equivalency factor (LEF): The ESAL was originally derived in the 1940s after large trucks started to populate US highways and was introduced by AASHTO in a rather complex formula that was based on a standard truck axle weight of 18,000 pounds. The premise was that the standard 18,000-lb. axle induced a unit of damage on pavement. The complex formula was eventually reduced to a more simple ratio of actual axle load divided by the standard axle (i.e., 18,000 lbs.) raised to the 4th power, which is the LEF. It was later postulated that for different types of pavement (flexible or rigid) and substrate, the power of 3 may be more appropriate (PavementInteractive.org). Many transportation agencies in the United States and Europe (CATRIN, 2008) used variations of this formula to estimate impacts to bridges, and various power ratios were selected ranging from 2.0 to 4.0. Some agencies used the method directly to estimate pavement (highway) impacts and pulled out bridge costs simply as a percentage, while others applied the ESAL damage index directly to their bridges.
In time, new pavement damage models and methodologies were developed such as those found in AASHTO’s Mechanistic-Empirical Pavement Design Guidelines (MEPDG). In spite of this, the ESAL/LEF methodology continues to be used by some State transportation agencies because it provides a method of incorporating axle loads and frequency of occurrence to estimate pavement and bridge damage. MEPDG modeling regiments continue to be developed and refined and are emerging as the preferred approach in estimating pavement impacts caused by various vehicles. The MEPDG is used in the Volume II: Pavement Comparative Analysis portion of this study.
Advantages: The ESAL/LEF provides a relatively transparent way of estimating damage to a network of bridges in a State or region without having detailed data on each and every bridge in the State or region.
Disadvantages: The ESAL is tied to the 18,000 lb. standard axle load and to a pavement-based exponential power. Furthermore, it employs a power exponent that is not a factor in the mathematical sense, implying the function was not well understood. As a result, the ESAL/LEF is not used in this bridge comparative analysis.
- Weigh-in-motion (WIM) Data: Data records include station description, traffic volume and count, speed data, vehicle classification based on FHWA’s Traffic Monitoring Guidelines (TMG), and weight data.
Pros and Cons of Cost Responsibility Assignment Methods
The background of each of these methods is related and has been chronicled elsewhere in this document. However, a brief statement of the methodology is necessary in order to highlight the pros and cons.
Incremental/Federal Method (as described in NCHRP Report 495, 2003)
The concept is rather simple; however, its implementation is very complex and becomes increasingly so for large systems. The cost impacts are categorized as impacts to:
- Existing bridge superstructures,
- New bridge superstructures,
- Steel fatigue details, and
- Reinforced concrete deck crack propagation (termed “reinforced concrete fatigue” in report 495).
The process for all cost categories includes selecting a number of bridges in the region or State (guidelines for the selection of these bridges are provided). These bridges would need to be load rated in accordance with AASHTO’s Manual of Bridge Evaluation. To estimate the cost impact of the truck traveling over the bridge, if the rating factor is less than 1.0, then the bridge is considered to be inadequate for the truck, and one of five action options could be selected: 1= do nothing, 2 = rehab or retrofit, 3 = post, 4 = combination of 2 and 3, or 5 = replace. The cost of the action then is estimated for that truck on that type of bridge. The same general steps are repeated for the four cost categories with variations in the actual details.
According to the findings of NCHRP Report 495, “The Federal…method is more advantageous at the State level or a local level [for which] cost impact estimation could be conducted in more detail, because more detailed bridge data are available and the number of bridges becomes smaller.” Conversely stated, the disadvantage of this method is that the level of detail and data needed to analyze bridges at the national scale would be time and cost prohibitive. In addition, the methodology outlined in the Report provides bridge selection guidelines that may end up excluding bridges when there is a large population of bridges in the study area as is the case with this Study.
The method allows one to prescribe a course of action that has a certain cost to perform, but it does not provide for a measure of the actual level of damage. The effective use of this method requires a familiarity with each State’s repair philosophies and practices. For instance, does the State lean towards repair and preservation or does it favor proactive replacement of deficient structures? With respect to the term “practice,” the threshold that visible condition level triggers a finding of failure by different owners is being referenced. Report 495 did introduce a “probabilistic approach,” a formulaic expression (NCHRP 495, Equations 3.4.2.7 and 3.3.3.1) to deal with the uncertainty with respect to reported physical test results and practice (NCHRP Report 495, pages 46 & 51, Section 3.4.3). However, the sheer scope of work relative to its application to large numbers of specific, real bridges is at this time untenable for use in this study.
With respect to the fatigue methods described in this document, the document itself addresses its own limitations in that “... due to uncertainty observed in reported physical test results and practice in determining end of service life…the real service life of the deck is not certain.” The report recognizes the lack of available data in a consistent format that is sufficient to implement the method in a large, multi-state region or national study.
Washington, DC DDOT, 2010 District Wide Truck Safety Enforcement Plan: Task 3 - Infrastructure Impacts of Overweight Trucks
The bridge cost allocation portion of this study was based on a model that used a bridge deterioration mechanism prevalent in the Northern Region or the “Rust Belt” of the United States, where States use chlorides in de-icing roadways and bridges. In this region, chloride intrusion plays a major role in general bridge deterioration and specifically in bridge deck deterioration. The study employed ESAL/LEFs as its allocator for estimating damage and assigning cost.
The NBI database was used to obtain most of the bridge data, minus the structural details. The next step was to determine the traffic stream and volume (mix and number of vehicles – truck class specific). The District provided raw WIM data from three WIM stations in the District and law enforcement citations on non-compliant trucks, but this did not provide enough breadth of data to reach any meaningful conclusions. The research team used WIM data in the form of axle load weight increments and counts for each vehicle class. District axle load charts were used to determine which sets of axle weight increments would be considered compliant or non-compliant. Accordingly, a relative damage distribution profile was determined (by percent) of legal and over-weight trucks by vehicle class (TMG Vehicle Classes 4 through 13).
An analysis of annualized capital costs was conducted for the bridges included in the study. Based on the District’s truck routing map, bridge structures that were not on the truck routes and thus would not be impacted were excluded, as were parkway bridges and tunnels. A detailed, annualized cost estimate was developed for the remaining 139 bridges.
The final step was to apply the truck distribution profile of the 10 truck vehicle classifications to the bridge costs, providing a clear picture of the impact of trucks (both compliant and non-compliant) on the District’s bridges.
The advantages of this type of study are self-evident based on the results obtained. However, the following speaks to two primary weaknesses in that study and mitigations that have been introduced in this present study: the methodology used the ESAL/LEF allocator to assign cost responsibility, and, as stated above, this approach is somewhat flawed as it ties damage to an arbitrary standard axle load and to a powered exponent that was not well understood.
Comparison of Impacts from Vehicles that Operate Within and Above Size and Weight Limits
While comparing the impacts of trucks with a GVW at or below current Federal limit of 80,000 pounds with trucks that operate above those limits, it is important to consider that GVW is not the sole, key consideration in conducting such a comparison. One study evaluated in the desk scan observed that traffic induced flexural stress does not necessarily increase with GVW but is highly related to axle weights and configurations. Another study noted that shorter spans show little correlation between GVW and moment effect. The study goes on to point out that the correlation improves as the span length increases. For example, the study found that when comparing truck induced moment on spans shorter than 60 feet, there is very little difference in the moments induced by 5-axle and 11-axle trucks. However, the study goes on to point out that for spans greater than 60 feet, as the span length increases the moments induced by 11-axle trucks are significantly higher than those induced by 5-axle trucks.
Axle weight is a key factor used in calculating stress cycles and estimating bridge deck wear, and GVW must be combined with the number of axles that the configuration being evaluated has as well as the spacing between the axles when conducting structural analysis, as was done in this part of the Study.
In completing the structural analysis performed in this bridge structure comparative study, the AASHTOWare Bridge Rating® (ABrR) program was used to analyze the 490 bridges for the base case (GVW ≤ 80,000 lb.) and for the proposed alternative truck configurations in the six scenarios (alternative scenario, GVW >80,000 lb.). The USDOT study team calculated estimates of the cost to strengthen or replace certain bridges unable to accommodate the heavier truck configurations evaluated, and these are presented in this Report.
In completing the fatigue analysis, the results of this comparative analysis indicate that relatively higher axle loads and/or closely spaced axles negatively impact fatigue life when compared to the two 80,000 control vehicles. The number of stress cycles in a structure is proportional to the number of trucks that cross the bridge during its service life. The study team performed fatigue life evaluations based on the assumptions that each truck loading cycle causes some damage. The damage caused by each truck depends on the weight, the bridge’s span length, and member section properties. In this area of the study, the study team investigated the effect of trucks that exceed Federal weight limits) on bridge decks. One approach was to look at States that allowed heavier trucks in comparison to States that do not allow heavier than Federal legal limit trucks. Efforts in this area of the Study were not productive due to the reasons stated above—e.g., variations in States’ approaches, allocators used, etc.—and because all States do issue overweight permits for loads heavier than the legal maximum. Furthermore, bridge deck thickness, girder or floor-beam spacing, and other general characteristics differ from one bridge deck to another.
[1] Gross vehicle weight and axle loads are expressed in units of 1000 lbs., or “kips”. Return to Footnote 1