Jason's Law Truck Parking Survey Results and Comparative Analysis
III. Survey of State Capability to Provide Adequate Truck Parking
Introduction and Approach
This section describes the survey which evaluated the capability of States to provide adequate parking and rest facilities for commercial motor vehicles engaged in interstate transportation. To evaluate the capability of the State to provide adequate parking, FHWA worked with stakeholders to develop a survey instrument to report on truck parking in each State. These surveys were supplemented by information provided from industry members and organizations, including truck drivers and representatives of trucking firms, travel plaza and truck stop owners and operators, and commercial motor vehicle safety contacts in each State. FHWA collected information via questionnaires designed for the States as well as for the specific stakeholder groups. The results provide insight into the issues associated with commercial vehicle parking including shortages in particular geographic regions that inform recommendations for future research.
For this report, the “capability of [each] State to provide adequate parking”7 is an assessment of parking conditions and issues as reported by each State DOT and State motor carrier safety representative and supplemented by the stakeholder community. In other words, capability is defined as the level of parking supply in relation to key indicators of demand.
Key indicators used in this report include reports of problems, lack of capacity (shortages), illegal parking, number of spaces in relation to vehicle miles traveled (VMT), National Highway System (NHS) miles and Gross Domestic Product (GDP) as reported by the State DOT, State motor carrier safety officials, and supplemental reports from other stakeholders regarding the ability of a driver to access adequate long-term parking facilities within the geographic boundaries of a State. VMT is as reported by States in the 2012 HPMS maintained by FHWA. NHS mileage is also provided by FHWA. The GDP is provided by the U.S. Bureau of Economic Analysis (BEA) for 2012 Real GDP by State.8
Adequacy in Each State: The adequacy of truck parking is based on parking locations, spaces, and challenges as reported by each State DOT and supplemented by other stakeholder reporting. While the studies and analyses on the truck parking problem all point to a growing need for parking, safer parking and better information on parking, the concept of “parking adequacy” is defined differently among the stakeholders involved in either using or supplying parking spaces. From the perspective of the private sector, “adequate parking” is often viewed as sufficient to support business needs such as attracting paying customers to purchase goods and services. From the perspective of the State DOT, “adequate parking” can be defined in relation to the agency mission of providing locations for travelers, including commercial truck drivers, to obtain short-term and not long-term rest. From the perspective of the commercial vehicle safety and law enforcement, “adequate parking” may be viewed as sufficient space to inspect for safety compliance or to weigh vehicles for enforcement purposes. From the perspective of the truck driver, “adequate parking” can be viewed as sufficient to park for long-term rest and perhaps to access goods and services such as hot meals, showers, and to remain rested and refreshed during days or weeks of overnight travel.
Capability of the State to Provide Adequate Parking: Each State DOT reported on its capability to provide adequate parking. Stakeholder reporting supplemented this information with regard to the ability of a driver to access long-term parking facilities within the geographic boundaries of a State. The capability to provide parking is related to a number of factors including agency priorities and budgets, marketing strategies and revenues, land availability and costs, and infrastructure availability, which are reflected in the State DOT responses to the survey informing this report.
Stakeholder Outreach
Evaluating the capability of States to provide parking and rest facilities serving commercial vehicles requires consultation with each State DOT, the truck drivers and dispatchers who use these facilities, private truck stop operators who provide spaces for long-term truck parking, and the motor carrier safety enforcement officials who routinely observe truck parking overcrowding at designated public and private parking lots as well as at unofficial locations such as freeway shoulders, ramps, and interchanges. In order to survey these stakeholders, FHWA partnered with the organizations presented in Table 1 to assist in designing and delivering the survey. These organizations are viewed as the principal representatives of the stakeholder groups necessary to assist in this report.
| Data Source Type | Target Survey Group | Supporting Organization | Acronym |
|---|---|---|---|
| Primary | State DOT Personnel | American Association of State Highway and Transportation Officials | AASHTO |
| State and Federal Motor Carrier Safety Officials | Commercial Vehicle Safety Alliance | CVSA | |
| Supporting | Travel Plaza and Truck Stop Owners and Operators | National Association of Truck Stop Operators | NATSO |
| Trucking Industry Firm Management and Logistics Personnel | American Trucking Associations | ATA | |
| Trucking Industry Drivers | American Trucking Associations | ATA | |
| Independent Truck Drivers | Owner Operator Independent Drivers Association | OOIDA |
The FHWA surveyed State DOT personnel and State and Federal motor carrier safety enforcement officials with assistance from AASHTO and CSVA, respectively. Travel plaza and truck stop owners and operators, trucking industry firm management and logistics personnel, and truck drivers (both owner/operator and those that are employed by a trucking firm) were surveyed with assistance from NATSO, ATA, and OOIDA.
Survey Design
Representatives from the supporting organizations served on a Stakeholder Technical Work Group (STWG) that provided input into the survey design to affirm the relevancy of the questions to their respective members. In the initial discussions, the STWG and FHWA considered relevant ways to evaluate State capability to provide adequate parking and what types of information States and other stakeholders had available. The surveys maximize the receipt of as much information that would be potentially available and to identify the gaps in data and analysis that could inform future research. A total of six survey instruments were developed in consultation with the STWG that were completed by each group of stakeholders.
Surveys asked respondents to provide information regarding the characteristics of commercial vehicle parking supply and demand and to describe commercial vehicle parking problems such as overcrowding and the presence of unofficial parking locations. Table 2 summarizes the general content of each survey. Appendix B contains copies of these surveys.
| Survey | Target Survey Group | General Survey Content |
|---|---|---|
| AASHTO/State department of dransportation | State DOT Personnel | Number of commercial truck parking and rest facilities in State; description of truck parking problem in State; comments regarding problems identified and prior studies of truck problem in the State. |
| CVSA /State Motor Carrier Safety Officials | State and Federal Motor Carrier Safety Enforcement Officials | Number and location of unofficial truck parking locations; characteristics of parking demand at unofficial parking locations including hourly, weekly, and monthly variation. |
| NATSO/Private Sector Truck Parking Facility | Travel Plaza and Truck Stop Owners and Operators | Characteristics of truck parking facilities including the number of parking spaces and hourly, weekly, and monthly demand. |
| Trucking Industry Professionals - ATA | Trucking Industry Professionals | Driver experience with finding rest location and opinions regarding regions and States currently experiencing shortages or surpluses of parking spaces. |
| Interstate Truck Driver - ATA | Trucking Industry Drivers | Driver experience with finding rest location and opinions regarding regions and States currently experiencing shortages or surpluses of parking spaces |
| Interstate Truck Driver - OOIDA | Independent Truck Drivers | Driver experience with finding rest location and opinions regarding regions and States currently experiencing shortages or surpluses of parking spaces |
| AASHTO = American Association of State Highway and Transportation Officials • ATA = American Trucking Associations • CVSA = Commercial Vehicle Safety Alliance • NATSO = National Association of Truck Stop Operators • OOIDA = Owner Operator Independent Drivers Association | ||
While every attempt was made to solicit as much information as possible from the primary and supporting stakeholders to inform this report, the following limitations affected this analysis:
- States have a high degree of variance in information available to inform the survey for this report. Some States have robust programs to monitor truck parking issues while others have limited information. States with in-depth programs or that have conducted truck parking analyses submitted copies of their work and related documents in addition to this survey. Many States that did not have information to inform the survey remarked throughout that survey that information was not available or regularly collected. This report relies on as much information as could be derived from information States currently had available such as any already completed analyses or projects.
- State commercial vehicle safety personnel information is also highly variable. There are differences in the methods and in the priority levels States applied for monitoring, enforcing, and capturing information on illegal truck parking. Some States have robust programs to monitor and quantify illegal parking. States such as Maryland submitted reports with every location of illegal parking enforcement identified. Other States submitted more qualitative information and cite lower levels of problems with truck parking while focusing resources other important safety issues. For the purpose of this report, FHWA attempted to compare the State motor carrier safety officials’ information and draw conclusions about enforcement activities despite varying levels of data. More research is necessary beyond this report to capture the breadth of motor carrier safety activities in each State.
- This report relies on input from drivers and trucking firm management and logistics personnel that make up membership for both ATA and OOIDA. While similar in many ways, perceptions and understanding of problem locations and issues are naturally those of the area where they operate or are located. For the purpose of this survey, FHWA did not collect any demographic information about the respondents for ATA and OOIDA. No information is known for the respondents on their location, class of truck, driving distances, origins and destinations, or other identifying information. Future research may consider evaluating truck parking in relation to different types of drivers, industries, commodities carried, or other factors and to balance the locations and operating regions of drivers.
- No demographic information is collected for the NATSO respondents. The NATSO input is primarily related to characteristics and operations among private facilities and is less location specific.
While there are limitations to the data collected and how it informs this report, the data is valuable in understanding the current and varying perspectives of the States on evaluating adequate parking and identifying the stakeholders involved in the truck parking issue. It is important, however, to consider that the data available on truck parking activities is highly inconsistent and often subjective. More research and development of data is needed to improve analysis of truck parking issues. For example, more detailed data characterizing parking demand would provide valuable insights into understanding how parking needs are manifested at particular times and locations. Commercial vehicle parking demand is a reflection of a complex set of transportation, economic, and regulatory factors that result in a need for a driver to park at a specific place or time and for a certain duration. Data to support the development of predictive demand models would aid in understanding how and where parking needs are generated to better plan and manage parking supply. However, this research lays a foundation for future analyses as reflected in the metrics section of this report. Suggestions for the development of truck parking analyses are provided in the conclusion of this report.
Survey Outreach and Delivery
The goal of the survey effort for State DOT representatives and State motor carrier safety officials was to achieve a 100 percent response rate. These results were the primary sources of data. There were no specific return rate goals for the remaining surveys administered to travel plaza and truck stop owners and operators, trucking industry professionals, trucking industry drivers, and independent truck drivers. Rather, the data gathered from these sources were used to supplement and validate the information provided from the primary sources.
The survey was made available as an online survey to maximize ease of access and broaden its reach. To announce the availability of the survey, the representatives from the STWG notified their organizational membership that the survey was active and requested their participation. In addition, prior to the start of the survey, FHWA sent a notification to all 52 FHWA Division Offices. The recipients of this notice included the Freight Council representatives in each Division Office who specialize in freight issues and coordinate with State DOT freight/truck-related staff. Division staff were charged with outreach to State DOTs and State commercial vehicle safety personnel as needed throughout the survey effort and to ensure participation of the States.
To administer the survey, the FHWA study team sent an initial email to representatives from the organizations for each stakeholder group (AASHTO, CVSA, NATSO, ATA, and OOIDA) that they then sent to their members (State DOT personnel, State motor carrier safety enforcement officials, travel plaza and truck stop owners and operators, trucking industry firm management and logistics personnel, and truck drivers, and owner/operator truck drivers). The email contained the following:
- Request for help
- Purpose of the survey
- Link to the online survey
- Explanation of the intended use of the data
- Confidentiality conditions
The data gathering primarily occurred for a 30-day time period during the month of April 2014. The FHWA followed up as required to answer questions from survey respondents and to offer alternative means to complete the survey on paper or by e-mail. Survey results were compiled electronically, and a database was developed containing the results. A supplemental survey of State DOTs was conducted in August 2014 through the FHWA Division Offices to obtain clarification and additional information regarding the number of spaces and utilization, as well as maintenance and plans, in order to provide the most robust results to inform this report.
Though not part of the formal surveys described in this section, information from the process of developing the system of metrics for this report are described below to provide context and illuminate the perspectives of the stakeholders. This information is included below as a precursor to the results for each stakeholder group in this section because it represents the key thoughts and perceptions that are important for understanding the context of the survey responses. While the formal surveys did offer the opportunity for comments, the STWG information derived during the metrics development process are key points each stakeholder organization felt important to express throughout the development of this report.
Perspectives from State Departments of Transportation and the American Association of State Highway and Transportation Officials
The State DOT representatives indicated that their obligations to their constituents (primarily counties and municipalities) and the public entail understanding the quantity and nature of truck traffic in their jurisdictions. They stated their desire to provide good information about parking capacity and availability to drivers, especially to those from outside the area. When solicited for information on the interests, needs, and challenges of their constituents, representatives provided responses for the following key themes:
Where Truck Parking can be Developed
- There is an issue with the supply and demand of land for truck rest stops. Land use issues affect the ability to provide adequate facilities as the highest demand for land to create truck parking is within 20 miles of urban areas. This tends to be where the development patterns are denser and where land is less available and more expensive.
- There are challenges in identifying parcels for parking, especially near major retail areas, which are heavily mixed with residential land uses. Often this results in “Not in My Backyard” (NIMBY) reactions from the community. Understanding needs for parking and the contrast with local land uses is important.
- Building support for new or expanded facilities from municipalities was also mentioned as a challenge. Suburban towns have a negative perception of truck stops, and in urban areas an issue such as property tax rates often makes a truck stop less attractive than other land uses.
Understanding Freight Flows and Accommodations Required (What is Needed and Where)?
- Seasonal impacts of freight movement such as holiday seasons with increased truck activity create higher demand for parking during those months. States have challenges quantifying and identifying the need for parking during these times and justifying parking during the remainder of the year. Additionally, it is during this time that the greatest number of illegal parking instances occur as there is no place for overflow parking.
- Respondents noted how data can be processed to help develop an understanding that reflects real world knowledge that frames and quantifies the issue. Identifying and building better data sources was flagged as important for future measurement.
- There is a need to better understand the requirements to provide good access to oversize and overweight vehicles. Facilities are usually designed for standard truck sizes, but oversize vehicles have special needs that require accommodations for turning and ease of access.
Defining an Appropriate Champion for Truck Parking Needs
There have been challenges reported on the collaboration between public stakeholders and private partners such as State trucking associations to discuss and jointly understand truck parking needs in the States and regions. Representatives reported challenges and needs in getting State police to participate on project advisory committees and in providing good data that frames the issue, such as numbers of trucks parked on highway shoulders and ramps. The interaction between DOTs and law enforcement is critical to the success of measuring the problem. A consensus should be reached about which public sector agency should champion the truck parking problem in States and regions. Is it a department of safety, a motor trucking regulatory office, a state office of freight mobility, or another department? Ownership would improve the consistent coordination of measures, especially incorporation into the State’s regular performance measurement program.
Commercial Vehicle Enforcement and Safety Officials
The various highway safety and law enforcement representatives from States participating in the STWG indicated that the most critical interests of their members (i.e. law enforcement and State commercial vehicle personnel) include: addressing the problem of trucks parked on highway shoulders due to the safety risk to passing motorists; outreach to the public, stakeholder groups, and policy makers about truck parking issues and their safety implications; and understanding the relationship between driver fatigue and truck crashes. When solicited for information on the interests, needs, and challenges of their constituent groups, the safety representatives provided the following information:
Improving Safety and Security
- Trucks parked in unofficial and illegal locations present highway safety challenges because of the mix with other vehicles
- The law enforcement/highway safety community is very interested in the relationship between driver fatigue management and truck parking adequacy.
- Security issues are present when trucks are parked longer than they are allowed. They could be targets for crimes such as theft.
Changing Public Perception on Truck Parking
- Tying the need for parking spaces to highway safety is an important strategy when it comes to getting the public to understand the importance of truck parking.
- Helping the public see the connection between freight transportation and the products they use in their daily lives is another important element of the outreach process.
- Public acceptance of the solutions is critical to eliminating opposition to siting and expanding facilities and to raising awareness about the challenge of illegal or unofficial truck parking practices.
Building Parking that Meets the Needs of a Diverse Industry
- A diversity of truck parking locations is needed by the industry. Measuring parking capacity by certain geographic scales (by State or region, for example) may not make as much sense as measuring it by highway corridor or based on proximity to industrial sites.
- Commercialization of rest areas is a sensitive subject but should be part of the conversation; “commercialization” and “privatization” are not the same, and there may be opportunities to leverage public-private partnerships in developing new parking capacity.
Trucking Industry
The two major industry groups represented on the STWG, the ATA and OOIDA, indicated that the most pressing issues facing their constituents in terms of truck parking adequacy include: ongoing education about FMCSA HOS rules, including newly implemented but currently suspended changes in the 34-hour restart requirement; self-policing of the industry to deal with persistent violators who give the industry a bad name; and managing the gradual change from paper logs to electronic logs across the industry. The trucking industry representatives provided the following information:
Defining Adequate Parking – What is it?
- It is difficult to measure parking adequacy from the standpoint of the trucking industry. The information available to the industry tends to be anecdotal and is not documented consistently.
- Drivers do not have a sense of parking for the routes other than those they travel or the area in which they operate. Their understanding of adequacy is relative to where they are operating. Drivers try and stay with what they know and what helps them get to their destination as fast and efficiently as possible. Better decisionmaking tools on parking availability might help to improve their understanding of route and time alternatives to better make use of available parking or plan around shortages.
- There is a growing disconnect between where truck parking is available and where it is needed. Over large geographic areas there may be sufficient spaces available to meet the demand at any given time, but available parking is increasingly scarce in many metropolitan areas.
Communication Improvements to Alert Drivers of Parking
- Problems usually occur when drivers operate outside of familiar areas and do not know what is available in public and private parking facilities.
- The predictability of available spaces is a key need for the trucking industry.
Driver Parking Preferences
- Drivers are most concerned about maximizing the driving hours and distance they can fit into their hours of service.
- Drivers would prefer to wake up at a full-service truck stop than a parking facility with no amenities.
- At a parking facility, a driver’s top priorities are that it is safe, secure and conducive to sleep.
- For many drivers, options for different places to park along a route are at least as important as amenities at any given location.
- Internal truck circulation is a problem in some older facilities that are not designed for larger trucks. Drivers avoid places where their trucks cannot traverse the facility or may be blocked by other vehicles.
Differences among Drivers and Their Needs
- The industry representatives do not believe there is a drastic difference in needs among drivers for different industries.
- Parking needs for longer term truck staging is often overlooked by policy makers and other industry groups. There may be alternatives to traditional truck stops and public rest areas for this particular parking need.
Perceptions of Regulations and Enforcement
- Required 30-minute breaks under the new FMCSA HOS rules are having unintended impacts. Some drivers are pulling into fueling islands at crowded truck stops and “slow-fueling” to meet the 30-minute requirement, which causes problems for other drivers.
- The use of rest areas for inspections in some States adds a layer of uncertainty for the availability of truck spaces because drivers are hesitant to park at these locations and they typically do not have amenities.
- The process for inspecting and permitting oversized loads often cuts into the distance a driver can cover under HOS limits.
Truck Stop Operators
The NATSO representatives indicated that some of the important interests of their constituents include adequate security for drivers; fixing a common public image issue by which people associate truck stops with crime, drug trafficking, and prostitution; and educating public officials about the role of truck stops in freight transportation and the economic importance of truck stops as commercial establishments. When solicited for information on the interests, needs, and challenges faced by their constituents, representatives provided the following information:
Development of Private Truck Stops is Market/Customer Driven
- Truck stops are customer oriented. If there is an opportunity to provide a service to the trucking industry and the traveling public, there will be someone to provide it.
- Fuel costs are a major factor for the trucking industry, so profit margins are thin for private truck stops due to the competition among fuel retailers.
Challenges in Developing Truck Stops
- The industry often deals with conflicting public policies and messages. The Federal government recognizes and emphasizes the importance of adequate truck stops, but these facilities are typically opposed by local governments. This creates difficulty in developing new or expanded facilities.
- Many municipal governments want to keep trucks outside their borders, even out of private facilities. Truck route restrictions have an impact on the success of off-highway truck stops.
Challenges in Determining and Identifying the Need for Parking and Locations
- There is often a disconnect between perceived need and actual need for truck parking. Parking on a shoulder or ramp does not always correlate to a truck parking shortage.
- In almost any geographic area there are typically more open parking spaces at a private truck stop than the total number of public spaces at a nearby rest area on a highway.
- There is a significant cost to construct new private facilities, and there must be an adequate return on the investment to offset initial land acquisition and capital costs as well as recurring costs such as operations and maintenance. Permitting for new and expanded facilities can be expensive and time consuming.
- Shippers have no mechanism to monetize their investment of additional parking facilities on site, particularly when it comes to addressing the costs of security, additional liability insurance, and maintenance of paved parking areas. This is why the burden of providing truck parking facilities falls on the truck stop industry and on public highway authorities.
- Discussions of truck parking adequacy rarely include considerations of driver amenities.
Improving Communications to Truckers on Parking
- The industry is becoming increasingly adept at using technology and developing apps for truckers to use to identify the availability of open parking spaces and even to make reservations at some facilities.
Response Rate of Stakeholders
Table 3 summarizes the survey responses received from each stakeholder group. Responses were received from all 50 States in surveys targeted at State DOT personnel. A total of 50 responses were received in the case of the State motor carrier safety officials. FHWA gathered survey data for a total of 391 trucks stops and received 249 responses from trucking firm management and logistics personnel, 820 from fleet drivers, and 7,333 from independent truck drivers. The following sections summarize the results of the surveys for each stakeholder group. Note that Hawaii does not have public or private truck parking facilities.
| Survey | Target Survey Group | Number of Responses |
|---|---|---|
| AASHTO/State DOT | State DOT Personnel | 50 States |
| CVSA/State Motor Carrier Safety Officials | State and Federal Motor Carrier Safety Enforcement Officials | 50 States |
| NATSO/Private Sector Truck Parking Facility | Travel Plaza and Truck Stop Owners and Operators | 391 Truck Stops |
| Trucking Industry Firm Management and Logistics personnel - ATA | Trucking Industry Professionals | 249 Dispatchers |
| Interstate Truck Driver - ATA | Trucking Industry Drivers | 820 Drivers |
| Interstate Truck Driver - OOIDA | Independent Truck Drivers | 7,333 Drivers |
| AASHTO = American Association of State Highway and Transportation Officials • ATA = American Trucking Associations • CVSA = Commercial Vehicle Safety Alliance • NATSO = National Association of Truck Stop Operators • OOIDA = Owner Operator Independent Drivers Association | ||
Results – Survey Results by Stakeholder Group
The survey results are presented by first providing the results from State DOT and State motor carrier safety official responses followed by the results from the supporting stakeholder groups. An analysis of the survey results and stakeholder perspectives follows the results section to identify regional clusters, corridors, and trends that emerge through the results. This information informs the recommended research in the conclusion. As required by Jason’s Law, this report includes an assessment of State capability to provide adequate parking. Table 4 and Table 5 provide the results of each State’s assessment of the key indicators including facilities, spaces, ratio to VMT, NHS and GDP, and stakeholder group assessment. Table 6, Table 7, and Table 8 indicate the upper and lower quartile results for the key indicators, which help identify the highest and lowest States for each indicator and better illustrate the results of the data analysis. The contents of these tables, along with general and regional observations, are reflected in the results for each stakeholder group below.
State Department of Transportation Results
The FHWA study team surveyed States to obtain information on the number of public facilities, public spaces and information on problems and locations of problems. The FHWA was able to collect detailed information from most States on the locations, number of spaces, hours of operation, and maximum hours trucks may park at these facilities. States were also surveyed to determine if the State DOT has analyzed the truck parking needs and availability, and if so, if it was done in light of just-in-time delivery demands, HOS requirements, and patterns of highway movements; whether they have taken action to increase either public or private parking; if the State is working with trucking companies and or private truck stop operators to increase truck parking; any planned increases or decreases in parking; utilization by time of day, day, and month; additional maintenance costs related to truck parking at public rest areas; and to provide any comments or other information. States provided very little response to questions beyond number of spaces, facilities, and hours of operation. While most States could provide anecdotal information on shortages, few data were provided on actual utilization, maintenance costs, and future plans.
Of the States providing utilization information on public rest areas, 26 percent provided an indication such as whether the public rest area was used more heavily at certain times. Eighteen percent provided hourly utilization information on the highest levels of parking. Twenty percent indicated the weekday with the highest utilization, and eighteen percent indicated the months of highest parking utilization. Twenty-eight percent of States indicated the number of planned spaces or need for more spaces, and 18 percent indicated the additional maintenance costs of public rest areas due to truck parking.
| State | Number of Public Facilities | Public Truck Spaces | Number Private Truck Stops | Private Truck Spaces | Ratio of Private to Public Spaces | Total Spaces | Public Spaces per 100K Daily Truck VMT | Private Spaces per 100K Daily Truck VMT | All Spaces per 100K Daily Truck VMT | Public Spaces per 100 miles of NHS | Private Spaces per 100 Miles of NHS | All Spaces per 100 Miles of NHS |
|---|---|---|---|---|---|---|---|---|---|---|---|---|
| Alabama | 26 | 633 | 201 | 7,456 | 11.8 | 8,089 | 9.2 | 108.5 | 117.7 | 14.1 | 165.9 | 180.0 |
| Alaska | - | - | 18 | 179 | - | 179 | - | 86.1 | 86.1 | - | 6.6 | 6.6 |
| Arizona | 18 | 495 | 73 | 6,635 | 13.4 | 7,130 | 9.4 | 125.9 | 135.3 | 12.0 | 161.1 | 173.1 |
| Arkansas | 16 | 194 | 143 | 6,277 | 32.4 | 6,471 | 3.0 | 98.0 | 101.1 | 4.9 | 158.4 | 163.2 |
| California | 87 | 1,252 | 197 | 11,892 | 9.5 | 13,144 | 5.1 | 48.6 | 53.7 | 8.6 | 82.0 | 90.6 |
| Colorado | 18 | 842 | 89 | 3,645 | 4.3 | 4,487 | 19.9 | 86.3 | 106.2 | 16.8 | 72.8 | 89.7 |
| Connecticut | 20 | 521 | 16 | 1,015 | 1.9 | 1,536 | 20.4 | 39.8 | 60.2 | 35.5 | 69.2 | 104.8 |
| Delaware | 1 | 28 | 15 | 294 | 10.5 | 322 | 4.9 | 51.3 | 56.1 | 6.1 | 64.5 | 70.6 |
| Florida | 77 | 2,529 | 160 | 6,573 | 2.6 | 9,102 | 19.8 | 51.5 | 71.2 | 29.0 | 75.3 | 104.3 |
| Georgia | 47 | 1,701 | 265 | 12,017 | 7.1 | 13,718 | 15.2 | 107.1 | 122.3 | 24.4 | 172.6 | 197.0 |
| Hawaii | - | - | - | - | - | - | - | - | - | - | ||
| Idaho | 13 | 274 | 60 | 2,809 | 10.3 | 3,083 | 12.3 | 126.3 | 138.6 | 9.5 | 97.4 | 106.9 |
| Illinois | 90 | 1,622 | 206 | 9,640 | 5.9 | 11,262 | 11.1 | 65.9 | 76.9 | 20.3 | 120.8 | 141.1 |
| Indiana | 40 | 2,070 | 186 | 11,810 | 5.7 | 13,880 | 20.3 | 116.0 | 136.3 | 43.1 | 245.9 | 289.0 |
| Iowa | 39 | 681 | 163 | 6,499 | 9.5 | 7,180 | 11.0 | 104.9 | 115.8 | 13.1 | 125.0 | 138.1 |
| Kansas | 36 | 328 | 125 | 4,516 | 13.8 | 4,844 | 5.8 | 80.0 | 85.8 | 6.7 | 92.4 | 99.1 |
| Kentucky | 37 | 1,214 | 122 | 6,734 | 5.5 | 7,948 | 14.2 | 79.0 | 93.2 | 35.2 | 195.0 | 230.2 |
| Louisiana | 21 | 329 | 254 | 11,782 | 35.8 | 12,111 | 4.1 | 147.6 | 151.7 | 9.8 | 349.4 | 359.2 |
| Maine | 14 | 282 | 32 | 758 | 2.7 | 1,040 | 21.7 | 58.4 | 80.2 | 20.3 | 54.5 | 74.8 |
| Maryland | 20 | 492 | 49 | 2,544 | 5.2 | 3,036 | 11.7 | 60.5 | 72.2 | 20.9 | 108.1 | 129.0 |
| Massachusetts | 19 | 192 | 43 | 1,220 | 6.4 | 1,412 | 18.3 | 116.4 | 134.7 | 7.3 | 46.2 | 53.5 |
| Michigan | 78 | 1,618 | 242 | 5,774 | 3.6 | 7,392 | 20.8 | 74.4 | 95.2 | 24.3 | 86.7 | 111.0 |
| Minnesota | 50 | 625 | 147 | 3,641 | 5.8 | 4,266 | 17.1 | 99.8 | 116.9 | 10.9 | 63.7 | 74.6 |
| Mississippi | 64 | 716 | 160 | 5,424 | 7.6 | 6,140 | 12.3 | 93.5 | 105.9 | 19.8 | 149.8 | 169.5 |
| Missouri | 44 | 1,109 | 188 | 9,609 | 8.7 | 10,718 | 17.2 | 149.2 | 166.4 | 18.3 | 158.3 | 176.5 |
| Montana | 68 | 601 | 65 | 2,967 | 4.9 | 3,568 | 28.9 | 142.5 | 171.4 | 13.8 | 67.9 | 81.7 |
| Nebraska | 21 | 330 | 94 | 4,432 | 13.4 | 4,762 | 8.0 | 107.8 | 115.8 | 8.7 | 116.5 | 125.2 |
| Nevada | 17 | 225 | 47 | 3,746 | 16.6 | 3,971 | 8.9 | 148.4 | 157.4 | 8.5 | 142.1 | 150.6 |
| New Hampshire | 12 | 188 | 28 | 423 | 2.3 | 611 | 40.0 | 90.0 | 130.1 | 19.4 | 43.7 | 63.2 |
| New Jersey | 15 | 757 | 112 | 2,213 | 2.9 | 2,970 | 21.6 | 63.1 | 84.7 | 26.2 | 76.6 | 102.8 |
| New Mexico | 32 | 358 | 76 | 5,458 | 15.2 | 5,816 | 7.1 | 108.2 | 115.3 | 10.2 | 155.4 | 165.6 |
| New York | 36 | 632 | 153 | 4,751 | 7.5 | 5,383 | 9.8 | 73.4 | 83.2 | 8.1 | 60.8 | 68.9 |
| North Carolina | 53 | 723 | 206 | 5,122 | 7.1 | 5,845 | 10.0 | 70.5 | 80.5 | 11.6 | 81.9 | 93.4 |
| North Dakota | 20 | 177 | 58 | 2,681 | 15.1 | 2,858 | 6.4 | 96.6 | 102.9 | 4.6 | 69.5 | 74.0 |
| Ohio | 98 | 2,327 | 219 | 11,968 | 5.1 | 14,295 | 12.7 | 65.2 | 77.8 | 35.0 | 179.9 | 214.9 |
| Oklahoma | 9 | 184 | 174 | 7,343 | 39.9 | 7,527 | 2.6 | 104.4 | 107.0 | 4.1 | 164.6 | 168.7 |
| Oregon | 40 | 550 | 55 | 3,971 | 7.2 | 4,521 | 9.9 | 71.4 | 81.3 | 12.2 | 88.4 | 100.7 |
| Pennsylvania | 66 | 1,569 | 223 | 9,363 | 6.0 | 10,932 | 16.3 | 97.5 | 113.8 | 21.8 | 130.3 | 152.1 |
| Rhode Island | 3 | 26 | 5 | 200 | 7.7 | 226 | 3.6 | 27.8 | 31.4 | 4.4 | 34.1 | 38.5 |
| South Carolina | 39 | 842 | 179 | 7,106 | 8.4 | 7,948 | 13.9 | 117.6 | 131.5 | 22.4 | 189.3 | 211.8 |
| South Dakota | 42 | 405 | 81 | 2,360 | 5.8 | 2,765 | 18.9 | 110.0 | 128.8 | 10.5 | 61.3 | 71.8 |
| Tennessee | 42 | 710 | 152 | 6,969 | 9.8 | 7,679 | 5.0 | 49.2 | 54.2 | 15.0 | 147.5 | 162.6 |
| Texas | 69 | 1,150 | 627 | 26,230 | 22.8 | 27,380 | 3.4 | 77.2 | 80.6 | 6.2 | 141.1 | 147.3 |
| Utah | 49 | 530 | 70 | 3,103 | 5.9 | 3,633 | 10.2 | 59.9 | 70.1 | 18.3 | 107.2 | 125.5 |
| Vermont | 42 | 216 | 24 | 354 | 1.6 | 570 | 49.9 | 81.8 | 131.7 | 27.7 | 45.4 | 73.1 |
| Virginia | 35 | 729 | 148 | 7,463 | 10.2 | 8,192 | 8.5 | 87.0 | 95.5 | 16.3 | 166.7 | 182.9 |
| Washington | 96 | 920 | 57 | 2,676 | 2.9 | 3,596 | 17.5 | 51.0 | 68.5 | 19.9 | 57.8 | 77.6 |
| West Virginia | 30 | 641 | 37 | 1,747 | 2.7 | 2,388 | 29.0 | 78.9 | 107.9 | 31.2 | 85.0 | 116.1 |
| Wisconsin | 33 | 818 | 263 | 6,995 | 8.6 | 7,813 | 9.8 | 84.1 | 94.0 | 12.8 | 109.5 | 122.3 |
| Wyoming | 66 | 867 | 69 | 4,314 | 5.0 | 5,181 | 26.6 | 132.5 | 159.1 | 26.9 | 133.9 | 160.8 |
| Total | 1,908 | 36,222 | 6,376 | 272,698 | N/A | 308,920 | N/A | N/A | N/A | N/A | N/A | N/A |
| NHS = National Highway System • VMT = vehicle miles traveled | ||||||||||||
| State | OOIDA States with Parking Shortages | OOIDA States with Sufficient Supply | Mentions in OOIDA Comments about Parking Problems | ATA Drivers States with Parking Shortages | ATA Professionals States with Parking Shortages | ATA Drivers States with Sufficient Supply | ATA Professionals States with Sufficient Supply | Mentions in ATA Comments of Parking Problems | CVSA Reports of Illegal Parking |
|---|---|---|---|---|---|---|---|---|---|
| Alabama | 26% | 14% | 45 | 29% | 15% | 15% | 15% | 1 | 1 |
| Alaska | 2% | 1% | 1 | 4% | 2% | 1% | 3% | 0 | 2 |
| Arizona | 18% | 14% | 42 | 18% | 17% | 13% | 24% | 7 | 2 |
| Arkansas | 33% | 9% | 99 | 29% | 11% | 8% | 10% | 4 | 7 |
| California | 38% | 4% | 210 | 36% | 42% | 4% | 7% | 23 | 71 |
| Colorado | 22% | 9% | 51 | 23% | 14% | 9% | 14% | 4 | |
| Connecticut | 44% | 2% | 80 | 36% | 27% | 1% | 4% | 6 | |
| Delaware | 37% | 2% | 30 | 29% | 21% | 2% | 3% | 2 | 2 |
| Florida | 35% | 11% | 181 | 32% | 14% | 10% | 9% | 2 | 2 |
| Georgia | 35% | 16% | 90 | 36% | 28% | 15% | 10% | 4 | 2 |
| Hawaii | 1% | 0% | 0 | 3% | 2% | 1% | 3% | 0 | |
| Idaho | 11% | 11% | 15 | 12% | 9% | 8% | 14% | 2 | 26 |
| Illinois | 45% | 11% | 125 | 45% | 32% | 11% | 6% | 7 | 1 |
| Indiana | 38% | 17% | 175 | 38% | 25% | 13% | 9% | 2 | 17 |
| Iowa | 20% | 19% | 44 | 20% | 11% | 15% | 20% | 0 | 2 |
| Kansas | 20% | 14% | 214 | 21% | 9% | 13% | 14% | 1 | 1 |
| Kentucky | 30% | 15% | 66 | 35% | 21% | 17% | 7% | 4 | 3 |
| Louisiana | 28% | 10% | 49 | 26% | 13% | 9% | 9% | 2 | |
| Maine | 22% | 2% | 60 | 20% | 11% | 1% | 6% | 1 | 13 |
| Maryland | 44% | 2% | 105 | 33% | 31% | 2% | 3% | 6 | 294 |
| Massachusetts | 44% | 2% | 70 | 35% | 28% | 2% | 4% | 2 | 1 |
| Michigan | 28% | 6% | 49 | 25% | 14% | 6% | 7% | 1 | 54 |
| Minnesota | 19% | 9% | 21 | 20% | 11% | 6% | 14% | 2 | 2 |
| Mississippi | 23% | 10% | 85 | 25% | 10% | 8% | 9% | 0 | 1 |
| Missouri | 25% | 16% | 48 | 28% | 15% | 13% | 14% | 1 | 1 |
| Montana | 9% | 13% | 18 | 12% | 7% | 10% | 12% | 2 | 4 |
| Nebraska | 17% | 16% | 54 | 20% | 9% | 12% | 20% | 1 | 2 |
| Nevada | 12% | 12% | 13 | 14% | 6% | 9% | 14% | 1 | 60 |
| New Hampshire | 29% | 1% | 22 | 25% | 13% | 1% | 4% | 1 | 1 |
| New Jersey | 52% | 2% | 226 | 45% | 31% | 1% | 0% | 9 | 1 |
| New Mexico | 14% | 13% | 35 | 15% | 10% | 12% | 14% | 2 | 2 |
| New York | 49% | 2% | 200 | 42% | 37% | 1% | 0% | 8 | 3 |
| North Carolina | 30% | 10% | 53 | 31% | 27% | 12% | 11% | 3 | 31 |
| North Dakota | 11% | 9% | 9 | 10% | 4% | 7% | 14% | 1 | 35 |
| Ohio | 35% | 16% | 150 | 32% | 22% | 14% | 9% | 3 | 1 |
| Oklahoma | 21% | 15% | 74 | 20% | 11% | 10% | 12% | 0 | 3 |
| Oregon | 16% | 5% | 45 | 16% | 9% | 5% | 11% | 1 | 4 |
| Pennsylvania | 44% | 7% | 101 | 37% | 38% | 6% | 1% | 8 | 2 |
| Rhode Island | 29% | 1% | 26 | 23% | 15% | 1% | 1% | 2 | 1 |
| South Carolina | 25% | 11% | 27 | 26% | 18% | 11% | 11% | 1 | 80 |
| South Dakota | 9% | 10% | 5 | 11% | 3% | 5% | 12% | 0 | 1 |
| Tennessee | 35% | 14% | 69 | 38% | 24% | 15% | 12% | 4 | 1 |
| Texas | 31% | 24% | 184 | 26% | 22% | 24% | 24% | 8 | 1 |
| Utah | 14% | 11% | 43 | 16% | 7% | 7% | 14% | 2 | 24 |
| Vermont | 24% | 1% | 21 | 20% | 11% | 1% | 5% | 0 | 1 |
| Virginia | 40% | 6% | 153 | 35% | 36% | 5% | 7% | 8 | 1 |
| Washington | 20% | 4% | 139 | 15% | 14% | 4% | 5% | 4 | 9 |
| West Virginia | 31% | 4% | 25 | 31% | 17% | 3% | 5% | 2 | 8 |
| Wisconsin | 19% | 11% | 22 | 19% | 14% | 8% | 12% | 1 | 3 |
| Wyoming | 11% | 19% | 30 | 13% | 9% | 14% | 20% | 2 | 1 |
| Total | N/A | N/A | 3,699 | N/A | N/A | N/A | N/A | 139 | 738 |
| OOIDA = Owner Operator Independent Drivers Association • ATA = American Trucking Associations • CVSA = Commercial Vehicle Safety Alliance | |||||||||
| Quartile | Number of Public Facilities (Active and in production) | Public Truck Spaces | Total Private Truck Stops | Total Private Parking Spaces | Ratio of Public to Private Spaces | TOTAL SPACES |
|---|---|---|---|---|---|---|
| Highest | Ohio | Florida | Texas | Texas | Oklahoma | Texas |
| Washington | Ohio | Georgia | Georgia | Louisiana | Ohio | |
| Illinois | Indiana | Wisconsin | Ohio | Arkansas | Indiana | |
| California | Georgia | Louisiana | California | Texas | Georgia | |
| Michigan | Illinois | Michigan | Indiana | Nevada | California | |
| Florida | Michigan | Pennsylvania | Louisiana | New Mexico | Louisiana | |
| Texas | Pennsylvania | Ohio | Illinois | North Dakota | Illinois | |
| Montana | California | Illinois | Missouri | Kansas | Pennsylvania | |
| Pennsylvania | Kentucky | North Carolina | Pennsylvania | Nebraska | Missouri | |
| Wyoming | Texas | Alabama | Virginia | Arizona | Florida | |
| Mississippi | Missouri | California | Alabama | Alabama | Virginia | |
| North Carolina | Washington | Missouri | Oklahoma | Delaware | Alabama | |
| Minnesota | Wyoming | Indiana | South Carolina | Idaho | South Carolina | |
| Lowest | Arizona | Maine | Oregon | Maryland | Montana | New Jersey |
| Colorado | Idaho | Maryland | South Dakota | Colorado | North Dakota | |
| Nevada | Nevada | Nevada | New Jersey | Michigan | South Dakota | |
| Arkansas | Vermont | Massachusetts | West Virginia | New Jersey | West Virginia | |
| New Jersey | Arkansas | West Virginia | Massachusetts | Washington | Connecticut | |
| Maine | Massachusetts | Maine | Connecticut | West Virginia | Massachusetts | |
| Idaho | New Hampshire | New Hampshire | Maine | Maine | Maine | |
| New Hampshire | Oklahoma | Vermont | New Hampshire | Florida | New Hampshire | |
| Oklahoma | North Dakota | Alaska | Vermont | New Hampshire | Vermont | |
| Rhode Island | Delaware | Connecticut | Delaware | Connecticut | Delaware | |
| Delaware | Rhode Island | Delaware | Rhode Island | Vermont | Rhode Island | |
| Alaska | Alaska | Rhode Island | Alaska | Alaska | Alaska | |
| Hawaii | Hawaii | Hawaii | Hawaii | Hawaii | Hawaii |
| Quartile | Public Spaces per 100K Daily Truck VMT | Private Spaces per 100K Daily Truck VMT | All Spaces per 100 K Daily Truck VMT | Public Spaces per 100 miles of NHS | Private Spaces per 100 Miles of NHS | All Spaces per 100 Miles of NHS | Spaces per Million GDP |
|---|---|---|---|---|---|---|---|
| Highest | Vermont | Missouri | Montana | Indiana | Louisiana | Louisiana | Ohio |
| New Hampshire | Nevada | Missouri | Connecticut | Indiana | Indiana | Virginia | |
| West Virginia | Louisiana | Wyoming | Kentucky | Kentucky | Kentucky | Illinois | |
| Montana | Montana | Nevada | Ohio | South Carolina | Ohio | Tennessee | |
| Wyoming | Wyoming | Louisiana | West Virginia | Ohio | South Carolina | South Carolina | |
| Maine | Idaho | Idaho | Florida | Georgia | Georgia | Nebraska | |
| New Jersey | Arizona | Indiana | Vermont | Virginia | Virginia | Wisconsin | |
| Michigan | South Carolina | Arizona | Wyoming | Alabama | Alabama | Missouri | |
| Connecticut | Massachusetts | Massachusetts | New Jersey | Oklahoma | Missouri | Texas | |
| Indiana | Indiana | Vermont | Georgia | Arizona | Arizona | Florida | |
| Colorado | South Dakota | South Carolina | Michigan | Arkansas | Mississippi | Louisiana | |
| Florida | Alabama | New Hampshire | South Carolina | Missouri | Oklahoma | New York | |
| South Dakota | New Mexico | South Dakota | Pennsylvania | New Mexico | New Mexico | Kentucky | |
| Lowest | New Mexico | Ohio | Maine | California | Montana | Washington | Connecticut |
| North Dakota | New Jersey | Ohio | Nevada | Delaware | Maine | California | |
| Kansas | Maryland | Illinois | New York | Minnesota | Minnesota | West Virginia | |
| California | Utah | Maryland | Kansas | South Dakota | North Dakota | Delaware | |
| Tennessee | Maine | Florida | Delaware | New York | Vermont | New Hampshire | |
| Delaware | Florida | Utah | Texas | Washington | South Dakota | North Carolina | |
| Louisiana | Delaware | Washington | Massachusetts | Maine | Delaware | Maine | |
| Rhode Island | Washington | Connecticut | Arkansas | Massachusetts | New York | Vermont | |
| Texas | Tennessee | Delaware | North Dakota | Vermont | New Hampshire | Massachusetts | |
| Arkansas | California | Tennessee | Rhode Island | New Hampshire | Massachusetts | Alaska | |
| Oklahoma | Connecticut | California | Oklahoma | Rhode Island | Rhode Island | Utah | |
| Alaska | Rhode Island | Rhode Island | Alaska | Alaska | Alaska | Rhode Island | |
| Hawaii | Hawaii | Hawaii | Hawaii | Hawaii | Hawaii | Hawaii | |
| GDP = Gross Domestic Product • NHS = National Highway System • VMT = vehicle miles traveled | |||||||
| OOIDA States with Parking Shortages | OOIDA States with Sufficient Supply | Mentions in OOIDA comments about parking problems | ATA Drivers States with Parking Shortages | ATA Professionals States with Parking Shortages | ATA Drivers States with Sufficient Supply | ATA Professionals States with Sufficient Supply | Mentions in ATA Comments of Parking Problems | ATA Mentions of Parking Issues | CVSA Reports of Illegal Parking |
|---|---|---|---|---|---|---|---|---|---|
| New Jersey | Texas | New Jersey | Illinois | California | Texas | Arizona | California | California | Maryland |
| New York | Iowa | Kansas | New Jersey | Pennsylvania | Kentucky | Texas | New Jersey | New Jersey | South Carolina |
| Illinois | Wyoming | California | New York | New York | Georgia | Iowa | New York | New York | California |
| Connecticut | Indiana | New York | Tennessee | Virginia | Alabama | Nebraska | Pennsylvania | Pennsylvania | Nevada |
| Maryland | Missouri | Texas | Indiana | Illinois | Iowa | Wyoming | Texas | Texas | Michigan |
| Massachusetts | Ohio | Florida | Pennsylvania | Maryland | Tennessee | Alabama | Virginia | Virginia | North Dakota |
| Pennsylvania | Georgia | Indiana | California | New Jersey | Ohio | Colorado | Arizona | Arizona | North Carolina |
| Virginia | Nebraska | Virginia | Connecticut | Georgia | Wyoming | Idaho | Illinois | Illinois | Idaho |
| California | Oklahoma | Ohio | Georgia | Massachusetts | Indiana | Kansas | Connecticut | Connecticut | Utah |
| Indiana | Kentucky | Washington | Virginia | Connecticut | Kansas | Minnesota | Maryland | Maryland | Indiana |
| Delaware | Kansas | Illinois | Massachusetts | North Carolina | Missouri | Missouri | Arkansas | Arkansas | Maine |
| Florida | Alabama | Maryland | Kentucky | Indiana | Arizona | Nevada | Colorado | Colorado | Washington |
| Georgia | Arizona | Pennsylvania | Maryland | Tennessee | New Mexico | New Mexico | Georgia | Georgia | West Virginia |
| Arizona | West Virginia | Rhode Island | Arizona | West Virginia | West Virginia | Washington | Nevada | Nevada | New Jersey |
| Nebraska | New York | West Virginia | Oregon | Kansas | Maryland | West Virginia | New Hampshire | New Hampshire | Ohio |
| Oregon | Maine | New Hampshire | Utah | Oregon | Delaware | Connecticut | North Dakota | North Dakota | Rhode Island |
| New Mexico | Maryland | Wisconsin | Washington | Wyoming | Massachusetts | Massachusetts | Oregon | Oregon | South Dakota |
| Utah | New Jersey | Minnesota | New Mexico | Idaho | Maine | New Hampshire | South Carolina | South Carolina | Tennessee |
| Nevada | Connecticut | Vermont | Nevada | Nebraska | New Jersey | Alaska | Wisconsin | Wisconsin | Texas |
| Wyoming | Delaware | Montana | Wyoming | Montana | New York | Delaware | Alaska | Alaska | Vermont |
| Idaho | Massachusetts | Idaho | Idaho | Utah | Alaska | Hawaii | Hawaii | Hawaii | Virginia |
| North Dakota | New Hampshire | Nevada | Montana | Nevada | Vermont | Maryland | Iowa | Iowa | Wyoming |
| South Dakota | Vermont | North Dakota | South Dakota | North Dakota | Hawaii | Pennsylvania | Mississippi | Mississippi | Colorado |
| Montana | Rhode Island | South Dakota | North Dakota | South Dakota | Connecticut | Rhode Island | Oklahoma | Oklahoma | Connecticut |
| Alaska | Alaska | Alaska | Alaska | Alaska | New Hampshire | New Jersey | South Dakota | South Dakota | Hawaii |
| Hawaii | Hawaii | Hawaii | Hawaii | Hawaii | Rhode Island | New York | Vermont | Vermont | Louisiana |
| • ATA = American Trucking Associations • CVSA = Commercial Vehicle Safety Alliance • OOIDA = Owner Operator Independent Drivers Association | |||||||||
From the information that FHWA received, a total of 36 State DOTs (72 percent) responded affirmatively to the question: “Do you have a problem with commercial vehicle truck parking in your State?” Figure 8 shows that States reporting no problems include the Midwest/Southern States of Alabama, Mississippi, Oklahoma and Kansas; New England/Mid-Atlantic States of Maine, New Hampshire and Rhode Island, and West Virginia; northwest States of North Dakota, South Dakota and Idaho; Hawaii and Ohio.
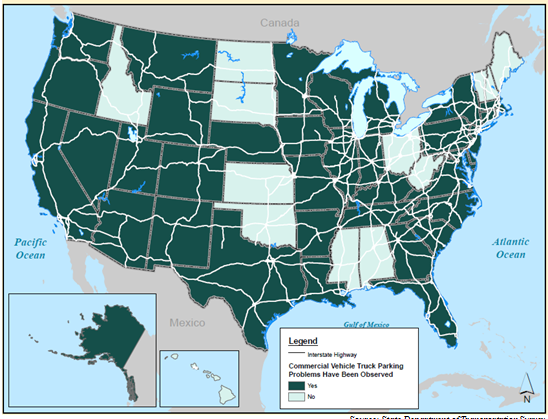
Source: State Department of Transportation Survey
In observing parking problems, Figure 9 provides the percentages of States reporting several different types of parking problems.
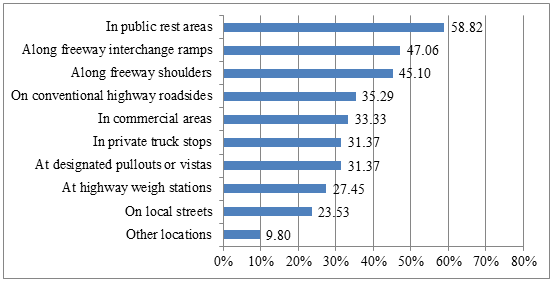
Source: State Department of Transportation Survey.
The following figures illustrate the States that report an observation of problems at designated parking areas such as pullouts, private and public spaces, and where trucks are either not permitted or in places such as commercial areas. For example, Figure 10 illustrates the 31 percent of States that observed shortages at designated pullouts. This represents 44 percent of all States reporting a parking problem. This is especially prevalent in the Western and Southwestern States including Oregon, Nevada, Utah, Wyoming, Colorado, Arizona, New Mexico, Texas and Arkansas; eastern coastal States of Massachusetts, Connecticut, Rhode Island, New Jersey and Virginia; and upper Great Lakes area States of Minnesota and Wisconsin.
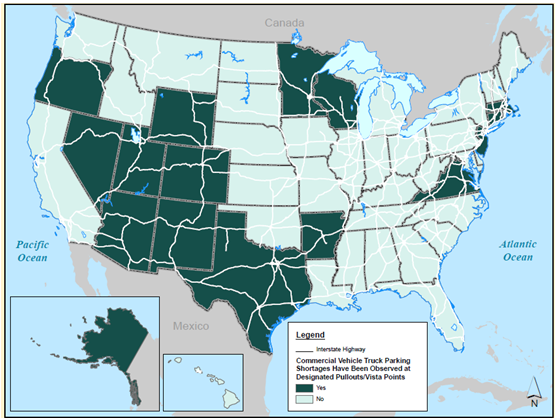
Source: State Department of Transportation Survey.
Figure 10 - States with Shortages at Designated Pullouts or Vistas
Similarly, 31 percent of States observed shortages at private truck stops including the eastern coastal States along the I-95 corridor, Great Lakes region States, Western and Southwestern States including California (Figure 11).
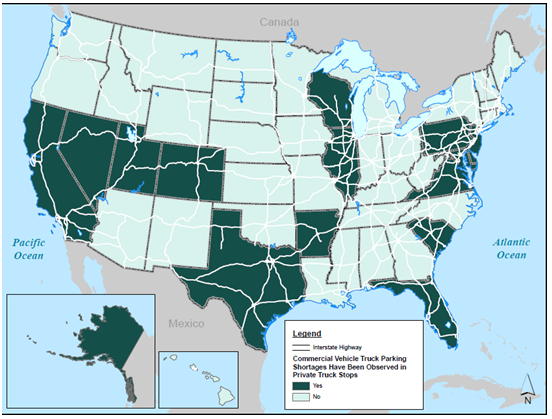
Source: State Department of Transportation Survey.
Fifty-nine percent of States observed shortages in public rest areas in similar areas such as the Western and Southwestern States, Great Lakes area States, eastern coastal States along the I-95 corridor and Eastern States, including those with parts of the I-81 corridor (Figure 12).
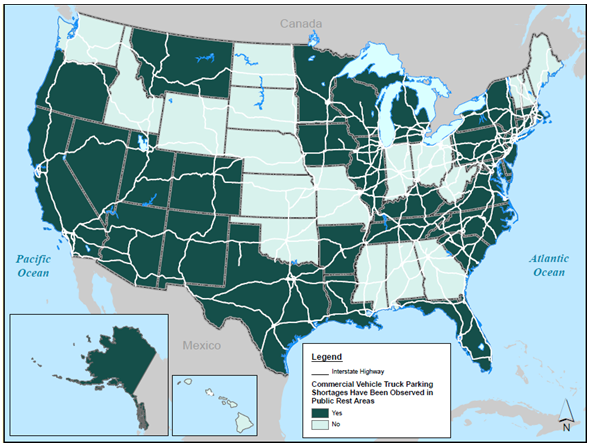
Source: State Department of Transportation Survey.
The locations where States reported trucks parking that were either illegal or non-designated spaces include freeway shoulders, freeway interchanges, weigh stations, local commercial areas, conventional highway roadsides, and local streets. There are similar patterns of parking issues in these types of locations to the areas of shortages. The Western and Southwestern States along corridors such as I-70, I-80, I-15 and I-5; the Great Lakes States surrounding the Chicago metropolitan region and major freight intermodal facilities; I-95 eastern coastal States; and the I-81 corridor States through Appalachia reported problems in these locations, with most of the problems reported on freeway shoulders and freeway interchanges.
In addition:
- Twenty-three States report trucks parking along freeway shoulders (Figure 13);
- Twenty-four States report trucks parking along freeway interchange ramps (Figure 14);
- Fourteen States report shortages at highway weigh stations (Figure 15);
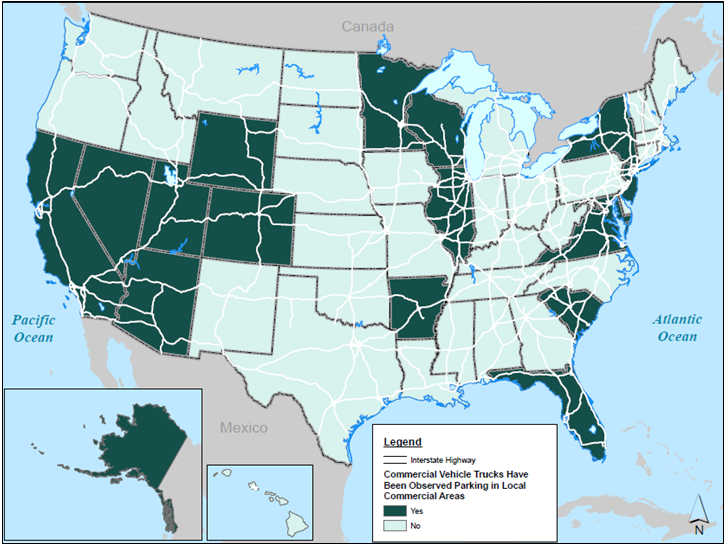
- Eighteen States report shortages in commercial areas (Figure 16);
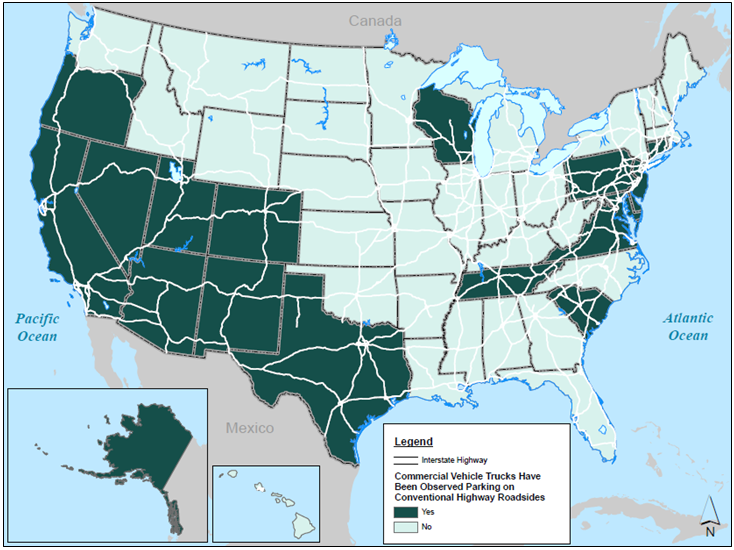
- Eighteen States report trucks parking on conventional highway roadsides (Figure 17);
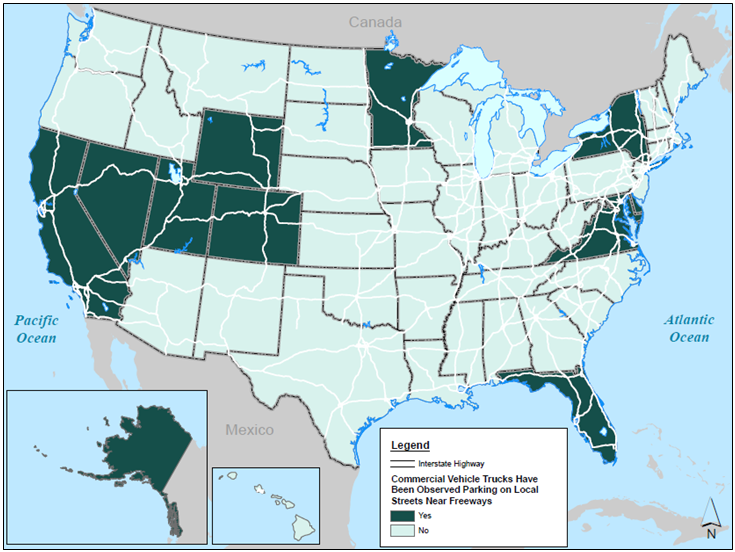
- Twelve States report trucks parking on local streets (Figure 18).
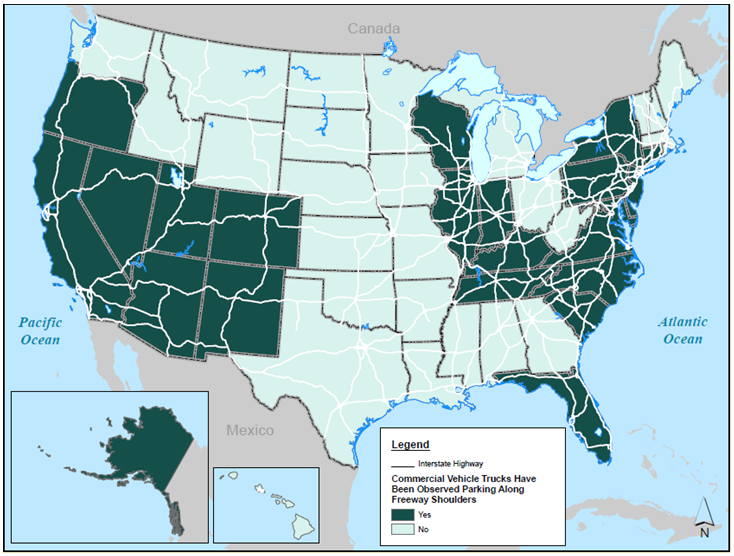
Source: State Department of Transportation Survey.
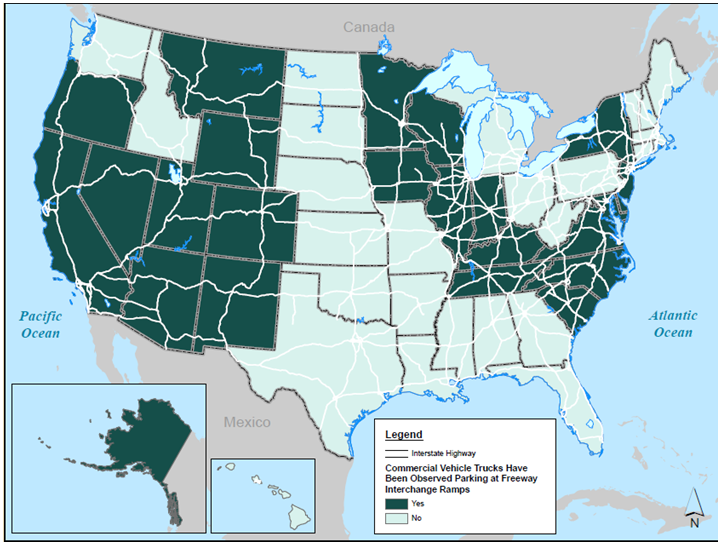
Source: State Department of Transportation Survey.
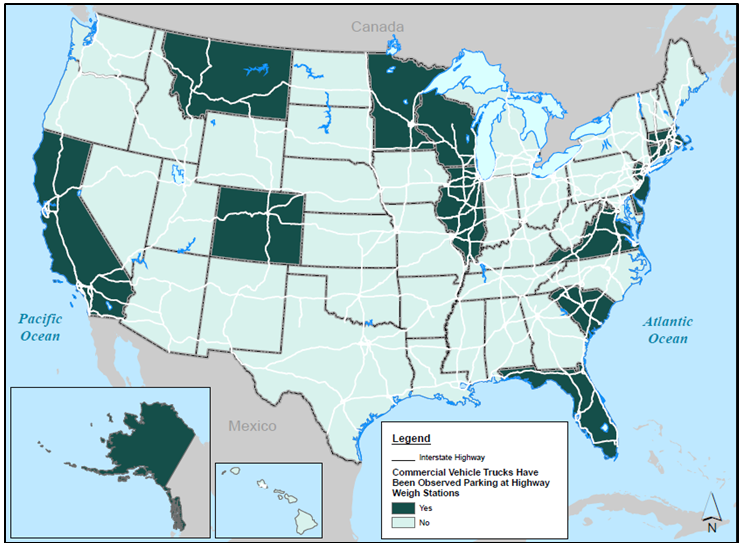
Source: State Department of Transportation Survey.
Source: State Department of Transportation Survey.
Source: State Department of Transportation Survey.
Source: State Department of Transportation Survey.
Analysis of parking availability and in relation to key indicators of VMT, NHS, and GDP reveal patterns consistent with the national AADTT as shown in Figure 19. Major corridors with significant truck traffic are corridors with the most parking spaces and the most challenges, as will be discussed below. The following trends emerged from the data on parking availability and in relation to key indicators.
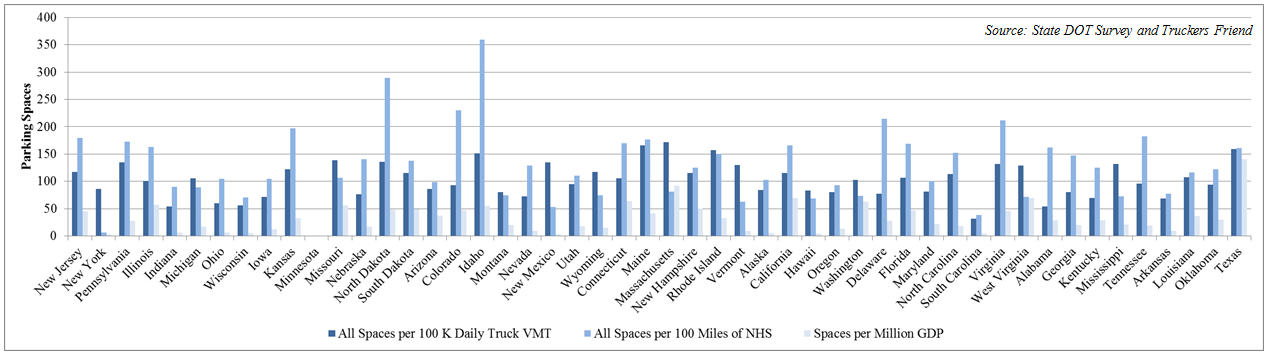
GDP = Gross Domestic Product NHS = National Highway System VMT = Vehicle miles traveled
Source: StateDepartment of Transportation Survey and 2015 Truckers Friend
Highest Number of Facilities and Spaces
Total Facilities and Spaces
The highest number of spaces appear to be in States clustered along the major freight corridors of I-20, I-70, I-95, and I-5. The State with the most truck parking spaces is Texas followed by the north-central area States of Illinois, Missouri, Indiana, Ohio and Pennsylvania; the Southern States of Louisiana, Alabama, Georgia and Florida; and California. States with the least parking (aside from Hawaii and Alaska) are clustered in New England and the northeastern coastal States, the Northwest in North Dakota and South Dakota, and West Virginia.
However, considering the number of spaces alone does not reflect any information in relation to the amount of truck activity, origins and destinations, and length of travel or mileage requiring truck parking accommodations. To understand the level of truck parking in each State, FHWA analyzed the number of total spaces in relation to the basic key indicators of need including VMT, NHS mileage, and GDP. The results are summarized in Figure 19. Future analyses should consider additional aspects related to need to best identify where parking should occur. For States with the highest number of spaces per 100,000 miles of VMT, there are no specific clusters or patterns. There is some clustering of States such as the Northwestern States and Western States, including Montana, Wyoming, Idaho, Nevada, and Arizona. There is also some limited clustering of States in the Northeast, including Vermont, New Hampshire, and Massachusetts. The States with the lowest number of total spaces in relation to VMT are California and Utah in the West; Illinois and Ohio in the east/north-central region; Maryland, Delaware, Rhode Island and Maine in the Mid-Atlantic and in the Northeast; and Tennessee and Florida. Some States with higher VMT such as Indiana have a high number of spaces relative to VMT, but many of the States with a high ratio are actually low VMT States.
When compared to the NHS, States with the highest number of spaces per 100 miles of NHS were clustered along corridors such as I-70 and I-20. These are mostly the east/north-central States around the Chicago metropolitan region and the Southern States all along I-20. The States with the lowest number of total spaces compared to the NHS are clustered in the Northeast, specifically in New England; in the northern part of the Midwest in North and South Dakota and Minnesota; and in Washington.
Comparing the States with the highest spaces to the GDP per million, there is less of a pattern except the northern central States around the Chicago metropolitan region all have the highest number of spaces in relation to GDP. These include Wisconsin, Illinois, Missouri, and Ohio. New York, Florida, and Texas are also States with high numbers of spaces relative to GDP, congruent with the significant freight activity in their States. There are also a high number of spaces relative to GDP in Kentucky and Tennessee, as well as in Nebraska. The States with the lowest number of spaces to GDP are mostly Northeastern States, California and Utah in the West, and West Virginia and North Carolina.
Private Facilities and Spaces
The highest number of private truck facilities was observed in States clustering along the I-5, I-70, and I-20 corridors. States with the lowest number of private truck facilities were clustered in the Northeast, the Delmarva Peninsula, and West Virginia, as well as in the West in Oregon and Nevada. States with the highest and lowest number of private truck parking spaces are clustered similarly to the States with the highest and lowest number of facilities. When evaluating private spaces in relation to 100,000 miles of VMT, the States with the highest rates are clustered in the Northwest and in the South as well as in Missouri and Indiana in the east/north-central region. Those with the least spaces to VMT are clustered in the Northeast but also include Washington and California in the West as well as Florida and Ohio. Comparing the spaces in each State to miles of the NHS, the clustering looks similar to the clustering found along key corridors of I-70 and I-20, as well as other east-west routes through Appalachia. The States with the lowest number of spaces relative to NHS mileage are the Northeastern States as well as the States along the northwest border with Canada.
Public Facilities and Spaces
States with the highest number of public truck parking facilities are clustered around the east/north-central region, the Northwest, and the Western I-5 corridor (Washington and California) and include Texas, Florida, and other Southeastern States. These States are primarily around the I-75, I-80, I-90, I-94, and the I-10 corridors. States with the lowest number facilities are mostly Northeastern States as well as some stretching from east to west, from Arkansas through Oklahoma to points further west. This includes the I-70, I-40 and I-25 corridors. States with the highest number of public spaces are heavily clustered in the east/north-central region but also include Georgia and Florida, Texas, and Wyoming, Washington, and California in the West. The States with the lowest number of spaces are those clustered primarily in the Northeast, but also include Arkansas and Oklahoma in the Midsouth, North Dakota, and the Western States of Idaho and Nevada.
When evaluated in relation to 100,000 VMT, the States with the highest number of spaces are in New England and the upper Midwest primarily but also include Michigan and Indiana in the east/north-central region as well as Florida and West Virginia. States with the lowest ratio of spaces to VMT are primarily the Midsouth States, including and surrounding Texas, but also include California in the West and Rhode Island and Delaware in the Northeast. Comparing the number of public spaces to 100 miles of NHS in each States, the States with the highest number of spaces include the east/north-central States around the Chicago region, some Northeastern States around but not including New York (such as New Jersey, Vermont and Pennsylvania) Southeastern States (Georgia, South Carolina, and Florida), and Wyoming. The States with the lowest number of spaces to NHS miles are New York and the Northeastern States of Rhode Island and Massachusetts, Midsouth States including and surrounding Texas, and the Western States of California and Nevada.
Ratio of Public to Private Spaces
To provide another analysis of the spaces, the ratio of the public and private spaces in each State was evaluated. The States with the highest ratio of public-to-private spaces are predominantly in the Midwest and along the I-10 and I-20 corridors in the South. The States with the lowest ratio are mostly in the Northeast but also include West Virginia, Michigan, Florida, Colorado, Montana and Washington.
Observations on Quantitative Analysis of Facilities and Spaces
Most States report that they are experiencing a truck parking problem. Those that are not are predominantly rural States with a few exceptions. (For example, Ohio did not report a parking problem but has significant truck activity, high numbers of spaces relative to GDP and the NHS (but not relative to VMT) and is a State with significant population and economic activity. Ohio’s neighboring States generally report truck parking problems and have similar characteristics to Ohio’s truck activity and demographics.)
There is clustering of States with truck parking issues, and these appear as expected in areas of significant economic activity such as major metropolitan areas or in areas with significant freight intermodal activity and along major freight routes. There are high levels of parking issues surrounding the Great Lakes in the Chicago metropolitan region and along the I-95 corridor, as well as the I-81 corridor in the East, the I-5 corridor in the West, and along east-west routes such as I-70, I-40, I-80, etc.
States reporting shortages at designated parking locations varied by type of location. Different parts of the country may have different approaches to providing truck parking spots. The reports of shortages may be affected by this, and so these reports may be more or less pronounced depending on the focus of the State. States with significant parking programs may identify more shortages than States with less data. Shortages at designated pullouts and vistas are clustered mostly in the Southeast and up west through the Rocky Mountain States. There were some States surrounding New York, particularly New Jersey and Connecticut, but New York State did not report shortages at pullouts. Alternatively, States such as Texas, California, Indiana, Pennsylvania, and Florida all report high levels of parking but have shortages at private truck stops. Specifically, California, Texas, and Indiana had the highest number of private spaces but still report shortages. California and Texas do have fewer spaces relative to VMT and NHS, while Indiana is one of the States with the highest number of spaces relative to NHS. However, Texas is in the top 25 percent of States with spaces relative to GDP. Public rest area shortages are clustered in the Midsouth, Southwest, and West Coast, along the east coast and Appalachia (such as along I-95 and I-81), and in States around the Great Lakes except for Indiana and Ohio, both of which reported high numbers of public spaces. Parking in non-designated areas such as along highway shoulders and at freeway interchanges clustered along the east coast routes, such as on I-95 and I-81, as well as around the Great Lakes/Chicago area and in the Western States.
Qualitative Analysis of Comments
In addition to the quantitative results of the data provided by States to the questionnaire, States were given the opportunity to provide comments. These comments reflect many of the STWG perspectives, but provide some additional points on State truck parking needs. A qualitative analysis was performed to identify themes and issues related to those themes, including:
- Parking at Night
- Many States reported that most parking problems occur at nighttime hours. Most utilization information States provided indicated shortages in the availability of truck parking beginning in the evening hours and extending through the late morning hours the next day. States reported that delivery timing and hours of operation at freight facilities such as ports limit when trucks can operate at these places and can dictate the schedule such that truck drivers need more parking at night rather than opportunities to deliver throughout the 24-hour period.
- Weather Impacts
- States reported parking problems during weather events. Many States report significant issues with winter weather and parking availability. Some States, such as Maryland, Missouri and Washington, have developed communication tools to guide truckers to emergency parking areas for safety. Planning for and mitigating weather impacts on parking is often a serious challenge for both law enforcement and State DOTs.
- Lack of Resources to Fund Parking Projects or for Enforcement
- States report identifying and securing funding to create truck parking capacity is challenging. When pitted against many other transportation priorities, it is difficult to secure funding for projects. Additionally, States cite needs for enforcement funding and other commercial motor vehicle safety needs to help resolve problems.
- Supply Chains and Changes in the Economy
- States report challenges in understanding freight flows and supply chains to inform their planning needs in directing resources to locations with the most need for parking. This is further complicated as the economy changes or there is an elastic reaction to economic changes in a particular transportation mode. Additionally, changes in logistics operations such as just-in-time supply chain logistics have introduced changes to freight volumes that States need to consider. Origins and destinations of goods flow also need to be considered beyond State borders and at the corridor level.
- Planning
- States report challenges with land use and transportation or corridor planning. Plans in one region or State have an impact on the surrounding region, which may change the truck parking needs. States suggest that truck parking planning be part of economic development and land use planning for both commercial and residential developments.
- Short- and Long-Term Parking Needs
- Numerous States remarked that there are major differences in truck parking needs. While much focus is usually on long-haul, overnight truck parking needs, there is a significant amount of short-term rest or queuing parking shortages. States discussed the need to understand the freight movement characteristics of the States and region to understand the types of truck activity that occurs and the related parking needs.
- Safety in Design and Operation
- Several States cited issues related to the mix of trucks and passenger vehicles at rest areas and truck stops. Issues related to chrashes when cars mix with trucks at facilities were noted. In addition, States discussed the types of parking facilities and how they are designed and aligned for various types and sizes of trucks so that trucks and cars are able to access facilities safely.
- Communication
- States cited needs related to communicating truck parking information to drivers. This could include information on locations, spaces available, amenities, hazards, regulations and other information to help drivers find appropriate parking. This is also relevant for routing trucks and parking during emergencies and weather events. States suggested apps and other notification approaches. In addition, States remarked that driver perception of parking issues becomes the reality that influences their parking decisions. Much needs to be done to communicate to drivers where parking is available to help drivers know the options.
- Location of Problems
- States, as well as other stakeholders, made numerous references to issues related to the location of parking. Metropolitan areas and corridors linking urban areas were cited as having the most issues. Additionally, freight intensive areas such as intermodal facilities, ports or major industrial areas were also cited as places where problems with parking are concentrated. Less information was provided for areas of the NHS off major corridors except to note that illegal parking or parking in non-designated areas such as at commercial areas before or after a delivery was observed.
- Regulations and Restrictions
- States reported that regulations and restrictions on trucks in terms of where trucks can park or for routing, as well as for length of operation, present parking issues and challenges.
- Consistency of Information
- States reported that truck parking is an important issue and that there are numerous challenges, but there is a need to do more to understand the issue. Methods and metrics to assess parking, data, and other planning and project development needs exist to bring a consistent level of understanding of the issue to a national level.
State Motor Carrier Safety Officials
The FHWA asked State commercial vehicle enforcement and safety personnel to identify locations where they routinely observed trucks parked along shoulders, interchanges, ramps, and informal lots. Trucks parking at these locations are often an indication of insufficient capacity at nearby public and private facilities. Alternatively, trucks parking at these locations may also reflect the desire of a driver to stage the truck in order to synchronize arrival and departure times for destinations or departure locations. Commercial vehicle and safety personnel patrolling the interstates are generally in a position to observe these parking behaviors.
The FHWA received responses from safety officials in a total of 50 States. Hawaii is an exception because it does not have public or private truck parking facilities. As previously identified, there is a general need to improve the States’ motor carrier safety data. The reporting of locations of illegal parking varied depending on the focus and level of analysis in a given State. Some States submitted in-depth and detailed reports while other States submitted information on key or single locations with the most problems. As an example, Maryland submitted survey work that catalogued several hundred locations. When considering the numbers of locations by State, this makes Maryland seem to have the most problems. However, this appearance is due to the comprehensive analysis submitted, which is more detailed than the materials most other States were able to submit at the time. Therefore, it is difficult to compare the levels of unofficial parking by State in this report. More focus and consistency in methodology and analysis is needed to capture an understanding of illegal or unofficial parking issues. For most States, State motor carrier safety official responses included the location, time of day, day, and month of the parking issues. Some States were able to indicate a level of severity, indicating safety risks, and to provide other identifying information about the observations. Almost every State could identify locations where unofficial or illegal parking occur, but very few could provide information beyond the location on the hours, days, or months of the unofficial parking activity. Ninety-four percent of State motor carrier safety officials were able to identify a location where unofficial or illegal truck parking occurred, but only 20 percent could provide an indication of the hours when this activity occurred at the reported locations. Eighteen percent provided an indication of the days of the most illegal or unofficial activity, and 22 percent indicated the month with the most illegal or unofficial activity.
As summarized in Table 9, nearly three-quarters of State motor carrier safety officials (73 percent) identified from one to five unofficial parking locations. Approximately 22 percent of States (11 in total) listed 11 or more locations. These States included: California, Idaho, Indiana, Maine, Maryland, Michigan, Nevada, North Carolina, North Dakota, South Carolina, and Utah.
| Number of Locations Reported | Number of States | Percent |
|---|---|---|
| 1 to 5 | 34 | 71 |
| 6 to 10 | 3 | 6 |
| 11 or greater | 11 | 22 |
| Total | 48 | 99 |
As presented in Figure 20, the unofficial parking locations generally fall into four general categories: freeway entrance and exit ramps, freeway shoulders, roadways accessing freeway ramps, and informal as well as formally designated parking lots.
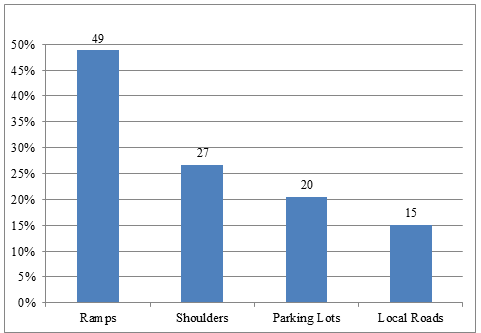
Source: Commercial Vehicle Safety Alliance Survey
Figure 21 summarizes the reported hourly distribution of vehicles parked at these unofficial or illegal locations. Generally, trucks were observed parking at these locations during the early evening (7 PM to Midnight) and overnight hours (Midnight to 7 AM) than during daylight hours.
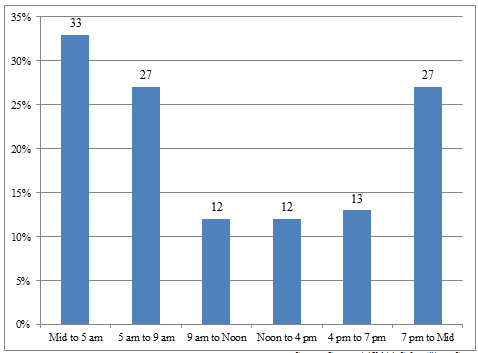
Source: Commercial Vehicle Safety Alliance Survey
Figure 22 summarizes the daily distribution of vehicles parked in unofficial or illegal locations. The highest rates occur during weekdays, with lower rates observed during weekends.
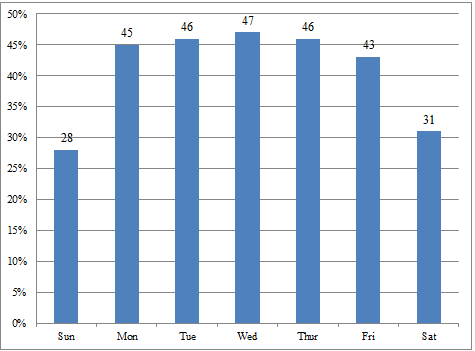
Source: Commercial Vehicle Safety Alliance Survey
Figure 23 presents the monthly distribution of vehicles parked at unofficial locations. The results indicated a fairly consistent pattern of parking throughout the year.
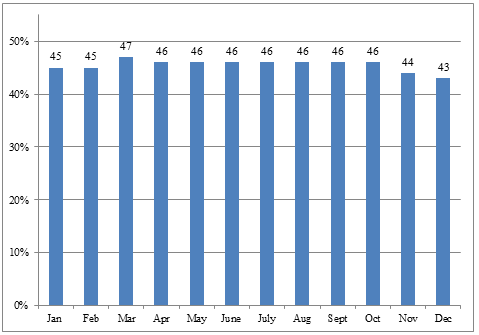
Source: Commercial Vehicle Safety Alliance Survey
FHWA counted and analyzed the locations of reports of unofficial and illegal parking in each State. An analysis of the location counts reveals States with higher numbers of reports reflect some clustering in the Northwest and West, as well as in the east/north-central region and along the I-95 corridor. States with the fewest State motor carrier safety officials reports were found along I-95 corridor but also include Louisiana and Texas in the South up through the Mountain States. Maryland submitted an in-depth report of problem locations, which skews the results.
Respondents were offered the opportunity to provide more information regarding the unofficial parking locations by answering an open-ended question. Several comments indicated unofficial parking behavior relates to a shortage of official parking spaces at an official location. Other comments suggested that unofficial parking occurs only during short periods of time as vehicles park to stage deliveries.
Commercial Truck Drivers and Trucking Firm Logistics Personnel
FHWA conducted a survey of the following three driver stakeholder groups: OOIDA, ATA drivers, and ATA managers and logistics personnel (dispatchers). The OOIDA members are typically independent operators while ATA driver members are typically associated with fleet operations. ATA managers and logistics personnel primarily include schedulers and dispatchers for ATA drivers. FHWA received a total of 8,399 responses, including 7,331 from OOIDA members, 819 from ATA drivers, and 249 for ATA management and logistics personnel. Responses were completely voluntary, and results are provided for informational purposes only. The results do not reflect the responses of a representative sample of drivers in each State or by any category. Results are displayed for comparison purposes among driver stakeholder groups and should not be interpreted as representative of the opinions of all members of these groups.
Respondents consisted of drivers or professionals involved in mostly long-haul trucking operations requiring rest periods and incorporation of long-term parking in their routing. As summarized in Table 10, nearly all of the driver respondents report delivering goods in more than one State and having a need for parking and required rest. Nearly 90 percent of the trucking professionals (i.e. dispatchers) report scheduling drivers traveling in more than one State and triggering a need to park to satisfy rest requirements.
| Yes/No | ATA Drivers | OOIDA Drivers | ATA Professionals |
|---|---|---|---|
| Yes | 96% | 97% | 87% |
| No | 4% | 3% | 13% |
| 100% | 100% | 100% | |
| ATA = American Trucking Associations • OOIDA = Owner Operator Independent Drivers Association | |||
Finding parking is a problem for these respondents. As presented in Figure 24, over three-quarters of drivers and nearly two-thirds of professionals report regularly experiencing problems over the past year in finding a safe location to park when rest or sleep is required or desired.
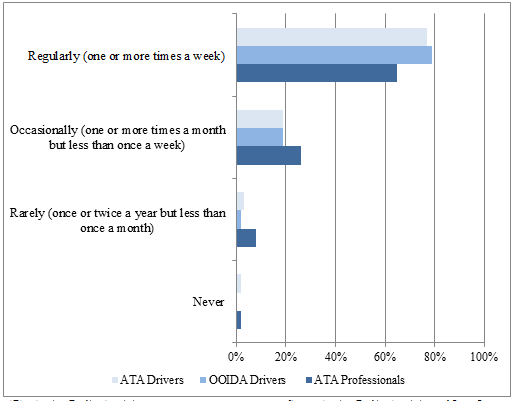
ATA = American Trucking Associations
OOIDA = Owner Operator Independent Drivers Association
Source: American Trucking Associations and Owner Operator Independent Drivers Association Survey
The respondents reported difficulty in finding parking during the overnight hours. As presented in Figure 25, over 90 percent of OOIDA and ATA respondents report difficulty in finding safe truck parking from 7 PM to midnight and over 60 percent report having difficulty from midnight to 5 AM. The competition for parking spaces is highest during the early evening to overnight time periods as most drivers rest during these periods. Respondents reported a much lower level of difficulty during early morning and mid-day hours as trucks are generally in over-the-road operations during these periods.
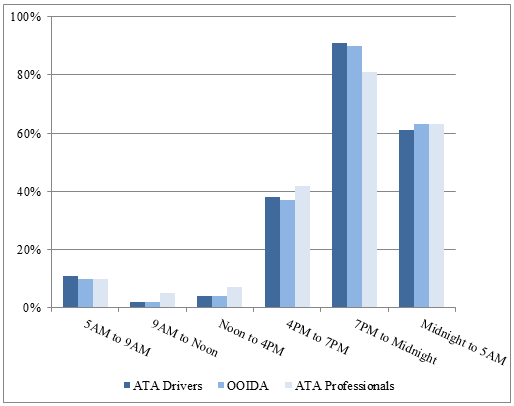
ATA = American Trucking Associations
OOIDA = Owner Operator Independent Drivers Association
Source: American Trucking Associations and Owner Operator Independent Drivers Association Survey
Drivers and dispatchers report that it is more difficult to find safe parking during the weekdays as opposed to the weekends. As presented in Figure 26, the highest levels of weekday difficulty are reported for Mondays and the lowest level of difficulty occurring on Fridays. In general, however, respondents reported a high level of difficulty consistently across all weekdays, implying that drivers travel during the weekdays at a higher rate than weekends. Note that nearly half of drivers report a problem on Sunday and over one-third report a problem on Saturday.
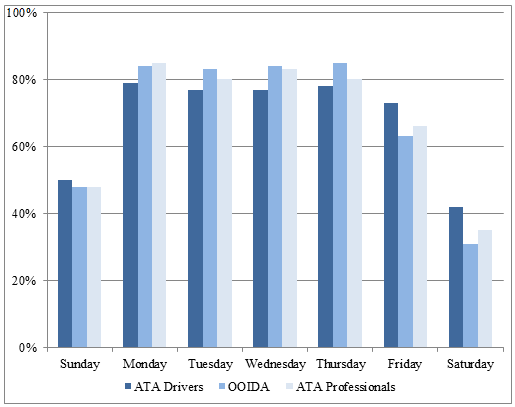
ATA = American Trucking Associations
OOIDA = Owner Operator Independent Drivers Association
Source: American Trucking Associations and Owner Operator Independent Drivers Association Survey
Drivers report that a high level of difficulty in finding safe parking occurs throughout the year. As summarized in Figure 27 for drivers, there is no specific pattern revealed among months of the year.
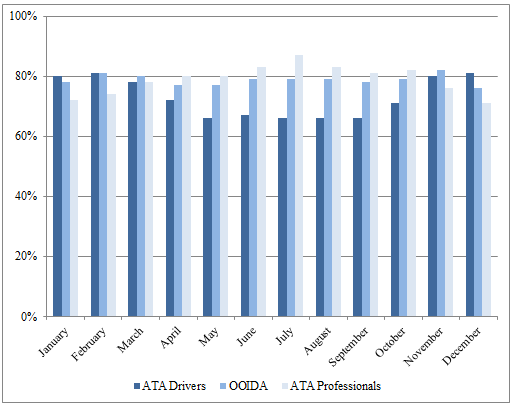
ATA = American Trucking Associations
OOIDA = Owner Operator Independent Drivers Association
Source: American Trucking Associations and Owner Operator Independent Drivers Association Survey
In summary, for drivers and dispatchers, the most difficult periods to find safe parking occurred during the overnight hours, on weekdays, and consistently throughout the year.
FHWA also asked drivers to identify geographic regions with a shortage of safe truck parking. Figure 28 summarizes the results of both OOIDA and ATA. Drivers and management and logistics personnel cited the Mid-Atlantic (New York, Pennsylvania, and New Jersey) as a region with shortages followed by New England (Maine, New Hampshire, Vermont, Massachusetts, Rhode Island, and Connecticut), the Midwest and east north-central region (Illinois, Indiana, Ohio, Michigan) and the southern coastal Atlantic States (Delaware, Maryland, District of Columbia, Virginia, West Virginia, North Carolina, South Carolina, Florida).
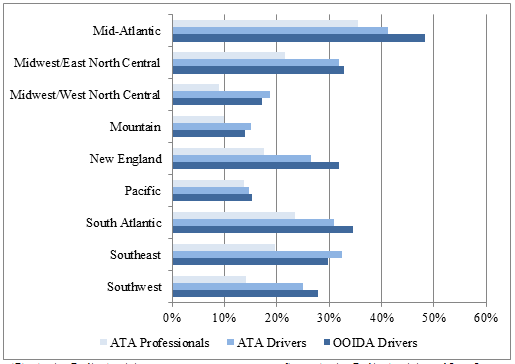
ATA = American Trucking Associations
OOIDA = Owner Operator Independent Drivers Association
Source: American Trucking Associations and Owner Operator Independent Drivers Association Survey
Drivers were also asked to identify geographic locations with sufficient parking by region. Figure 29 summarizes the results of both OOIDA and ATA.
Drivers and logistics personnel cited the Southwest (Oklahoma, Texas, Arkansas, Louisiana) as a region with sufficient parking followed by the Southeast (Kentucky Tennessee, Mississippi, Alabama), the Midwest and west north-central region, the Midwest and east north-central region, and the Mountain States (Idaho, Montana, Wyoming, Nevada, Utah, Colorado, Arizona, New Mexico). The Mideast and east north-central region, the Southeast, and the Southwest were all cited as having sufficient parking even though drivers also cited the same regions for shortages, as previously described.
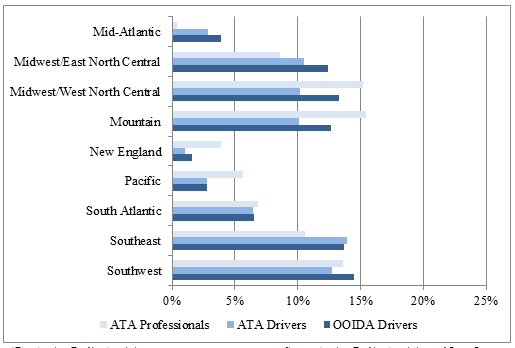
ATA = American Trucking Associations
OOIDA = Owner Operator Independent Drivers Association
Source: American Trucking Associations and Owner Operator Independent Drivers Association Survey
An analysis of the locations with shortages reported by both OOIDA and ATA drivers and ATA firm management and logistics personnel highlights problems mostly in the East on the I-95 and I-81 corridors, as well as the I-70 corridor through the Chicago region. They also cite California and issues along the I-5 corridor. Drivers report relatively similar information for areas of sufficient parking. Most cite the Midwest and West as regions with sufficient supply and cite the Northeast as the area with the most need for parking.
The comments provided by these drivers were analyzed to determine more locational information about shortages. Figure 30 illustrates the top 15 corridors cited by these drivers as having significant truck parking shortages. The interstates cited by these groups are consistent with reported problems and insufficient supply.
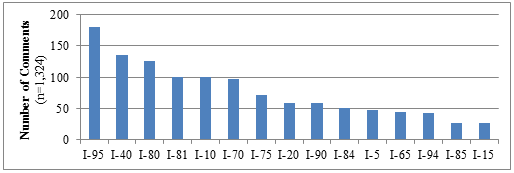
Source: American Trucking Associations and Owner Operator Independent Drivers Association Survey
Private Travel Plaza and Truck Stop Operators
FHWA surveyed private truck stop owners and operators to characterize the nature of truck parking demand at private truck stops. A total of 387 truck parking facilities located throughout the Nation responded. Responses were voluntary. For the purpose of this report, the responses are used to represent the industry as whole. The results are useful in characterizing facility features in order to establish a general understanding of industry experience related to truck parking demand and overcrowding.
The respondents operate a high number of truck parking spaces. Respondents operated an average of 154 total parking spaces for all vehicles and an average of 113 truck parking spaces per facility. Figure 31 summarizes the distribution of the number of total parking spaces and truck parking spaces operated by these properties. Slightly over half (51 percent) operated between 0 and 99 truck parking spaces; more than one-third (37 percent) operate between 100 and 199 truck parking spaces; a total of 7 percent operate between 200 and 299 truck parking spaces; and 5 percent operate over 300 truck parking spaces. Nearly all (97 percent) of the respondents operate 24 hours per day.
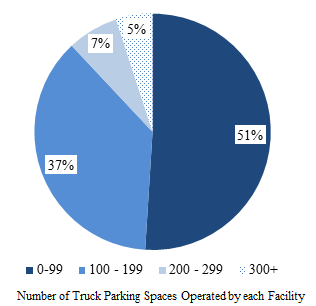
Source: National Association of Truck Stop Operators Survey
Respondents provided information regarding the hourly, daily, and monthly patterns of parking demand at their facilities. Similar to public rest areas, the highest reported periods of demand occur during the late afternoon, early evening, and overnight hours. As summarized in Figure 32, nearly half of the facilities (48 percent) report being more than 100 percent full from midnight to 5 AM and over one third (37 percent) report having truck parking occupancy between 76 percent and 100 percent from 7 PM to midnight.
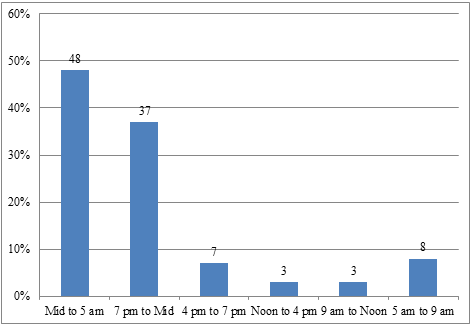
Source: National Association of Truck Stop Operators Survey
As summarized in Figure 33, similar to the public rest areas, private truck stops experience the highest levels of overcrowding during the weekdays.
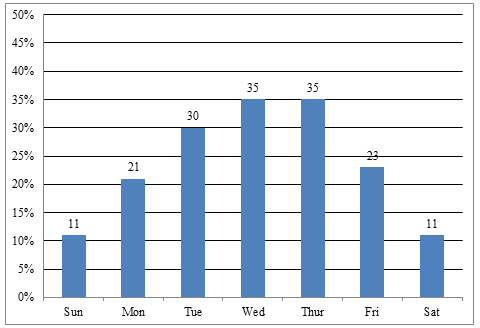
Source: National Association of Truck Stop Operators Survey
Finally, truck parking demand in private truck stops appears to be fairly consistent throughout the year for reporting facilities. As summarized in Figure 34, facilities report a high level of truck parking occupancy throughout the year, with approximately 50 percent reporting an occupancy of between 76 percent and 100 percent each month of the year.
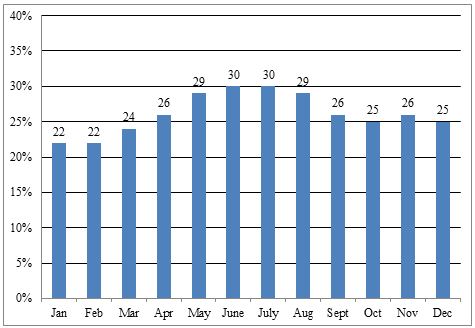
Source: National Association of Truck Stop Operators Survey
When asked about the need for additional spaces, 58 percent of respondents cited a need for additional spaces. Most responded that between 1 and 50 spaces were needed, but some responses cited a need for 100 or more spaces. Despite citing a need for additional spaces, only a few respondents cited the existence of plans to increase the number of spaces at a particular facility.
Discussion and Opportunities for Future Research
The following represent some of the key findings of this work grouped into three basic categories: 1) truck parking data and measurement needs; 2) perspectives of key stakeholders on truck parking issues; and 3) analysis of truck parking data and observations of regional clusters.
Data and Measurement Challenges to Illustrate Truck Parking Needs
The FHWA and the STWG aimed to collect as much data as possible to understand not only how much parking is available but also to receive detailed information on utilization, plans, costs, and other issues related to parking needs. A major finding of this report is that States have varying levels of data to inform truck parking analyses. While most States could provide information on observed problems and shortages, there was limited data on utilization, maintenance, and plans. In addition, most States could identify locations of unofficial or illegal parking, but very few could provide information beyond the location on the hours, days, or months of the unofficial parking activity.
A theme of both State DOTs and State motor carrier safety officials was how to establish a truck parking champion and how to work with stakeholders to bring attention and resources to the issues in the States. It was clear in the responses received that States know truck parking is a major problem and that stakeholders are citing problems with truck parking in every State, but there are challenges in how to quantify and illustrate the dynamics of the parking needs in the States and regions. State DOTs and State motor carrier safety officials have taken different approaches to measuring and focusing on truck parking needs, with some States developing robust assessments. However, there was a common theme that emerged from the survey responses that focused on what the responsibilities of the truck parking stakeholders should be and how best to understand, analyze, and advance the issues. The metrics system proposed later in this report may assist States in generating the stakeholder discussions that lead to better analysis and understanding of parking challenges, which may also lead to the identification of opportunities to alleviate shortages or other parking issues.
Varying Stakeholder Perspectives Can Yield Better Results in Solving Truck Parking Issues
Commensurate with the challenges in identifying champions among stakeholder groups to advance the parking needs in States are the differences in perspectives among stakeholders. During the process of developing this report, FHWA worked with both public and private stakeholders, and while their ideas did overlap, there were some significant differences in perspective. It is important to appreciate these differences to improve partnering to solve for truck parking needs.
For example, State DOT personnel focused their responses on the challenges they have in rallying stakeholders, in needing to understand where parking should go, and in how to convince the public that parking is an important need and to support parking development. States cited challenges in coordinating stakeholders and understanding which public agencies or offices should lead truck parking efforts. Many States were unsure of the level or role that the State needed to take in terms of balancing public and private parking efforts and private sector plans for future development to add or change parking locations.
Similarly, States cited a need to better understand freight flows and supply chains as well as industry requirements such as just-in-time deliveries that place specific delivery windows on drivers. States reported that this type of information could help them to better understand the need for parking and either to identify opportunities with stakeholders for the optimal locations for parking or to make any operational or capital improvements to alleviate shortages.
Another focus for States was in land-use control. States reported that land-use control occurs predominantly at the local jurisdictional level. It has been challenging for States to site truck parking locations due to negative public perceptions and local planning and zoning issues.
Similarly, State motor carrier safety official respondents focused on safety, changing public perceptions, and the concept that one size does not fit all when it comes to parking. Like State DOT personnel, State motor carrier safety officials cited the need for changing public perceptions about trucks and developing public support for resources to develop truck parking through an understanding of safety needs and the connection between the trucks and the goods consumed. State motor carrier safety respondents viewed public awareness as an opportunity to grow support for safety initiatives including parking improvements. However, these respondents were focused on safety improvements. This included enforcement and monitoring of unofficial truck parking and understanding issues related to driver fatigue and challenges with parking that could be remedied to avoid fatigue-related crashes. Finally, State motor carrier safety officials cited a need for thoughtful understanding of the diversity of truck operations, drivers and equipment. They view needs of different types of parking depending on the characteristics of the operation, as well as needs of public-private opportunities to increase parking opportunities.
The drivers and trucking firm management and logistics personnel responses focused on driver needs and amenities, on the need for parking to accommodate a range of trucks and operations, communication and technology, and perceptions and impacts of regulatory and enforcement activities. Key to the priorities voiced among drivers are preferences and amenities at rest areas to accommodate long-term and overnight parking. They cited different operations and characteristics of the truck and delivery as needing consideration and noted that not all trucks and drivers can be accommodated in the same way. Drivers also focused on the need for communication and ways to understand where parking is available with the amenities they require, as well as their perceptions about safety, enforcement, and regulations that determine the routing of their delivery and the timing and location of rest periods.
Private truck stop operators provided insight into the business and economic considerations of providing private parking as well as concerns on land use, siting for truck stops, and marketing locations to drivers. Private truck stop operators view truck parking through a lens of market need and cited their focus on customer- and market-driven needs as the basis for decisions to provide services. They also focused on the business aspects of providing truck stops, including perspectives on the costs of services such as fuel and other amenities that need to be considered in the development of stops and in relation to parking. They also provided perspectives on challenges associated with land use and zoning as well as the need to identify and understand where investment opportunities are located. In addition, private truck stop operators cited the importance of communication to drivers on locations and amenities of truck stops and their increased use of communication technology.
Observations from Truck Parking Data throughout the United States
The data collected from States and stakeholders are consistent in the identification of truck parking challenges and regions of shortages. While not every State indicated a problem with truck parking, a majority of States identified a truck parking problem and the general locations of shortages, such as unofficial or illegal parking along shoulders, ramps, on local streets, and in commercial areas. States reporting challenges and shortages correlate with the major corridors of truck traffic throughout the United States and in each State, such as along I-95 and I-81 on the east coast; I-70, I-40, and I-10 east and west across the Nation; I-5 on the west coast; and other significant truck corridors. They also naturally correlate with areas of significant freight activity and population such as the metropolitan areas along the east coast or the Chicago metropolitan areas in the east/north-central region. Shortages and problems are primarily evident during night hours beginning in the early evening and stretching to late morning. They occur mostly on weekdays, although significant activity is reported on weekends, and there is consistent activity during all months of the year.
State motor carrier safety officials responses reveal unofficial or illegal truck parking in most States with the most such parking in the east/north-central region and in some States along the east and west coast. Like State DOTs, unofficial parking was mostly spotted at night on weekdays and was consistent during all months of the year.
Over 90 percent of drivers reported difficulty and challenges finding parking during the same times that States are reporting shortages, especially at night on weekdays. Similar to regions of shortages and unofficial parking activity, drivers reported parking problems in clusters of States along the I-95 and I-81 corridors on the east coast and in the east/north central region in States along I-70. Drivers cited sufficient parking throughout some Midwest and Western States with the Mid-Atlantic being identified as a region with the least-sufficient parking.
There are over 1,908 public rest areas with a total of 36,222 spaces throughout the U.S., and there are over 6,376 private truck stops with over 272,698 spaces. The areas of the country with the greatest number of spaces are along the same corridors where States and drivers cite shortages. For example, corridors of I-20, I-70, I-95, and I-5 all have high levels of parking. When compared to mileage of the NHS, States in these areas, especially the east/north-central States, have the highest number of total spaces relative to NHS miles, and the highest number of spaces in relation to GDP. States with the lowest spaces to NHS and GDP are in the Northeast and along the I-95 and the I-5 corridors.
Private truck stop operators report an average of 113 truck spaces per facility with 51 percent operating stops that have less than 99 truck spaces and 37 percent having between 100-199 spaces. A majority of truck stop operators report a need for more spaces and would add up to 50 spaces, but very few responded that there were actual plans to increase the facilities to accommodate more truck parking. The truck stop operators reported utilization that reflected the driver and State utilization patterns revealing over-capacity night hours and busier weekdays. For truck stops, the utilization was more pronounced mid-week and mid-year.
Conclusion
To conclude, the data collected to illustrate the truck parking needs of States and supplemented by stakeholders reveals that regions of the country with significant truck activity may have high levels of parking, but utilization and shortages are still reported and problematic. Major truck corridors connecting metropolitan areas and major freight generating areas have the same challenges. Evaluating parking in relation to key indicators of VMT, NHS, and GDP gives an indication of where challenges may be more pronounced since these indicators provide a basic level of activity. In these cases, there is significant emphasis on regions and corridors such as the Chicago metropolitan region and the corridors through that area, the I-95 corridor and the Northeastern States clustered around the New York City metropolitan area, and I-5 and the western corridor connecting major west coast ports and freight activity. More analysis comparing parking with origins and destinations, freight generators such as distribution centers, intermodal facilities, and ports is necessary to fully understand these issues.
While major corridors and metropolitan areas are highlighted here, it is important to note that drivers, State motor carrier safety officials, and State DOT personnel cited problems in nearly all of the States. With a unified observation among stakeholders that more data and freight information, as well as champions among stakeholders, is needed, improvement of data and analysis of the truck parking issue should be considered in statewide and metropolitan freight planning activities. As States and private truck stop operators reported only a few plans to expand truck parking capacity, the incorporation of truck parking analysis and planning into the State or metropolitan freight plan, if one exists, may help to galvanize stakeholders and champions and build off of freight analytical information derived for the Plan to help advance opportunities for public, private or public-private investment.
Given the data challenges found in the work on this report, the system of metrics in the following section may help States in their work with stakeholders to obtain data, measure performance, and identify truck parking needs in each State and throughout each region. The system of metrics addresses some of the major gaps in data and measurement that States and other stakeholders were challenged to provide. Use of a system of metrics to understand not just levels of parking but also utilization, safety, land use aspects, and economic activity can inform planning, help to illustrate needs to the public, and encourage public and private investment in projects that improve the adequacy of truck parking.
7 United States Public Law 112-141 Section 1401.. [ Return to note 7. ]
8 Bureau of Economic Analysis, "Widespread But Slower Growth in 2013 - Advance 2013 and Revised 1997–2012 Statistics of GDP by State." Available at: http://www.bea.gov/newsreleases/regional/gdp_State/gsp_newsrelease.htm. [ Return to note 8. ]